Chiến lược giao dịch định lượng áp lực hai chiều

Tổng quan
Chiến lược giao dịch hai chiều áp lực là một chiến lược theo dõi xu hướng kết hợp các chỉ số ngẫu nhiên và các chỉ số giao dịch. Chiến lược này chủ yếu sử dụng các chỉ số ngẫu nhiên K và D và các chỉ số giao dịch để tạo ra tín hiệu mua và bán, hỗ trợ bởi các đồng bằng đường vàng và chết để tạo ra tín hiệu bổ sung.
Nguyên tắc chiến lược
Giao thức mua
Các tín hiệu mua hàng chính được kích hoạt bởi các logic sau:
-
K và D cùng phá vỡ khu vực oversold (ví dụ 20), và tạo ra một đường chéo lên, và K và D cùng có xu hướng tăng
-
Số lượng giao dịch cao hơn một ngưỡng nhất định (ví dụ: 1,4 lần số lượng giao dịch trung bình)
-
Giá đóng cửa cao hơn giá mở cửa (đường K màu trắng)
Các tín hiệu mua thêm có thể đến từ:
-
Kích thước trung bình: vượt qua đường EMA chậm trên đường EMA nhanh và hai đường trung bình cùng lúc tăng
-
K và D cùng một lúc đi vào khu vực oversold từ mức thấp (ví dụ như tăng từ dưới 20 xuống 20 đến 80)
Bán tín hiệu
Các động cơ chính của tín hiệu bán hàng là:
-
K-line và D-line cùng đi vào khu vực bán quá mức (ví dụ 80).
-
Đường chết trung bình: Đường EMA nhanh dưới đường EMA chậm
-
K đường dưới xuyên qua D đường và K và D đường cùng một xu hướng giảm
Tín hiệu dừng
Thiết lập một tỷ lệ phần trăm (ví dụ: 6%) của giá mua như là một đường dừng lỗ, và nếu giá giảm xuống đường này, nó sẽ kích hoạt bán lỗ.
Phân tích lợi thế chiến lược
- Sử dụng chỉ số ngẫu nhiên kép để tránh tín hiệu giả
- Kết hợp âm thanh lọc qua lại để đảm bảo xu hướng
- Nhiều tín hiệu được chồng lên nhau để tăng độ chính xác
- Đường trung bình giúp xác định xu hướng lớn
- Thiết lập chiến lược kiểm soát rủi ro
Lợi thế 1: Chỉ số ngẫu nhiên kép tránh tín hiệu giả
Một chỉ số ngẫu nhiên có thể tạo ra một số lượng lớn tín hiệu giả. Chiến lược này sử dụng kết hợp hai chỉ số ngẫu nhiên K và D (đường trung bình di chuyển của K) để lọc hiệu quả các tín hiệu giả và đảm bảo độ tin cậy của tín hiệu.
Ưu điểm 2: Chuẩn bị âm thanh khi giao thông quá tải, đảm bảo xu hướng
Thêm điều kiện khối lượng giao dịch làm tiêu chuẩn phán đoán phụ trợ, yêu cầu khối lượng giao dịch cần vượt quá một mức nhất định, do đó lọc các điểm mua và bán phi xu hướng ở mức thấp, giảm nguy cơ bị đặt hàng.
Ưu điểm 3: Nhiều tín hiệu chồng lên nhau, tăng độ chính xác
Chiến lược tổng hợp các tín hiệu mua và bán của các chỉ số ngẫu nhiên, khối lượng giao dịch, và đường trung bình cần được kích hoạt cùng một lúc để tạo ra một tín hiệu giao dịch thực sự. Nhiều chỉ số chồng lên nhau có thể làm tăng độ tin cậy của tín hiệu.
Lợi thế 4: Đường trung bình giúp xác định xu hướng lớn
Thêm các quy tắc phán đoán đường trung bình, chẳng hạn như chỉ xem xét tín hiệu mua khi đường trung bình tăng lên cùng một lúc. Điều này có thể tránh mua ngược hoặc lên đỉnh, đánh giá xu hướng từ chu kỳ thời gian lớn.
Lợi thế 5: Thiết lập chiến lược kiểm soát rủi ro
Chiến lược này bao gồm thiết kế tín hiệu dừng lỗ, nếu giá giảm một tỷ lệ nhất định khi mua. Điều này có thể kiểm soát hiệu quả tổn thất tối đa của một giao dịch.
Phân tích rủi ro
- Các tham số chính sách cần được thiết lập kỹ lưỡng, thiết lập không đúng cách có thể dẫn đến hiệu suất kém
- Cài đặt điểm dừng cần tính đến rủi ro nhảy
- Cần chú ý đến rủi ro tính thanh khoản của các loại giao dịch
- Cần chú ý đến rủi ro chuỗi của chỉ số nhiều chu kỳ thời gian
Rủi ro 1: Các tham số chiến lược cần được thiết lập kỹ lưỡng
Chiến lược này bao gồm nhiều tham số, chẳng hạn như tham số chỉ số ngẫu nhiên, tham số đường trung bình, tham số số giao hàng. Các tham số này cần được tối ưu hóa cho các giống khác nhau, thiết lập không đúng cách có thể dẫn đến kết quả kém hấp dẫn.
Rủi ro 2: Đặt điểm dừng để tính đến rủi ro nhảy vọt
Khi thiết lập điểm dừng lỗ, cần xem xét khả năng giá sẽ nhảy vọt. Nếu điểm dừng lỗ quá gần với giá mua, nó có thể bị nhảy vọt dẫn đến dừng lỗ không cần thiết.
Rủi ro 3: Cần chú ý đến rủi ro tính thanh khoản của các loại giao dịch
Đối với các giống kém lưu động, quy tắc số lượng giao dịch có thể lọc ra quá nhiều tín hiệu. Tại thời điểm này, cần giảm giới hạn điều kiện số lượng giao dịch.
Rủi ro 4: Rủi ro theo thứ tự của các chỉ số có nhiều chu kỳ thời gian
Có thể xảy ra sự cố không phù hợp giữa các chỉ số chu kỳ khác nhau, điều này có thể ảnh hưởng đến độ chính xác của tín hiệu. Cần xác minh sự phù hợp của tín hiệu điểm.
Hướng tối ưu hóa
Chiến lược này có thể được tối ưu hóa theo các khía cạnh sau:
-
Tối ưu hóa tham số để tăng tính ổn định
-
Thêm tham số điều chỉnh động cho phương pháp học máy
-
Tối ưu hóa chiến lược dừng lỗ để giảm tỷ lệ dừng lỗ
-
Thêm nhiều điều kiện lọc để giảm giao dịch
-
Cố gắng duy nhất điều kiện hoặc chiến lược dừng để tăng lợi nhuận
Đường hướng 1: Tối ưu hóa các tham số để cải thiện tính ổn định
Các tham số chính có thể được tối ưu hóa thông qua các phương pháp có hệ thống hơn như thuật toán di truyền, đảm bảo các tham số có thể đạt được hiệu suất ổn định trong các chu kỳ thị trường khác nhau.
Hướng 2: Thêm tham số điều chỉnh động cho phương pháp học máy
Mô hình có thể được đào tạo để đánh giá tình trạng thị trường trong thời gian thực và điều chỉnh các tham số chiến lược để tối ưu hóa các tham số động.
Đường 3: Tối ưu hóa chiến lược dừng lỗ để giảm tỷ lệ dừng lỗ
Có thể nghiên cứu các chiến lược dừng lỗ tốt hơn, giảm thiểu tổn thất không cần thiết và tăng lợi nhuận trong khi vẫn kiểm soát rủi ro.
Tiến độ 4: Thêm nhiều điều kiện lọc để giảm số lần giao dịch
Cần tăng cường các điều kiện lọc để giảm số lần giao dịch, giảm tác động của chi phí giao dịch, làm cho mỗi giao dịch mang lại lợi nhuận cao hơn.
Đường hướng 5: Thử các chiến lược đơn điều kiện hoặc dừng để cải thiện lợi nhuận
Theo đặc điểm của thị trường, có thể thiết kế một chiến lược duy nhất hoặc chiến lược dừng chân di động, đồng thời đảm bảo dừng lỗ, và tối đa hóa lợi nhuận.
Tóm tắt
Chiến lược tổng hợp xem xét nhiều khía cạnh như phán đoán xu hướng, kiểm soát rủi ro, tần suất giao dịch. Ưu điểm cốt lõi là chỉ số ngẫu nhiên kép kết hợp với xu hướng phán đoán chỉ số giao dịch, và cơ chế dừng lỗ kiểm soát rủi ro.
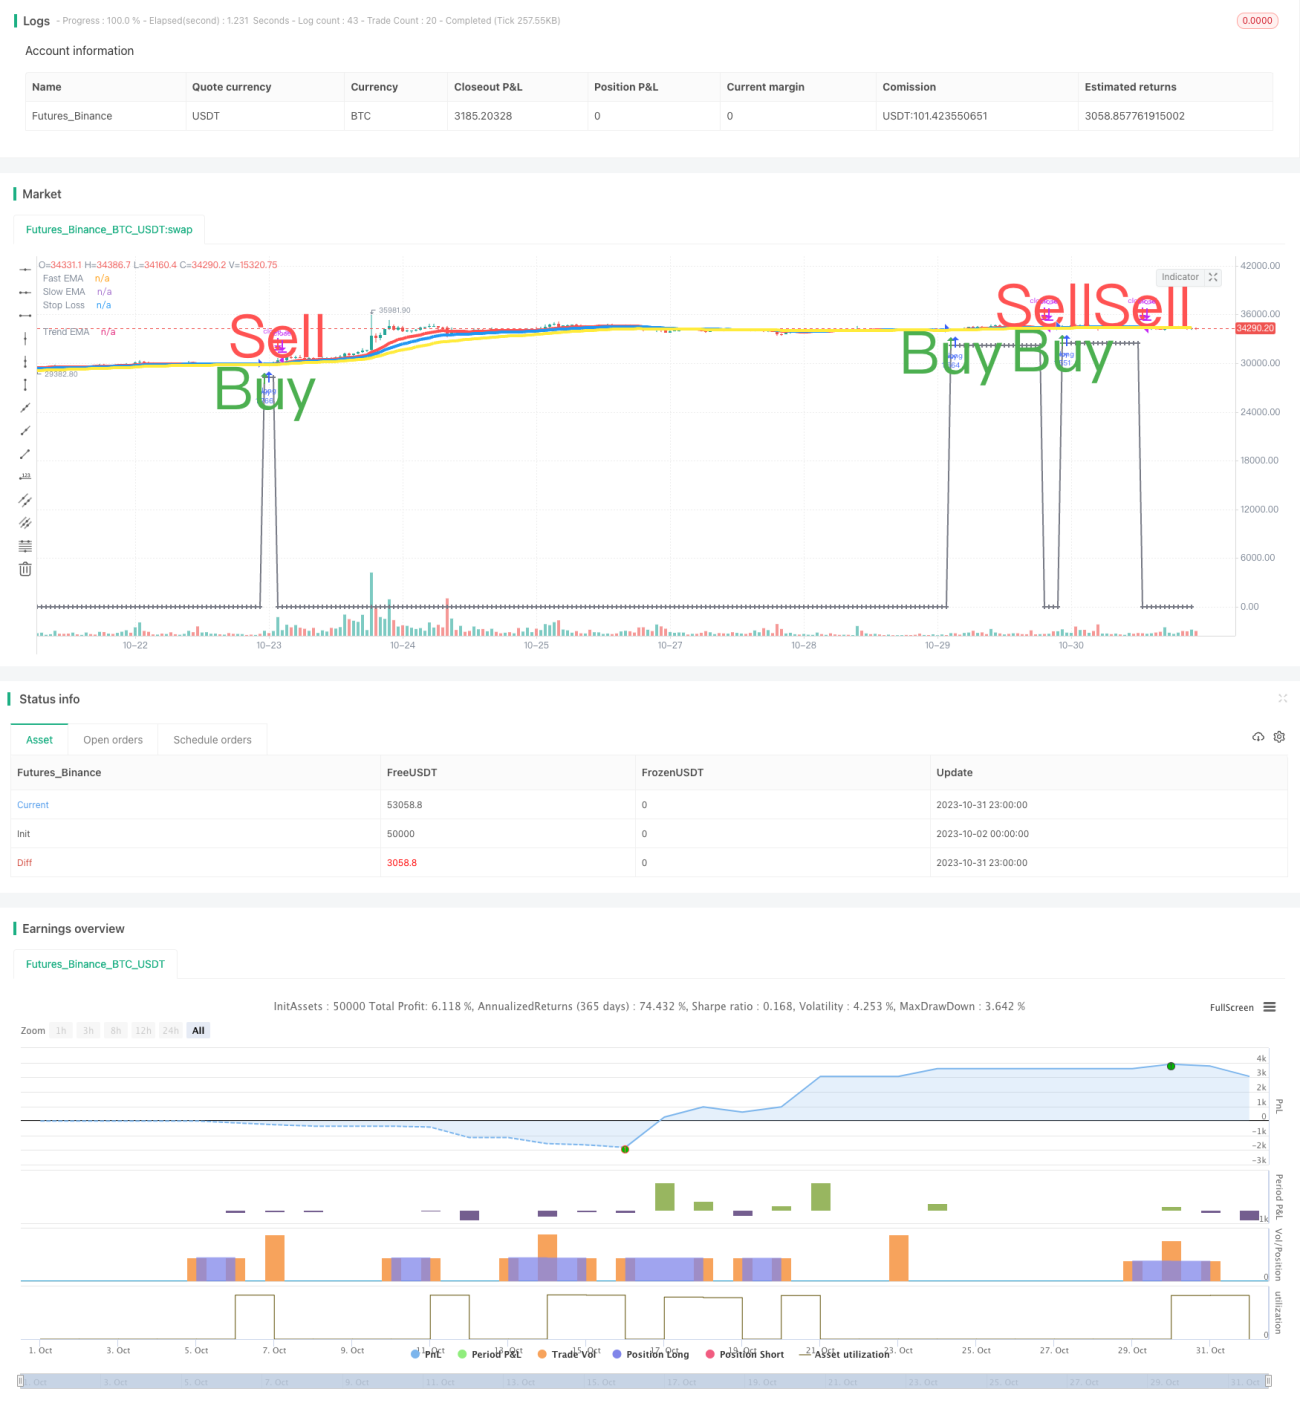
/*backtest
start: 2023-10-02 00:00:00
end: 2023-11-01 00:00:00
period: 1h
basePeriod: 15m
exchanges: [{"eid":"Futures_Binance","currency":"BTC_USDT"}]
*/

//@version=3
// SW SVE - Stochastic+Vol+EMAs [Sergio Waldoke]
// Script created by Sergio Waldoke (BETA VERSION v0.5, fine tuning PENDING)
// Stochastic process is the main source of signals, reinforced on buying by Volume. Also by Golden Cross.- 1