Chiến lược bắt ngược

Tổng quan
Chiến lược bắt ngược là một chiến lược giao dịch ngược sử dụng đường Brin của chỉ số biến động và kết hợp với RSI của chỉ số động lực. Nó đặt kênh Brin và đường mua quá bán của RSI làm tín hiệu để tìm kiếm cơ hội đảo ngược khi xu hướng thay đổi.
Nguyên tắc chiến lược
Chiến lược này sử dụng đường Brin như một chỉ số kỹ thuật chính, được hỗ trợ bởi các chỉ số động lực như RSI để xác minh tín hiệu giao dịch.
- Xác định xu hướng của chu kỳ lớn, xác định xem là bullish hay bearish. Sử dụng 50 ngày EMA và 21 ngày EMA để đánh giá.
- Trong xu hướng giảm, khi giá tăng vượt qua đường đi của Bollinger, và chỉ số RSI vừa bật lên từ vùng bán tháo, hình dạng Gold Fork xuất hiện, cho thấy vùng bán tháo đã được thiết lập, được coi là tín hiệu mua.
- Trong xu hướng tăng, khi giá giảm vượt qua đường đua của Bollinger, và chỉ số RSI vừa quay trở lại từ vùng quá mua, hình dạng ngã chết xuất hiện, cho thấy vùng quá mua đã bắt đầu quay trở lại, được coi là tín hiệu bán.
- Các tín hiệu mua và bán trên phải được đáp ứng đồng thời để tránh các tín hiệu giả.
Phân tích lợi thế
Chiến lược này có những ưu điểm sau:
- Kết hợp với chỉ số dao động và chỉ số động lượng, tín hiệu là đáng tin cậy hơn.
- Giao dịch đảo ngược có rủi ro thấp, phù hợp cho hoạt động ngắn hạn.
- Quy tắc lập trình rõ ràng, dễ dàng thực hiện giao dịch tự động.
- Giao dịch theo xu hướng để tránh bừa bãi trong thị trường biến động.
Phân tích rủi ro
Chiến lược này cũng có những rủi ro sau:
- Đường dẫn Brin có nguy cơ phá vỡ tín hiệu giả, cần lọc các chỉ số RSI.
- Những người dân ở đây thường có xu hướng bị ảnh hưởng bởi các tác động của các tác động của các tác nhân khác.
- Không biết chính xác thời điểm quay trở lại, có thể có nguy cơ nhập cảnh sớm hoặc bỏ lỡ vị trí tốt nhất.
Đối với các rủi ro trên, bạn có thể thiết lập vị trí dừng lỗ để kiểm soát lỗ hổng rủi ro, đồng thời tối ưu hóa các tham số, điều chỉnh chu kỳ đường braid hoặc tham số RSI.
Hướng tối ưu hóa
Chiến lược này có thể được tối ưu hóa theo các hướng sau:
- Tối ưu hóa các tham số của vùng Brin, điều chỉnh độ dài chu kỳ và kích thước chênh lệch tiêu chuẩn, tìm kiếm sự kết hợp tham số tối ưu.
- Tối ưu hóa chu kỳ trung bình di chuyển, xác định độ dài chu kỳ tốt nhất để đánh giá xu hướng.
- Điều chỉnh các tham số RSI để tìm ra phạm vi vùng bán tháo tốt nhất.
- Thêm kết hợp các chỉ số khác, như KDJ, MACD, v.v., làm phong phú lý do nhập cảnh hệ thống.
- Thêm các thuật toán học máy, sử dụng công nghệ AI để tự động tìm các tham số tốt nhất.
Tóm tắt
Chiến lược nắm bắt đảo ngược là một chiến lược giao dịch ngắn hạn có hiệu quả hơn. Nó kết hợp với phán đoán xu hướng và tín hiệu đảo ngược, có thể lọc các tín hiệu giả của thị trường biến động, có thể tránh được rủi ro trong thị trường xu hướng và xu hướng, có thể kiểm soát rủi ro. Bằng cách liên tục tối ưu hóa các tham số và mô hình, có thể có hiệu quả chiến lược tốt hơn.
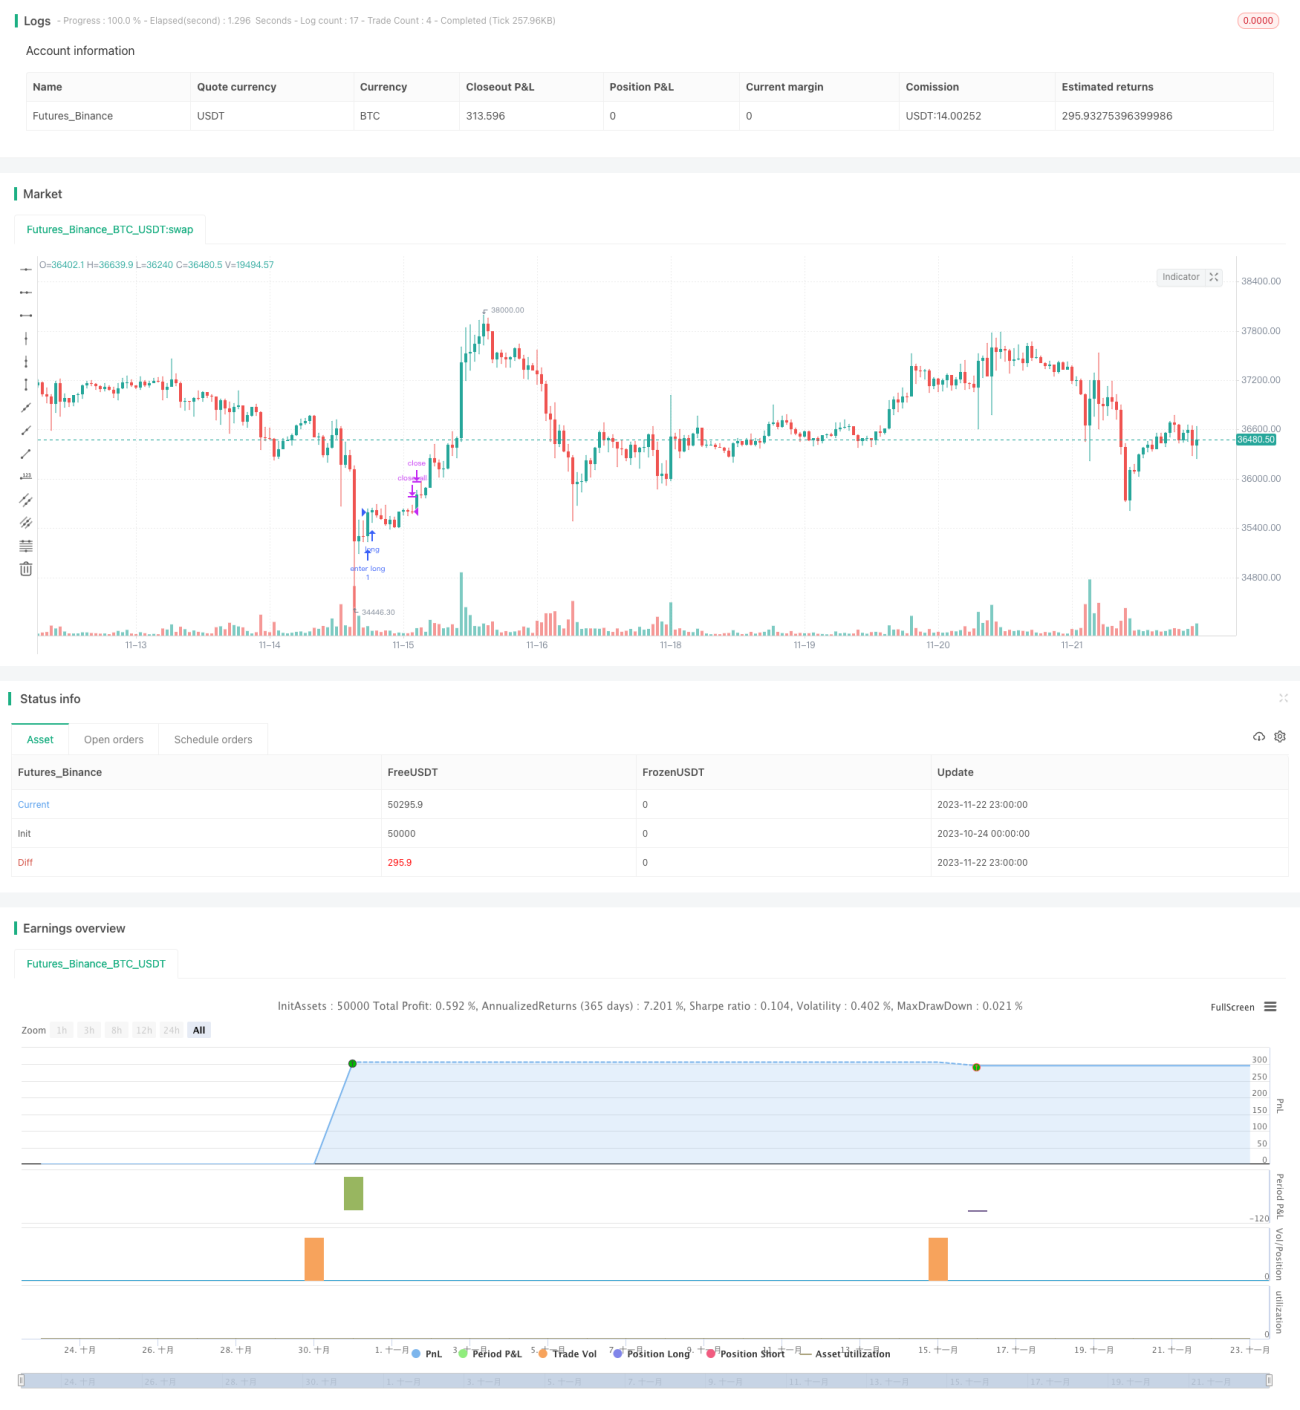
/*backtest
start: 2023-10-24 00:00:00
end: 2023-11-23 00:00:00
period: 1h
basePeriod: 15m
exchanges: [{"eid":"Futures_Binance","currency":"BTC_USDT"}]
*/

// This is an Open source work. Please do acknowledge in case you want to reuse whole or part of this code.
// Please see the documentation to know the details about this.

//@version=5- 1