Chiến lược theo dõi rủi ro thấp kim tự tháp điểm thấp
Chiến lược này có thể kiểm soát rủi ro hiệu quả bằng cách kết hợp các chỉ số khác nhau để xác định các điểm thấp tiềm năng trong chuyển động giá và theo dõi các vị trí theo từng bước bằng cách xây dựng vị trí bằng cách theo dõi kim tự tháp. Chiến lược này kết hợp các chức năng như dừng lỗ, dừng lỗ và dừng lỗ di chuyển.
Tổng quan về chiến lược
Chiến lược này sử dụng sự khác biệt giữa RSI và EMA RSI để xác định điểm thấp tiềm năng của giá. Để lọc các tín hiệu sai, chiến lược này cũng kết hợp các đường trung bình di chuyển và các chỉ số ngẫu nhiên của nhiều khung thời gian để xác nhận. Một khi tín hiệu thấp được xác nhận, nhiều lệnh sẽ được tạo ra dần dần ở vị trí thấp hơn điểm đó, đó là cách suy nghĩ của kim tự tháp theo dõi.
Nguyên tắc chiến lược
Chiến lược này bao gồm ba phần: mô-đun nhận diện điểm thấp, mô-đun theo dõi kim tự tháp và mô-đun kiểm soát rủi ro.
Mô-đun nhận dạng điểm thấpSử dụng sự khác biệt giữa chỉ số RSI và EMA của nó để xác định điểm thấp tiềm năng của giá. Để tăng độ chính xác, chỉ số trung bình di chuyển và chỉ số ngẫu nhiên nhiều khung thời gian cũng được đưa vào để lọc tín hiệu. Chỉ khi giá thấp hơn trung bình di chuyển và đường K ngẫu nhiên thấp hơn 30, hiệu lực của tín hiệu điểm thấp sẽ được xác nhận.
Mô-đun theo dõi kim tự thápLà cốt lõi của chiến lược này. Một khi tín hiệu thấp được xác nhận, chiến lược sẽ mở lệnh đầu tiên ở vị trí thấp hơn 0,1% so với mức thấp. Sau đó, nếu giá tiếp tục giảm và thấp hơn một tỷ lệ nhất định so với giá nhập trung bình, sẽ tiếp tục thêm nhiều lệnh. Số lượng lệnh mới sẽ tăng dần, ví dụ như số lượng lệnh thứ ba gấp 3 lần số lượng lệnh đầu tiên.
Mô-đun kiểm soát rủi roNó bao gồm ba khía cạnh chính. Thứ nhất là dừng toàn bộ, dựa trên mức dừng của giá cao nhất được tính toán trong một chu kỳ nhất định gần đây. Tất cả các lệnh sẽ dừng cùng một lúc với mức dừng này.
Lợi thế chiến lược
- Sử dụng theo dõi kim tự tháp để giảm rủi ro cho từng đơn đặt hàng, đồng thời phân tán rủi ro tổng thể
- Kết hợp nhiều chỉ số để tăng độ chính xác nhận diện điểm thấp
- Hạn chế toàn bộ, dừng và di động có thể kiểm soát rủi ro hiệu quả
- Cơ chế dừng lãi suất quyền lợi bảo vệ tài khoản khỏi tổn thất lớn
- Có thể tìm thấy điểm cân bằng giữa rủi ro và lợi nhuận bằng cách điều chỉnh tham số
Rủi ro chiến lược
- Độ chính xác nhận diện điểm thấp vẫn có một số giới hạn, có thể bỏ lỡ điểm nhập cảnh tốt nhất hoặc nhập tín hiệu sai
- Các đơn đặt hàng có thể gây bất lợi, làm tăng tổn thất
- Cần một chu kỳ hoạt động lâu hơn để thể hiện lợi thế của chiến lược
- Thiết lập tham số không chính xác có thể dẫn đến kiểm soát rủi ro kém
Để giảm thiểu các rủi ro trên, có thể tối ưu hóa các khía cạnh sau:
- Thay thế hoặc tăng các chỉ số để tăng độ chính xác của nhận diện điểm thấp
- Tối ưu hóa số lượng đơn đặt hàng, khoảng thời gian, và các tham số khác để giảm thiểu rủi ro của đơn đặt hàng
- Giảm mức dừng lỗ thích hợp, bảo vệ lợi nhuận
- Kiểm tra các giống khác nhau, chọn các giống có tính linh hoạt và biến động cao
Hướng tối ưu hóa chiến lược
Chiến lược này có thể được tối ưu hóa hơn nữa:
- Cố gắng nhận diện điểm yếu của công nghệ tiên tiến hơn như học máy
- Các tham số như số lượng đơn đặt hàng, mức dừng lỗ và các tham số khác được điều chỉnh theo các biến động của thị trường
- Thêm chiến lược dừng lỗ trong hộp để tránh sự gia tăng lỗ
- Tăng cơ chế tái nhập học
- Các tham số chiến lược để tối ưu hóa các loại cổ phiếu và tiền kỹ thuật số
Tóm tắt
Chiến lược này có hiệu quả trong việc giảm rủi ro cho một đơn đặt hàng thông qua cách theo dõi kim tự tháp, các chức năng như dừng toàn bộ, dừng và dừng di động cũng đóng vai trò kiểm soát rủi ro tốt. Tuy nhiên, vẫn còn không gian tối ưu hóa về nhận dạng điểm thấp, nếu có thể giới thiệu công nghệ tiên tiến hơn, thêm chức năng điều chỉnh động, sau đó kết hợp với tối ưu hóa tham số, tỷ lệ lợi nhuận rủi ro của chiến lược này sẽ được nâng cao đáng kể.
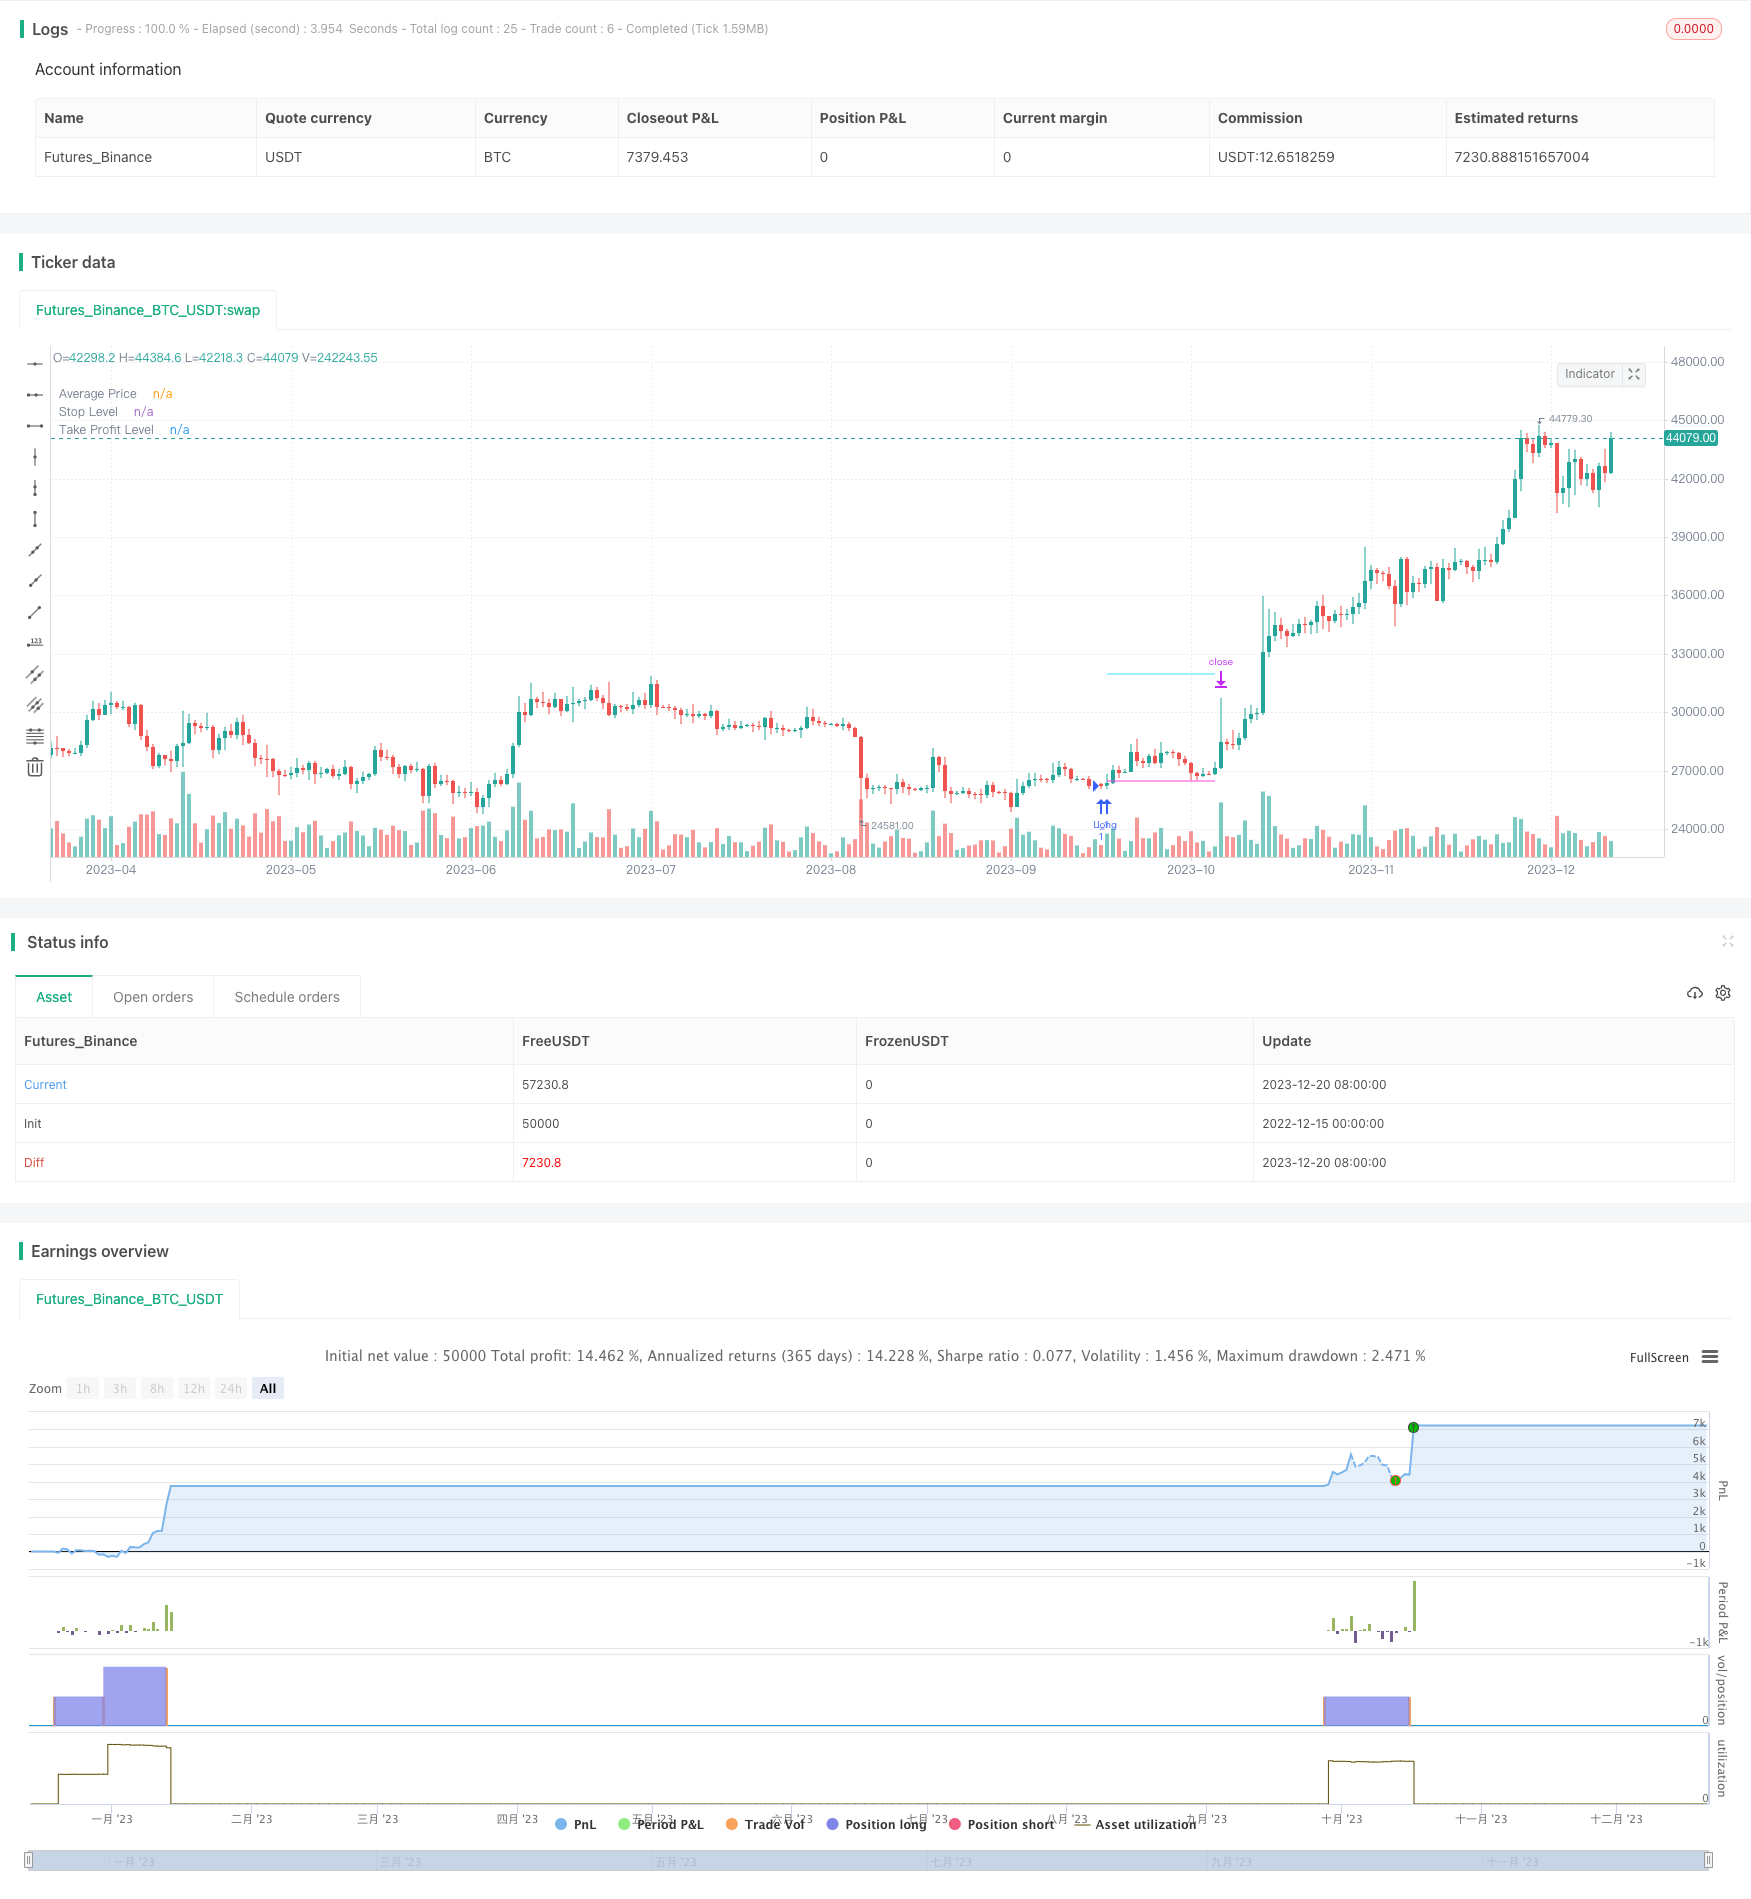
/*backtest
start: 2022-12-15 00:00:00
end: 2023-12-21 00:00:00
period: 1d
basePeriod: 1h
exchanges: [{"eid":"Futures_Binance","currency":"BTC_USDT"}]
*/

// This source code is subject to the terms of the Mozilla Public License 2.0 at https://mozilla.org/MPL/2.0/
// © A3Sh
//@version=5

// Strategy that finds potential lows in the price action and spreads the risk by entering multiple positions at these lows.
// The low is detected based on the difference between MTF RSI and EMA based RSI, Moving Average and MTF Stochastic indicators.
// The size of each next position that is entered is multiplied by the sequential number of the position.
// Each separate position can exit when a specified take profit is triggered and re-open when detecting a new potential low.
// All positions are closed when the price action crosses over the dynamic blue stop level line.

// This strategy combines open-source code developed by fellow Tradingview community members:
// The Lowfinder code is developed by RafaelZioni
// https://www.tradingview.com/script/GzKq2RVl-Low-finder/
// Both the MTF RSI code and the MTF Stochastic code are adapted from the MTFindicators libary written by Peter_O
// https://www.tradingview.com/script/UUVWSpXR-MTFindicators/

// The Stop Level calculation is inspired by the syminfo-mintick tutorial on Kodify.net
// https://kodify.net/tradingview/info/syminfo-mintick/

strategy("LowFinder_PyraMider",
         overlay=true, pyramiding=99,
         precision=2,
         initial_capital=10000,
         default_qty_type=strategy.percent_of_equity,
         default_qty_value=10,
         commission_type=strategy.commission.percent,
         commission_value=0.06,
         slippage=1
         )


// Backtest Window
start_time   = input(defval=timestamp("01 April 2021 20:00"), group = "Backtest Window", title="Start Time")
end_time     = input(defval=timestamp("01 Aug 2030 20:00"),   group = "Backtest Window", title="End Time")
window() => true


// Inputs
portfolio_size  = input.float  (100,         group = 'Risk - Portfolio',       title = 'Portfolio %', step=1.0) / 100
leverage        = input.int    (1,           group = 'Risk - Portfolio',       title = 'Leverage', minval = 1)
q_mode          = input.string ('multiply',  group = 'Risk - Order Size',      title = 'Order Size Mode', options = ['base', 'multiply'], tooltip = 'Base mode: the base quantiy for each sequential order. Multiply mode: each quantity is multiplied by order number')
q_mode_m        = input.int    (1,           group = 'Risk - Order Size',      title = 'Order Size Divider (Multiply Mode)',  tooltip = 'Divide Multiply by this number to lower the sequential order sizes')
fixed_q         = input.bool   (false,       group = 'Risk - Order Size',      title = 'Fixed Order Size',     inline = '01', tooltip = 'Use with caution! Overrides all Risk calculations')
amount_q        = input.float  (1,           group = 'Risk - Order Size',      title = '. . Base Currency:',   inline = '01')
sl_on           = input.bool   (false,       group = 'Risk - Stop Loss',       title = 'StopLoss of',          inline = '03')
stopLoss        = input.float  (1.5,         group = 'Risk - Stop Loss',       title = '',   step=0.1,         inline = '03') / 100
sl_mode         = input.string ('equity',    group = 'Risk - Stop Loss',       title = '% of',  options = ['avg_price', 'equity'], inline = '03')
stop_len        = input.int    (100,         group = 'Risk - Stop Level',      title = 'Stop Level Length', tooltip = 'Lookback most recent highest high')
stop_deviation  = input.float  (0.3,         group = 'Risk - Stop Level',      title = 'Deviatation % above Stop Level', step=0.1) / 100
cond2_toggle    = input.bool   (true ,       group = 'Risk - Take Profit',     title = 'Take Profit/Trailing Stop', inline = '04')
tp_all          = input.float  (1.0,         group = 'Risk - Take Profit',     title = '..........%', step=0.1,     inline = '04') / 100
tp_on           = input.bool   (true,        group = 'Risk - Take Profit',     title = 'Exit Crossover Take Profit and .....', inline = '02')
exit_mode       = input.string ('stoplevel', group = 'Risk - Take Profit',     title = '',   options = ['close', 'stoplevel'], inline = '02')
takeProfit      = input.float  (10.0,        group = 'Risk - Take Profit',     title = 'Take Profit % per Order', tooltip = 'Each separate order exits when hit', step=0.1)
posCount        = input.int    (12,          group = 'Pyramiding Settings',    title = 'Max Number of Orders')
next_entry      = input.float  (0.2,         group = 'Pyramiding Settings',    title = 'Next Order % below Avg. Price', step=0.1)
oa_lookback     = input.int    (0,           group = 'Pyramiding Settings',    title = 'Next Order after X candles', tooltip = 'Prevents opening too much orders in a Row')
len_rsi         = input.int    (5,           group = 'MTF LowFinder Settings', title = 'Lookback of RSI')
mtf_rsi         = input.int    (1,           group = 'MTF LowFinder Settings', title = 'Higher TimeFrame Multiplier RSI',  tooltip='Multiplies the current timeframe by specified value')
ma_length       = input.int    (26,          group = 'MTF LowFinder Settings', title = 'MA Length / Sensitivity')
new_entry       = input.float  (0.1,         group = 'MTF LowFinder Settings', title = 'First Order % below Low',step=0.1, tooltip = 'Open % lower then the found low')/100
ma_signal       = input.int    (100,         group = 'Moving Average Filter',  title = 'Moving Average Length')
periodK         = input.int    (14,          group = 'MTF Stochastic Filter',  title = 'K',      minval=1)
periodD         = input.int    (3,           group = 'MTF Stochastic Filter',  title = 'D',      minval=1)
smoothK         = input.int    (3,           group = 'MTF Stochastic Filter',  title = 'Smooth', minval=1)
lower           = input.int    (30,          group = 'MTF Stochastic Filter',  title = 'MTF Stoch Filter (above gets filtered)')
mtf_stoch       = input.int    (10,          group = 'MTF Stochastic Filter',  title = 'Higher TimeFrame Multiplier', tooltip='Multiplies the current timeframe by specified value')
avg_on          = input.bool   (true,        group = 'Plots',                  title = 'Plot Average Price')
plot_ma         = input.bool   (false,       group = 'Plots',                  title = 'Plot Moving Average')
plot_ts         = input.bool   (false,       group = 'Plots',                  title = 'Plot Trailing Stop Level')


// variables //
var entry_price     = 0.0    // The entry price of the first entry
var previous_entry  = 0.0    // Stores the price of the previous entry
var iq              = 0.0    // Inititial order quantity before risk calculation
var nq              = 0.0    // Updated new quantity after the loop
var oq              = 0.0    // Old quantity at the beginning or the loop
var q               = 0.0    // Final calculated quantity used as base order size
var int order_after = 0


// Order size calaculations //

// Order size based on max amount of pyramiding orders or fixed by user input ///
// Order size calculation based on 'base' mode or ' multiply' mode //
if fixed_q
    q := amount_q
else if q_mode == 'multiply'
    iq := (math.abs(strategy.equity * portfolio_size  / posCount) / open) * leverage
    oq := iq
    for i = 0 to posCount
        nq := oq + (iq * ( i/ q_mode_m + 1))
        oq := nq
    q := (iq  * posCount /  oq) * iq

else
    q := (math.abs(strategy.equity * portfolio_size  / posCount) / open) * leverage

// Function to calcaulate final order size based on order size modes and round the result with 1 decimal //
quantity_mode(index,string q_mode) =>
    q_mode == 'base' ? math.round(q,1) : q_mode == 'multiply' ? math.round(q * (index/q_mode_m  + 1),1) : na


// LowFinder Calculations //
// MTF RSI by Peter_O //
rsi_mtf(float source, simple int mtf,simple int len) =>
    change_mtf=source-source[mtf]
    up_mtf = ta.rma(math.max(change_mtf, 0), len*mtf)
    down_mtf = ta.rma(-math.min(change_mtf, 0), len*mtf)
    rsi_mtf = down_mtf == 0 ? 100 : up_mtf == 0 ? 0 : 100 - (100 / (1 + up_mtf / down_mtf))

// Lowfinder by RafaelZioni //
vrsi = rsi_mtf(close,mtf_rsi,len_rsi)

pp=ta.ema(vrsi,ma_length)
dd=(vrsi-pp)*5
cc=(vrsi+dd+pp)/2

lows=ta.crossover(cc,0)


// MTF Stoch Calcualation // MTF Stoch adapted from  Peter_O //
stoch_mtfK(source, mtf, len) =>

    k = ta.sma(ta.stoch(source, high, low, periodK * mtf), smoothK * mtf)

stoch_mtfD(source, mtf, len) =>

    k = ta.sma(ta.stoch(source, high, low, periodK * mtf), smoothK * mtf)
    d = ta.sma(k, periodD * mtf)

mtfK = stoch_mtfK(close, mtf_stoch, periodK)
mtfD = stoch_mtfD(close, mtf_stoch, periodK)


// Open next position % below average position price //
below_avg = close < (strategy.position_avg_price * (1 - (next_entry / 100)))


// Moving Average Filter //
moving_average_signal = ta.sma(close, ma_signal)
plot (plot_ma ? moving_average_signal : na, title = 'Moving Average', color = color.rgb(154, 255, 72))


// Buy Signal //
buy_signal = lows and close < moving_average_signal and mtfK < lower
// First Entry % Below lows //
if buy_signal
    entry_price := close * (1 - new_entry)


// Plot Average Price of Position//
plot (avg_on  ? strategy.position_avg_price : na, title = 'Average Price', style = plot.style_linebr, color = color.new(color.white,0), linewidth = 1)


// Take profit per Open Order //
take_profit_price = close * takeProfit / 100 / syminfo.mintick


// Calculate different Stop Level conditions to exit All //

// Stop Level Caculation //
stop_long1_level = ta.highest (high, stop_len)[1]  * (1 + stop_deviation)
stop_long2_level = ta.highest (high, stop_len)[2]  * (1 + stop_deviation)
stop_long3_level = ta.highest (high, stop_len)[3]  * (1 + stop_deviation)
stop_long4_level = ta.highest (high, stop_len)[1]  * (1 - 0.008)
// Stop triggers //
stop_long1 = ta.crossover(close,stop_long1_level)
stop_long2 = ta.crossover(close,stop_long2_level)
stop_long4 = ta.crossunder(close,stop_long4_level)
// Exit Conditions, cond 1 only Stop Level, cond2 Trailing Stop option //
exit_condition_1 = close < strategy.position_avg_price ? stop_long1 : close > strategy.position_avg_price ? stop_long2 : na
exit_condition_2 = close < strategy.position_avg_price * (1 + tp_all) ? stop_long2 :
                   close > strategy.position_avg_price * (1 + tp_all) ? stop_long4 :
                   close < strategy.position_avg_price ? stop_long1 : na
// Switch between conditions //
exit_conditions = cond2_toggle ? exit_condition_2 : exit_condition_1

// Exit when take profit //
ex_m = exit_mode == 'close' ? close : stop_long2_level
tp_exit = ta.crossover(ex_m, strategy.position_avg_price * (1 + tp_all)) and close > strategy.position_avg_price * 1.002

// Plot stoplevel, take profit level //
plot_stop_level    = strategy.position_size > 0 ? stop_long2_level : na
plot_trailing_stop = cond2_toggle and plot_ts and strategy.position_size > 0 and close > strategy.position_avg_price * (1 + tp_all) ? stop_long4_level : na

plot(plot_stop_level,    title = 'Stop Level',    style=plot.style_linebr, color = color.new(#41e3ff, 0), linewidth = 1)
plot(plot_trailing_stop, title = 'Trailing Stop', style=plot.style_linebr, color = color.new(#4cfca4, 0), linewidth = 1)

plot_tp_level = cond2_toggle and strategy.position_size > 0 ? strategy.position_avg_price * (1 + tp_all) : na
plot(plot_tp_level, title = 'Take Profit Level', style=plot.style_linebr, color = color.new(#ff41df, 0), linewidth = 1)


// Calculate Stop Loss based on equity and average price //
loss_equity = ((strategy.position_size * strategy.position_avg_price) - (strategy.equity * stopLoss)) / strategy.position_size
loss_avg_price = strategy.position_avg_price * (1 - stopLoss)
stop_loss = sl_mode == 'avg_price' ? loss_avg_price : loss_equity
plot(strategy.position_size > 0  and sl_on ? stop_loss : na, title = 'Stop Loss', color=color.new(color.red,0),style=plot.style_linebr, linewidth = 1)


// Enter first position //
if ta.crossunder(close,entry_price) and window() and strategy.position_size == 0
    strategy.entry('L_1', strategy.long, qty = math.round(q,1), comment = '+' + str.tostring(math.round(q,1)))
    previous_entry := close


// Enter next pyramiding positions //
if buy_signal and window() and strategy.position_size > 0 and below_avg
    order_after := order_after + 1
    for i = 1 to strategy.opentrades
        entry_comment = '+' + str.tostring((quantity_mode(i,q_mode))) // Comment with variable //
        if strategy.opentrades == i and i < posCount and order_after > oa_lookback
            entry_price := close
            entry_id = 'L_' + str.tostring(i + 1)
            strategy.entry(id = entry_id, direction=strategy.long, limit=entry_price, qty= quantity_mode(i,q_mode), comment = entry_comment)
            previous_entry := entry_price
            order_after := 0


// Exit per Position //
if strategy.opentrades > 0 and window()
    for i = 0 to strategy.opentrades
        exit_comment = '-' + str.tostring(strategy.opentrades.size(i))
        exit_from = 'L_' + str.tostring(i + 1)
        exit_id = 'Exit_' + str.tostring(i + 1)
        strategy.exit(id= exit_id, from_entry= exit_from, profit = take_profit_price, comment = exit_comment)


// Exit All //
if exit_conditions or (tp_exit and tp_on and cond2_toggle) and window()
    strategy.close_all('Exti All')
    entry_price := 0

if ta.crossunder(close,stop_loss)  and sl_on and window()
    strategy.close_all('StopLoss')
    entry_price := 0