Chiến lược giao dịch định lượng dựa trên phân tích chế độ thực nghiệm
Ngày tạo:
2023-12-22 14:41:34
sửa đổi lần cuối:
2023-12-22 14:41:34
sao chép:
0
Số nhấp chuột:
1021
1
tập trung vào
1751
Người theo dõi
Tổng quan
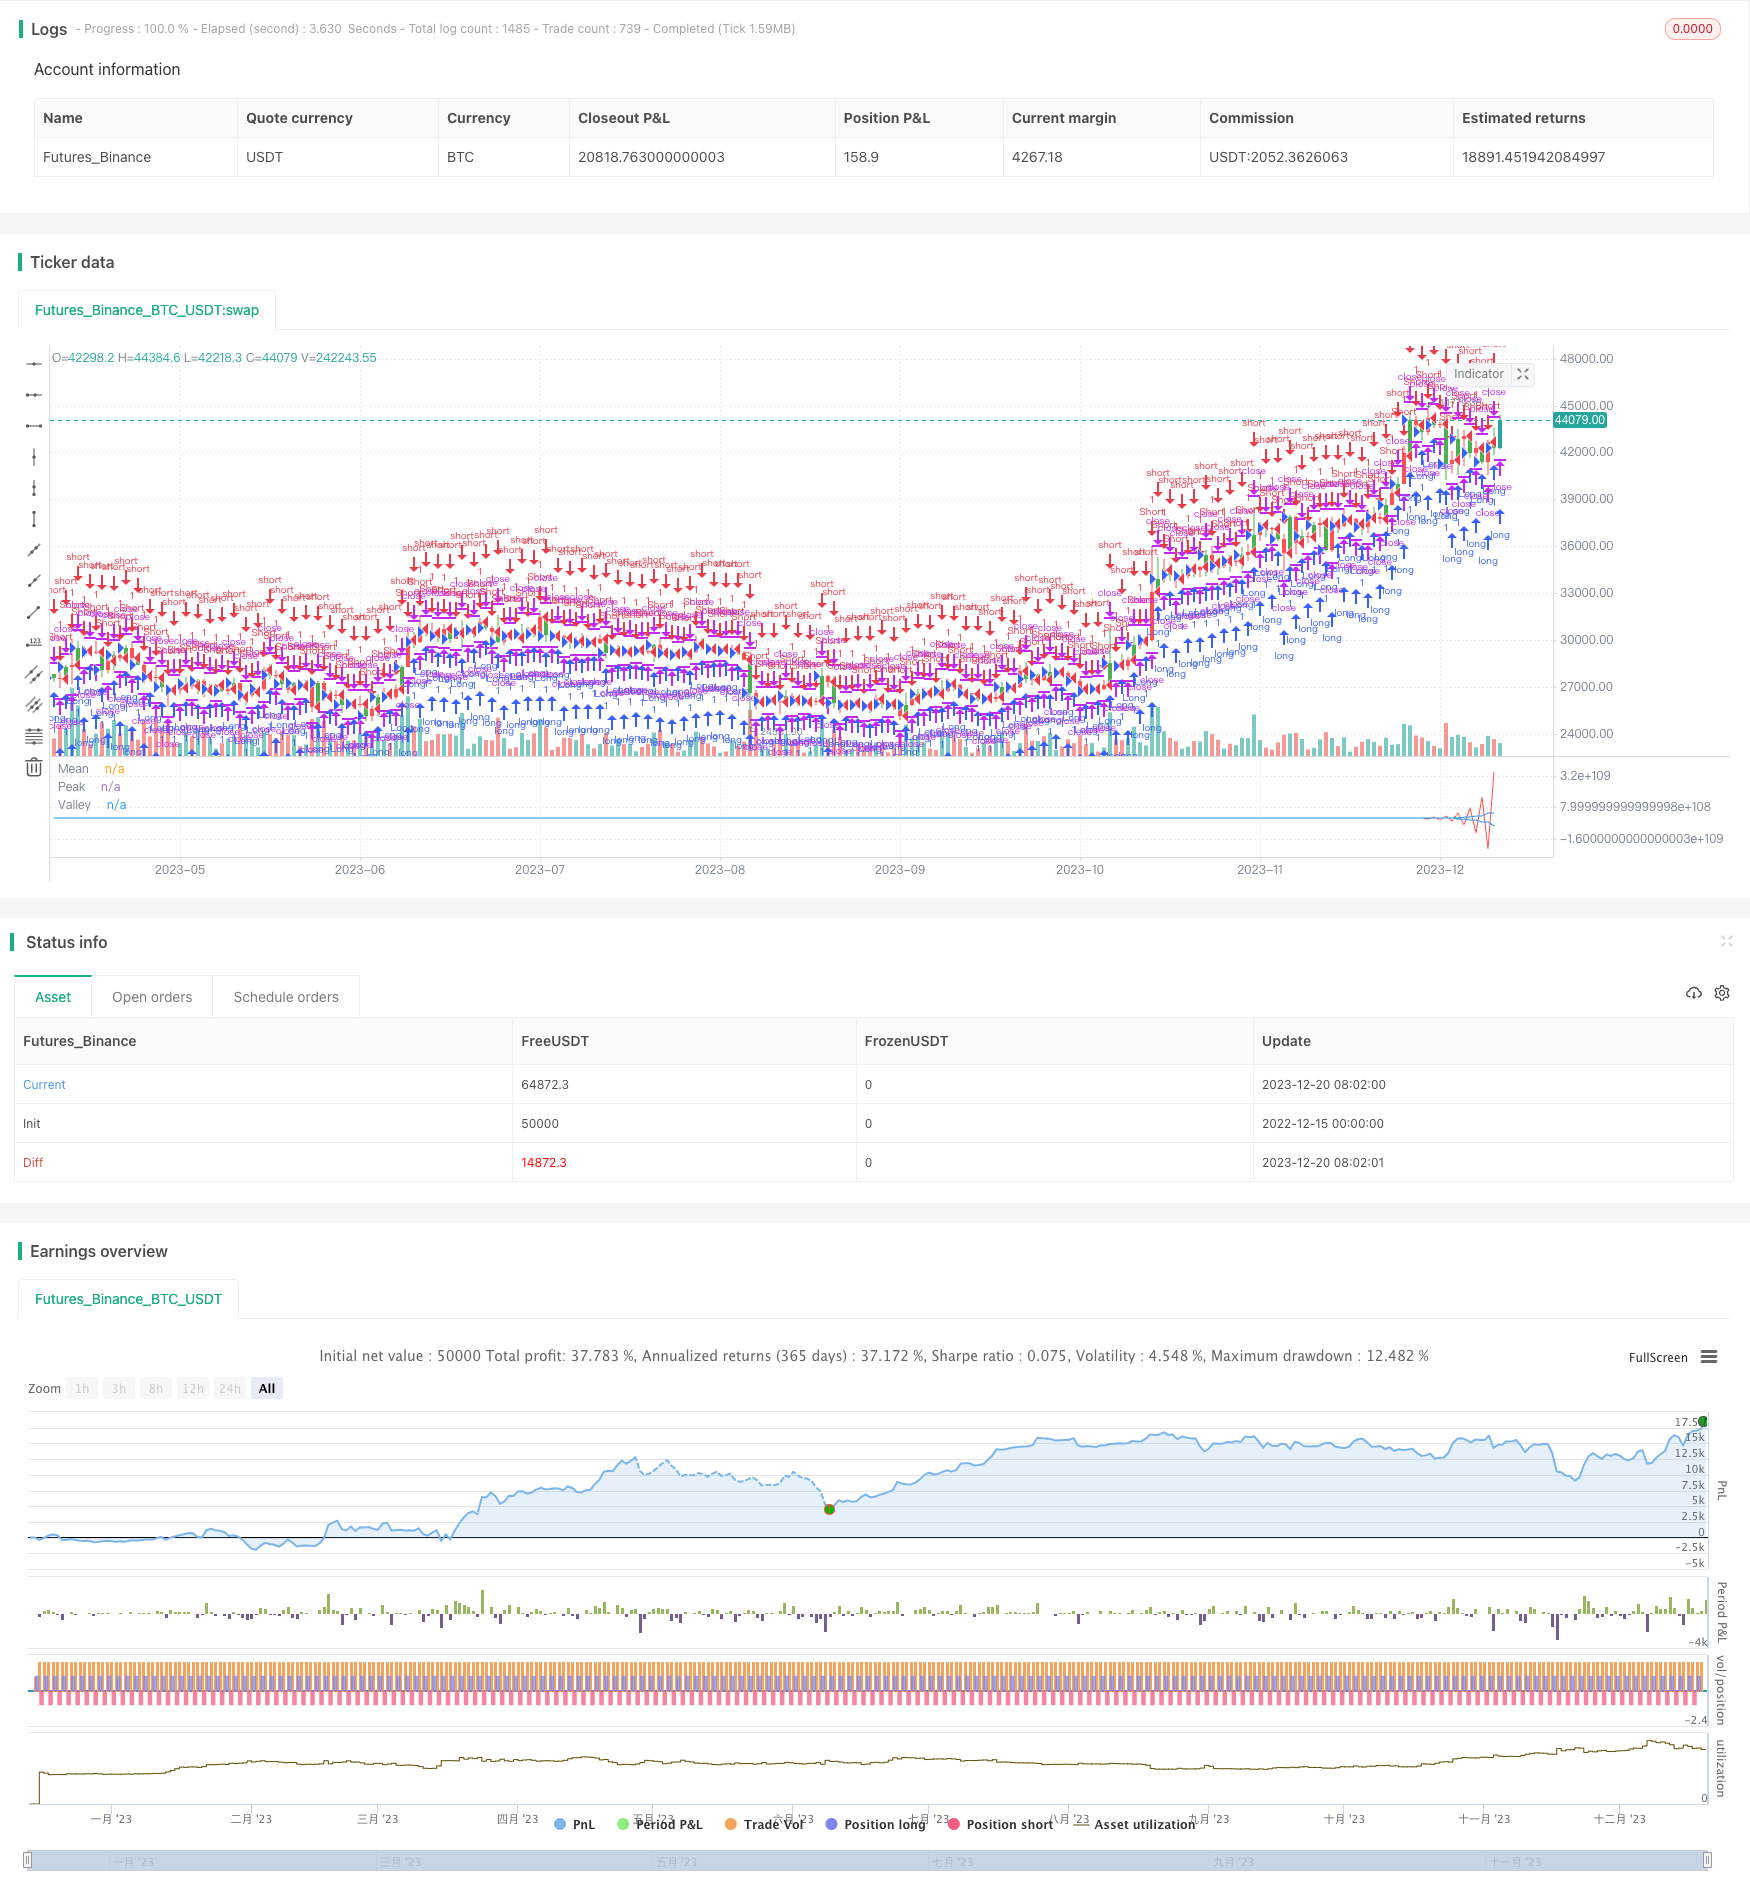
Chiến lược này dựa trên phương pháp Phân tích Chế độ Kinh nghiệm (Empirical Mode Decomposition, EMD), phân tích chuỗi giá, trích xuất các đặc điểm của các dải sóng khác nhau và tạo tín hiệu giao dịch kết hợp với giá trị trung bình. Chiến lược này chủ yếu áp dụng cho các vị trí đường dài và trung bình.
Nguyên tắc chiến lược
- Sử dụng phương pháp EMD để phân tích giá và trích xuất các đặc điểm dao động trong giá
- Tính trung bình di chuyển của chuỗi đỉnh và chuỗi đáy
- Tạo tín hiệu giao dịch khi đường trung bình vượt quá một tỷ lệ nhất định của đường đỉnh và đường thung lũng
- Làm nhiều đầu hoặc trống theo tín hiệu giao dịch
Phân tích lợi thế
- Sử dụng phương pháp EMD có thể phân tích chuỗi giá một cách hiệu quả để trích xuất các đặc điểm hữu ích
- Phong trào Peak Valley Line là một chiến lược chỉ giao dịch khi giá cả dao động lớn hơn một mức độ nhất định.
- Kết hợp với đường trung bình, có thể loại bỏ hiệu quả các đột phá giả
Phân tích rủi ro
- EMD phương pháp tham số được chọn không chính xác có thể dẫn đến quá phù hợp
- Cần một chu kỳ dài hơn để hình thành tín hiệu giao dịch, không thể thích nghi với giao dịch tần số cao
- Thị trường không thể đối phó với sự biến động mạnh mẽ của giá cả
Hướng tối ưu hóa
- Tối ưu hóa các tham số của mô hình EMD, cải thiện khả năng thích ứng với thị trường
- Kết hợp với các chỉ số khác làm tín hiệu dừng lỗ
- Thử các chuỗi giá khác nhau như đầu vào chiến lược
Tóm tắt
Chiến lược này sử dụng phương pháp phân tích mô-đun kinh nghiệm để chiết xuất đặc điểm của chuỗi giá và tạo tín hiệu giao dịch dựa trên các đặc điểm được chiết xuất, để thực hiện một chiến lược giao dịch đường dài trung bình ổn định. Ưu điểm của chiến lược này là có thể xác định hiệu quả các đặc điểm định kỳ trong giá và đưa ra chỉ thị giao dịch trong biến động lớn.
Mã nguồn chiến lược
/*backtest
start: 2022-12-15 00:00:00
end: 2023-12-21 00:00:00
period: 1d
basePeriod: 1h
exchanges: [{"eid":"Futures_Binance","currency":"BTC_USDT"}]
*/

//@version=2
////////////////////////////////////////////////////////////
//  Copyright by HPotter v1.0 12/04/2017
// The related article is copyrighted material from Stocks & Commodities Mar 2010
// You can use in the xPrice any series: Open, High, Low, Close, HL2, HLC3, OHLC4 and ect...
//
// You can change long to short in the Input Settings
// Please, use it only for learning or paper trading. Do not for real trading.
////////////////////////////////////////////////////////////
strategy(title="Empirical Mode Decomposition")
Length = input(20, minval=1)
Delta = input(0.5)
Fraction = input(0.1)
reverse = input(false, title="Trade reverse")
xPrice = hl2
beta = cos(3.1415 * (360 / Length) / 180)
gamma = 1 / cos(3.1415 * (720 * Delta / Length) / 180)
alpha = gamma - sqrt(gamma * gamma - 1)
xBandpassFilter = 0.5 * (1 - alpha) * (xPrice - xPrice[2]) + beta * (1 + alpha) * nz(xBandpassFilter[1]) - alpha * nz(xBandpassFilter[2])
xMean = sma(xBandpassFilter, 2 * Length)
xPeak =  iff (xBandpassFilter[1] > xBandpassFilter and xBandpassFilter[1] > xBandpassFilter[2], xBandpassFilter[1], nz(xPeak[1]))
xValley =  iff (xBandpassFilter[1] < xBandpassFilter and xBandpassFilter[1] < xBandpassFilter[2], xBandpassFilter[1], nz(xValley[1]))
xAvrPeak = sma(xPeak, 50)
xAvrValley = sma(xValley, 50)
nAvrPeak = Fraction * xAvrPeak
nAvrValley = Fraction * xAvrValley
pos = iff(xMean > nAvrPeak and xMean > nAvrValley, 1,
	     iff(xMean < nAvrPeak and xMean < nAvrValley, -1, nz(pos[1], 0)))
possig = iff(reverse and pos == 1, -1,
          iff(reverse and pos == -1, 1, pos))
if (possig == 1)
    strategy.entry("Long", strategy.long)
if (possig == -1)
    strategy.entry("Short", strategy.short)
barcolor(possig == -1 ? red: possig == 1 ? green : blue )
plot(xMean, color=red, title="Mean")
plot(nAvrPeak, color=blue, title="Peak")
plot(nAvrValley, color=blue, title="Valley")