Chiến lược dài hạn và ngắn hạn của Ichimoku Kinko Hyo
Tổng quan
Chiến lược này được cải tiến trên cơ sở hệ thống giao dịch cân bằng đầu tiên. Ý tưởng chính là kết hợp các chỉ số cân bằng đầu tiên của lý thuyết đường thẳng và các quy tắc quản lý tiền để xác định các cơ hội giao dịch ngắn và đa đầu.
Nguyên tắc chiến lược
Chiến lược sử dụng hệ thống cân bằng một mắt cổ điển như một tham chiếu cơ bản. Các thành phần chính bao gồm:
Đường chuyển hướng: Đường trung bình. Phản ánh xu hướng trung bình
Dòng chuẩn: Dòng dài.
Đường tiên phong: Đường dự đoán tương lai.
Dòng trễ: Dòng quá khứ. Phản ánh xu hướng quá khứ.
Trên cơ sở đó, chiến lược đã được cải tiến như sau:
Chọn tham số thời gian theo lý thuyết số lẻ vuông, làm cho nó phù hợp hơn với luật thị trường.
Tăng các quy tắc quản lý tiền, bao gồm dừng lỗ, dừng, kích thước vị trí, v.v., để kiểm soát rủi ro giao dịch.
Có thể điều chỉnh phạm vi phản hồi để kiểm tra chiến lược toàn diện hơn.
Cụ thể, điều kiện nhập cảnh đa đầu bao gồm việc chuyển đổi đường trên đường viền, đường chậm trễ cao hơn giá, giá cao hơn biểu đồ đám mây, biểu đồ đám mây dự đoán thị trường bò trong tương lai. Điều kiện nhập cảnh đầu không yêu cầu chuyển đổi đường dưới đường viền, đường chậm trễ thấp hơn giá.
Các quy tắc quản lý tài chính yêu cầu nhiều đầu dừng là 30% và dừng là 5%; dừng khi lỗ hổng đầu trống vượt quá ATR 3 lần đường xoay.
Phân tích lợi thế
Các lợi thế của chiến lược kết hợp chỉ số đường trung bình và quản lý tài chính được thể hiện chủ yếu trong:
Hệ thống cân bằng một mắt tự nó phản ánh xu hướng ngắn hạn, trung hạn và dài hạn, entry/exit là hợp lý.
Các tham số tối ưu hóa của lý thuyết số lẻ vuông, phù hợp với quy luật thống kê thị trường.
Các quy tắc quản lý tài sản có hiệu quả trong việc kiểm soát lỗ hổng đơn lẻ và đảm bảo lợi nhuận lớn hơn lỗ hổng.
Phạm vi phản hồi có thể điều chỉnh, kiểm tra toàn diện hơn ROUND
Tóm lại, chiến lược này có tính thực tiễn mạnh mẽ, có thể xác định hiệu quả các cơ hội ngắn và nhiều, kiểm soát rủi ro giao dịch, và có tính thực tiễn toàn diện trong việc xem xét các yếu tố như xu hướng, lựa chọn tham số và kiểm soát rủi ro.
Phân tích rủi ro
Những rủi ro chính trong chiến lược này là:
Hệ thống cân bằng một mắt dễ bị lừa bởi đột phá giả, gây ra sự nhập cảnh không cần thiết. Có thể kết hợp với nhiều tín hiệu lọc chỉ số hơn.
Quy tắc dừng lỗ cố định dễ bị lật, có thể giới thiệu dừng lỗ động.
Dữ liệu phản hồi không đầy đủ, có thể đánh giá quá cao hiệu quả của chiến lược.
Chiến lược này phù hợp hơn với thị trường đang có xu hướng, thị trường có thể không hoạt động tốt. Các điều kiện nhập cảnh có thể được tối ưu hóa để nhận ra xu hướng.
Hướng tối ưu hóa
Chiến lược này có thể được tối ưu hóa từ các khía cạnh sau:
Thêm bộ lọc các chỉ số, nâng cao chất lượng nhập học. Các chỉ số phán đoán hỗ trợ như MACD, KDJ.
Động lực dừng dừng. Ví dụ: phá vỡ đường trung bình N lần ATR để dừng, giảm giá trị hỗ trợ dừng.
Xác minh phản hồi nhiều giống. Xác minh sự ổn định của chiến lược trên nhiều thị trường và dữ liệu lâu hơn.
Phân biệt xu hướng và tổng hợp thị trường. Tối ưu hóa cơ chế nhập cảnh để thích ứng với các tình huống khác nhau.
Tóm tắt
Chiến lược này tính đến nhiều yếu tố như xu hướng, quản lý tài chính, sử dụng chỉ số cân bằng đầu tiên để xác định các cơ hội giao dịch đa chiều ngắn; đồng thời sử dụng các quy tắc kiểm soát rủi ro để kiểm soát tổn thất đơn. Có nhiều cải tiến so với hệ thống cân bằng đầu tiên ban đầu. Bằng cách tối ưu hóa hơn nữa, chiến lược này có khả năng trở thành một chiến lược ngắn hạn và đa phương pháp rất thực tế.
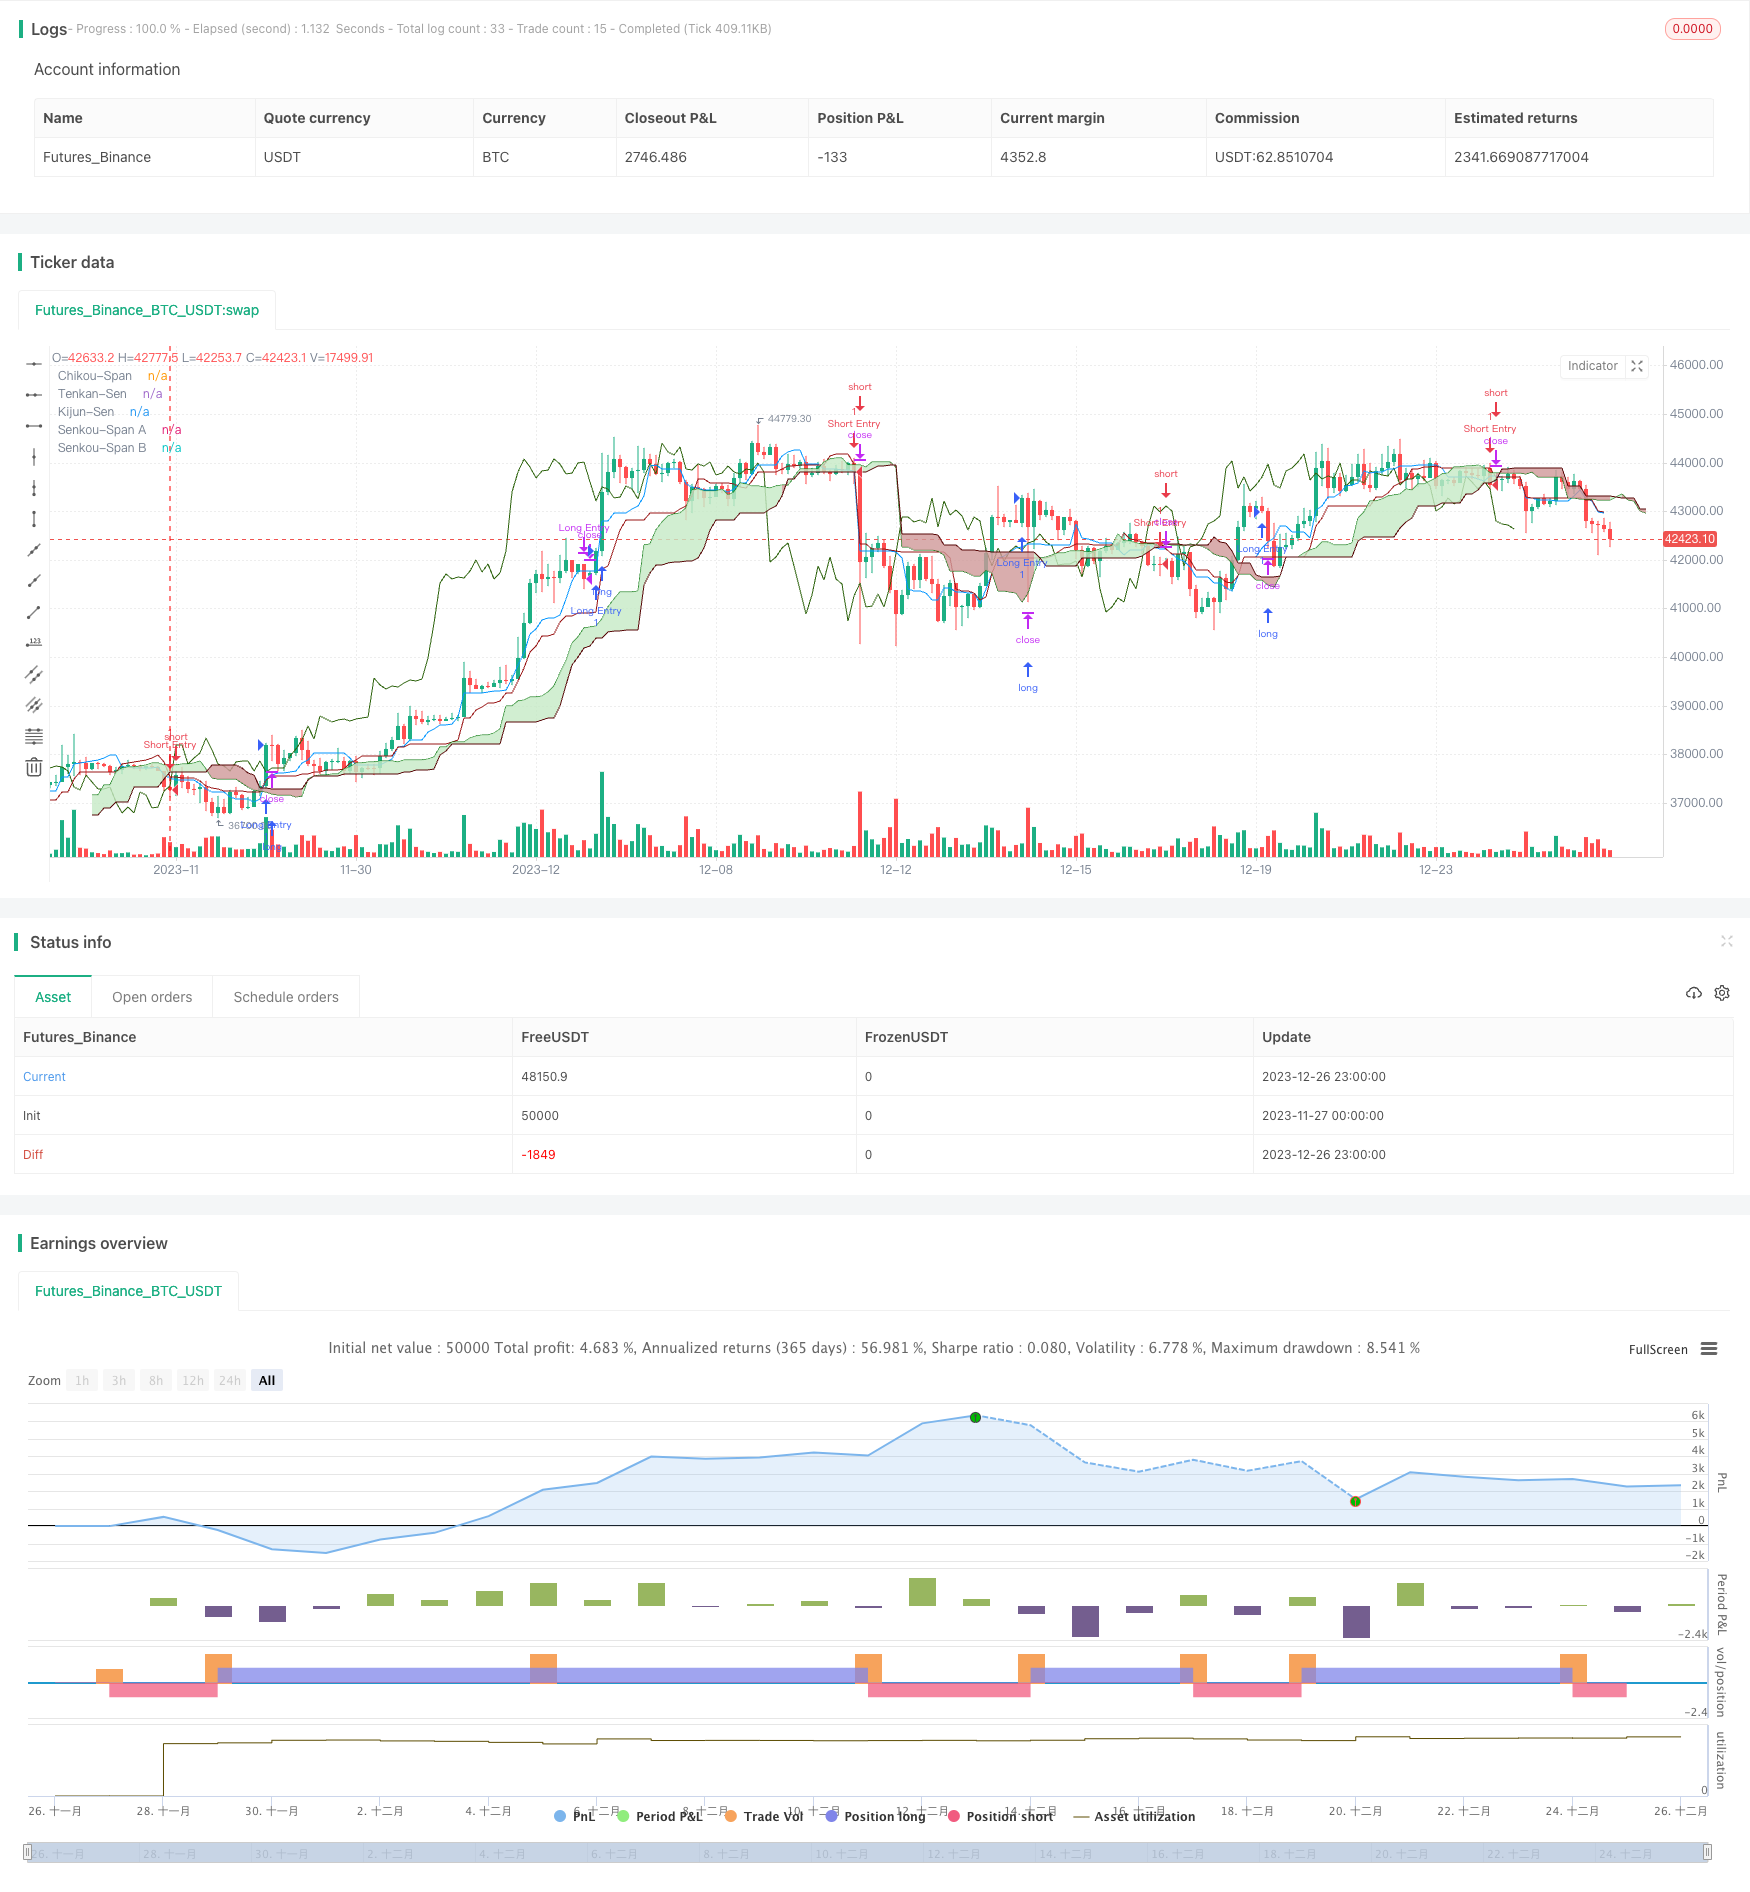
/*backtest
start: 2023-11-27 00:00:00
end: 2023-12-27 00:00:00
period: 3h
basePeriod: 15m
exchanges: [{"eid":"Futures_Binance","currency":"BTC_USDT"}]
*/

// Author Obarut
//@version=5
strategy("İchimoku Strategy With MM Short-Long",overlay=true,process_orders_on_close=true)

//Ichimoku Inputs
ts_period = input.int(8, minval=1, title="Tenkan-Sen Period")
ks_period = input.int(16, minval=1, title="Kijun-Sen Period")
ssb_period = input.int(24, minval=1, title="Senkou-Span B Period")
cs_offset = input.int(16, minval=1, title="Chikou-Span Offset")
ss_offset = input.int(8, minval=1, title="Senkou-Span Offset")
long_entry = input(true, title="Long Entry")
short_entry = input(true, title="Short Entry")

// Back Testing Period Inputs

fromday = input.int(defval=1,title="Start Date",minval=1,maxval=31)
frommonth = input.int(defval=1,title="Start Month",minval=1,maxval=12)
fromyear = input.int(defval=1980,title="Start Year",minval=1800, maxval=2100)
today = input.int(defval=1,title="En Date",minval=1,maxval=31)
tomonth = input.int(defval=1,title="End Month",minval=1,maxval=12)
toyear =input.int(defval=2100,title="End Year",minval=1800,maxval=2200)
start=timestamp(fromyear,frommonth,fromday,00,00)
finish=timestamp(toyear,tomonth,today,00,00)
timewindow= time>=start and time<=finish

//Ichimoku Componenets Calculation Function
middle(len) => math.avg(ta.lowest(len), ta.highest(len))

// Ichimoku Components

tenkan = middle(ts_period)
kijun = middle(ks_period)
senkouA = math.avg(tenkan, kijun)
senkouB = middle(ssb_period)
//Senkou Span Lines slopes
slopetenkan=(tenkan-tenkan[2])/tenkan
slopekijun= (kijun-kijun[2])/kijun
//Avarage True Range
atr = ta.atr(14)
//Senkou Span Lines
ss_above = math.max(senkouA[ss_offset-1], senkouB[ss_offset-1])
ss_below = math.min(senkouA[ss_offset-1], senkouB[ss_offset-1])

// Price Distance From Tenkan
distance = close - tenkan

// Price Distance from Kijun
distancek = close - kijun

// Entry/Exit Signals

tk_cross_kijun_bull = tenkan >= kijun//Tenkan Sen is greater than or equal to  Kijun Sen
tk_cross_kijun_bear = tenkan <= kijun//Tenkan Sen is smaller than or equal to Kijun Sen
cs_cross_bull = close > high[cs_offset-1]//Chikou is above the price
cs_cross_bear = close < close[cs_offset-1]//Chikou is below the price
price_above_kumo = close > ss_above//Price is above the Kumo cloud
pbsenkA = close < ss_above // Price is below the Senkou Span which is higher
pasenkB = close > ss_below// Price is above the Senkou span which is lower
price_below_kumo = close < ss_below // Price is below Kumo cloud
future_kumo_bull = senkouA > senkouB and (ta.roc(senkouA,3)>0) and (ta.roc(senkouB,3)>=0) // Future Kumo cloud is bullish
pbtenkan=close<tenkan
tkbelowkij=tenkan<kijun
future_kumo_bear = senkouA < senkouB//Future Kumo cloud is bearish
// Price Distance From Tenken
disbull = distance < 2*atr
//Price Distance From Kijun
disbullk = distancek < 3*atr
//Price Above Tenkan Condition
patk = close > tenkan
// Kijun Above Senkou Span Condition
kjasenkA = kijun > ss_above
// Price Below Kijun Condition
pbkijun = close < kijun
//Consolidation Tenkan and Kijun are inside Kumo cloud
kijuninsidekumo= kijun<ss_above and kijun>ss_below
tenkaninsidekumo= tenkan<ss_above and tenkan>ss_below
consolidation=kijuninsidekumo and tenkaninsidekumo

//Bullish Entry Condition

bullish= tk_cross_kijun_bull and cs_cross_bull and price_above_kumo and future_kumo_bull and disbull and patk
     and not consolidation
//Bullish exit
bearish=tk_cross_kijun_bear and pbsenkA and cs_cross_bear  and future_kumo_bear
      or price_below_kumo
// Bearish Entry Condition

bearish2=tk_cross_kijun_bear and pbtenkan and tkbelowkij and tkbelowkij and cs_cross_bear and future_kumo_bear

if(bullish and timewindow and long_entry )
    strategy.entry("Long Entry", strategy.long)


if(bearish2 and timewindow and short_entry)
    strategy.entry("Short Entry",strategy.short)
// Bearish Condition


lastentryprice = strategy.opentrades.entry_price(strategy.opentrades - 1)

// Take Profit or Stop Loss in Bearish

exit1= (close-tenkan)>3*atr and slopetenkan<=0
exit2= (close-lastentryprice)>5*atr and close<(tenkan-0.04*atr)

if(bearish and timewindow and not short_entry or exit1 or exit2  or (close>1.30*lastentryprice  ) or (close< 0.95*lastentryprice))
    strategy.close("Long Entry")
if(bullish and timewindow and not long_entry)
    strategy.close("Short Entry")
if(time>finish)
    strategy.close_all("time up")

plot(tenkan, color=#0496ff, title="Tenkan-Sen")
plot(kijun, color=#991515, title="Kijun-Sen")
plot(close, offset=-cs_offset+1, color=#2e640e, title="Chikou-Span")
sa=plot(senkouA, offset=ss_offset-1, color=color.rgb(17, 122, 21), title="Senkou-Span A")
sb=plot(senkouB, offset=ss_offset-1, color=color.rgb(88, 8, 8), title="Senkou-Span B")
fill(sa, sb, color = senkouA > senkouB ? color.rgb(198, 234, 198) : color.rgb(208, 153, 153), title="Cloud color")