Chiến lược tối ưu hóa giao thoa đa thời gian trung bình động
Ngày tạo:
2024-01-05 12:05:42
sửa đổi lần cuối:
2024-01-05 12:05:42
sao chép:
2
Số nhấp chuột:
898
1
tập trung vào
1750
Người theo dõi
Tổng quan
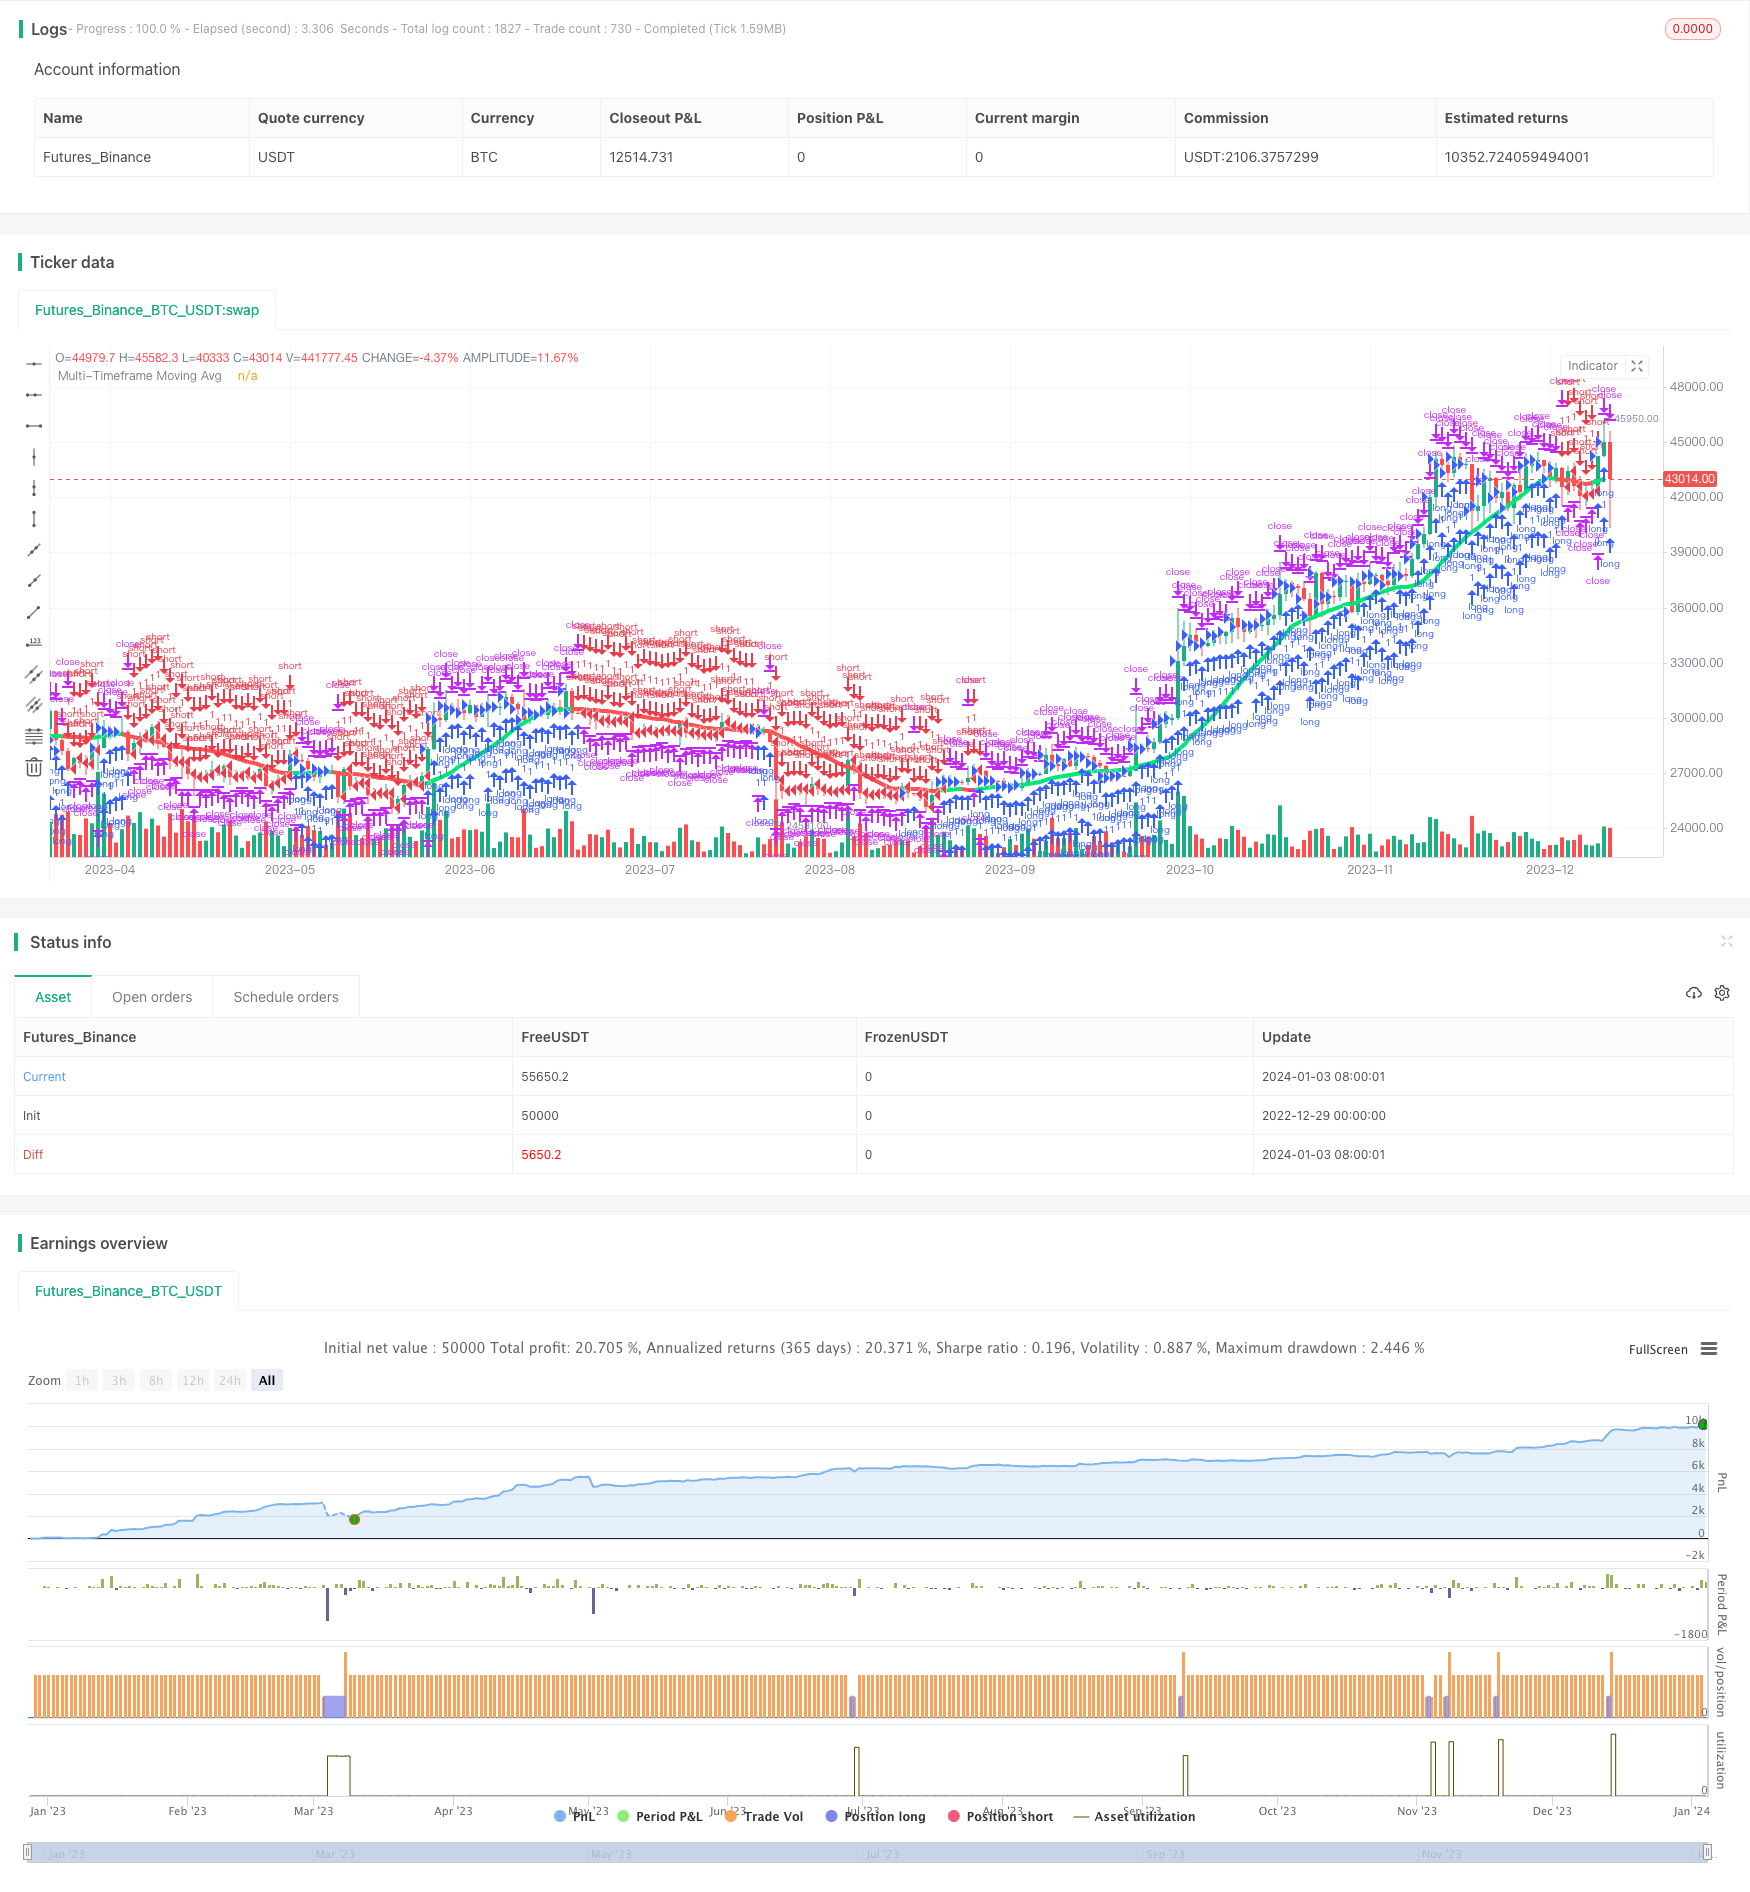
Chiến lược này được viết lại dựa trên chỉ số nổi tiếng CM_Ultimate_MA_MTF, có thể vẽ trung bình di chuyển trên nhiều thang thời gian, cho phép hoạt động chéo của MA trong các giai đoạn thời gian khác nhau. Chiến lược cũng có chức năng theo dõi dừng lỗ.
Nguyên tắc chiến lược
- Đường MA được vẽ theo các loại chỉ số MA khác nhau, tùy theo tùy chọn của người dùng, trong chu kỳ đồ thị chính và chu kỳ cao hơn.
- Khi đường MA có chu kỳ nhanh đi qua đường MA có chu kỳ chậm, hãy làm nhiều; khi đường MA có chu kỳ nhanh đi qua đường MA có chu kỳ chậm, hãy làm trống.
- Thêm một hệ thống tracking stop loss để kiểm soát rủi ro hơn nữa.
Phân tích lợi thế
- MA đa quy mô thời gian giao nhau, có thể cải thiện chất lượng tín hiệu và giảm tín hiệu giả.
- Sự kết hợp của các loại MA khác nhau có thể sử dụng các lợi thế của chỉ số riêng của họ để tăng sự ổn định.
- Theo dõi dừng lỗ sẽ giúp dừng lỗ kịp thời và giảm khả năng thua lỗ lớn.
Phân tích rủi ro
- Chỉ số MA bị tụt hậu, có thể bỏ lỡ cơ hội hoạt động ngắn.
- Cần tối ưu hóa đúng các tham số chu kỳ MA, nếu không có thể tạo ra quá nhiều tín hiệu giả.
- Thiết lập điểm dừng không hợp lý có thể gây ra tổn thất không cần thiết.
Hướng tối ưu hóa
- Bạn có thể thử nghiệm các kết hợp MA của các tham số khác nhau để tìm tham số tốt nhất.
- Có thể thêm các bộ lọc cho các chỉ số khác để cải thiện chất lượng tín hiệu.
- Có thể tối ưu hóa chiến lược dừng lỗ để phù hợp hơn với đặc điểm của thị trường.
Tóm tắt
Chiến lược này tích hợp phân tích nhiều khung thời gian của trung bình di chuyển và theo dõi phương pháp dừng để cải thiện chất lượng tín hiệu và kiểm soát mức độ rủi ro. Hiệu quả của chiến lược có thể được tăng cường hơn nữa bằng cách tối ưu hóa tham số và thêm các chỉ số khác.
Mã nguồn chiến lược
/*backtest
start: 2022-12-29 00:00:00
end: 2024-01-04 00:00:00
period: 1d
basePeriod: 1h
exchanges: [{"eid":"Futures_Binance","currency":"BTC_USDT"}]
*/

//@version=2

strategy(title = "Ultimate Moving Average Strategy", shorttitle = "UMA Strategy", overlay = true)

//Created by user ChrisMoody 4-24-2014
//Converted to strategy by Virtual_Machinist 7-11-2018
//Plots The Majority of Moving Averages
//Defaults to Current Chart Time Frame --- But Can Be Changed to Higher Or Lower Time Frames
//2nd MA Capability with Show Crosses Feature

//inputs
src = close
useCurrentRes = input(true, title="Use Current Chart Resolution?")
resCustom = input(title="Use Different Timeframe? Uncheck Box Above",  defval="D")
len = input(20, title="Moving Average Length - LookBack Period")
atype = input(1,minval=1,maxval=7,title="1=SMA, 2=EMA, 3=WMA, 4=HullMA, 5=VWMA, 6=RMA, 7=TEMA")
cc = input(true,title="Change Color Based On Direction?")
smoothe = input(2, minval=1, maxval=10, title="Color Smoothing - 1 = No Smoothing")
doma2 = input(false, title="Optional 2nd Moving Average")
len2 = input(50, title="Moving Average Length - Optional 2nd MA")
atype2 = input(1,minval=1,maxval=7,title="1=SMA, 2=EMA, 3=WMA, 4=HullMA, 5=VWMA, 6=RMA, 7=TEMA")
cc2 = input(true,title="Change Color Based On Direction 2nd MA?")
warn = input(false, title="***You Can Turn On The Show Dots Parameter Below Without Plotting 2nd MA to See Crosses***")
warn2 = input(false, title="***If Using Cross Feature W/O Plotting 2ndMA - Make Sure 2ndMA Parameters are Set Correctly***")
sd = input(false, title="Show Dots on Cross of Both MA's")

useStop     = input(defval = true, title = "Use Trailing Stop?")
slPoints    = input(defval = 200, title = "Stop Loss Trail Points", minval = 1)
slOffset    = input(defval = 400, title = "Stop Loss Trail Offset", minval = 1)

res = useCurrentRes ? timeframe.period : resCustom
//hull ma definition
hullma = wma(2*wma(src, len/2)-wma(src, len), round(sqrt(len)))
//TEMA definition
ema1 = ema(src, len)
ema2 = ema(ema1, len)
ema3 = ema(ema2, len)
tema = 3 * (ema1 - ema2) + ema3

avg = atype == 1 ? sma(src,len) : atype == 2 ? ema(src,len) : atype == 3 ? wma(src,len) : atype == 4 ? hullma : atype == 5 ? vwma(src, len) : atype == 6 ? rma(src,len) : tema
//2nd Ma - hull ma definition
hullma2 = wma(2*wma(src, len2/2)-wma(src, len2), round(sqrt(len2)))
//2nd MA TEMA definition
sema1 = ema(src, len2)
sema2 = ema(sema1, len2)
sema3 = ema(sema2, len2)
stema = 3 * (sema1 - sema2) + sema3

avg2 = atype2 == 1 ? sma(src,len2) : atype2 == 2 ? ema(src,len2) : atype2 == 3 ? wma(src,len2) : atype2 == 4 ? hullma2 : atype2 == 5 ? vwma(src, len2) : atype2 == 6 ? rma(src,len2) : tema

out = avg
out_two = avg2

out1 = request.security(syminfo.tickerid, res, out)
out2 = request.security(syminfo.tickerid, res, out_two)

ma_up = out1 >= out1[smoothe]
ma_down = out1 < out1[smoothe]

col = cc ? ma_up ? lime : ma_down ? red : aqua : aqua
col2 = cc2 ? ma_up ? lime : ma_down ? red : aqua : aqua

circleYPosition = out2

plot(out1, title="Multi-Timeframe Moving Avg", style=line, linewidth=4, color = col)
plot(doma2 and out2 ? out2 : na, title="2nd Multi-TimeFrame Moving Average", style=circles, linewidth=4, color=col2)
plot(sd and cross(out1, out2) ? circleYPosition : na,style=cross, linewidth=5, color=yellow)

// Strategy conditions

longCond    = ma_up
shortCond   = ma_down
// entries and base exit
strategy.entry("long", strategy.long, when = longCond)
strategy.entry("short", strategy.short, when = shortCond)

if (useStop)
    strategy.exit("XL", from_entry = "long", trail_points = slPoints, trail_offset = slOffset)
    strategy.exit("XS", from_entry = "short", trail_points = slPoints, trail_offset = slOffset)
// not sure needed, but just incase..
strategy.exit("XL", from_entry = "long", when = shortCond)
strategy.exit("XS", from_entry = "short", when = longCond)