Chiến lược giao cắt RSI ngẫu nhiên Triple EMA
Tổng quan
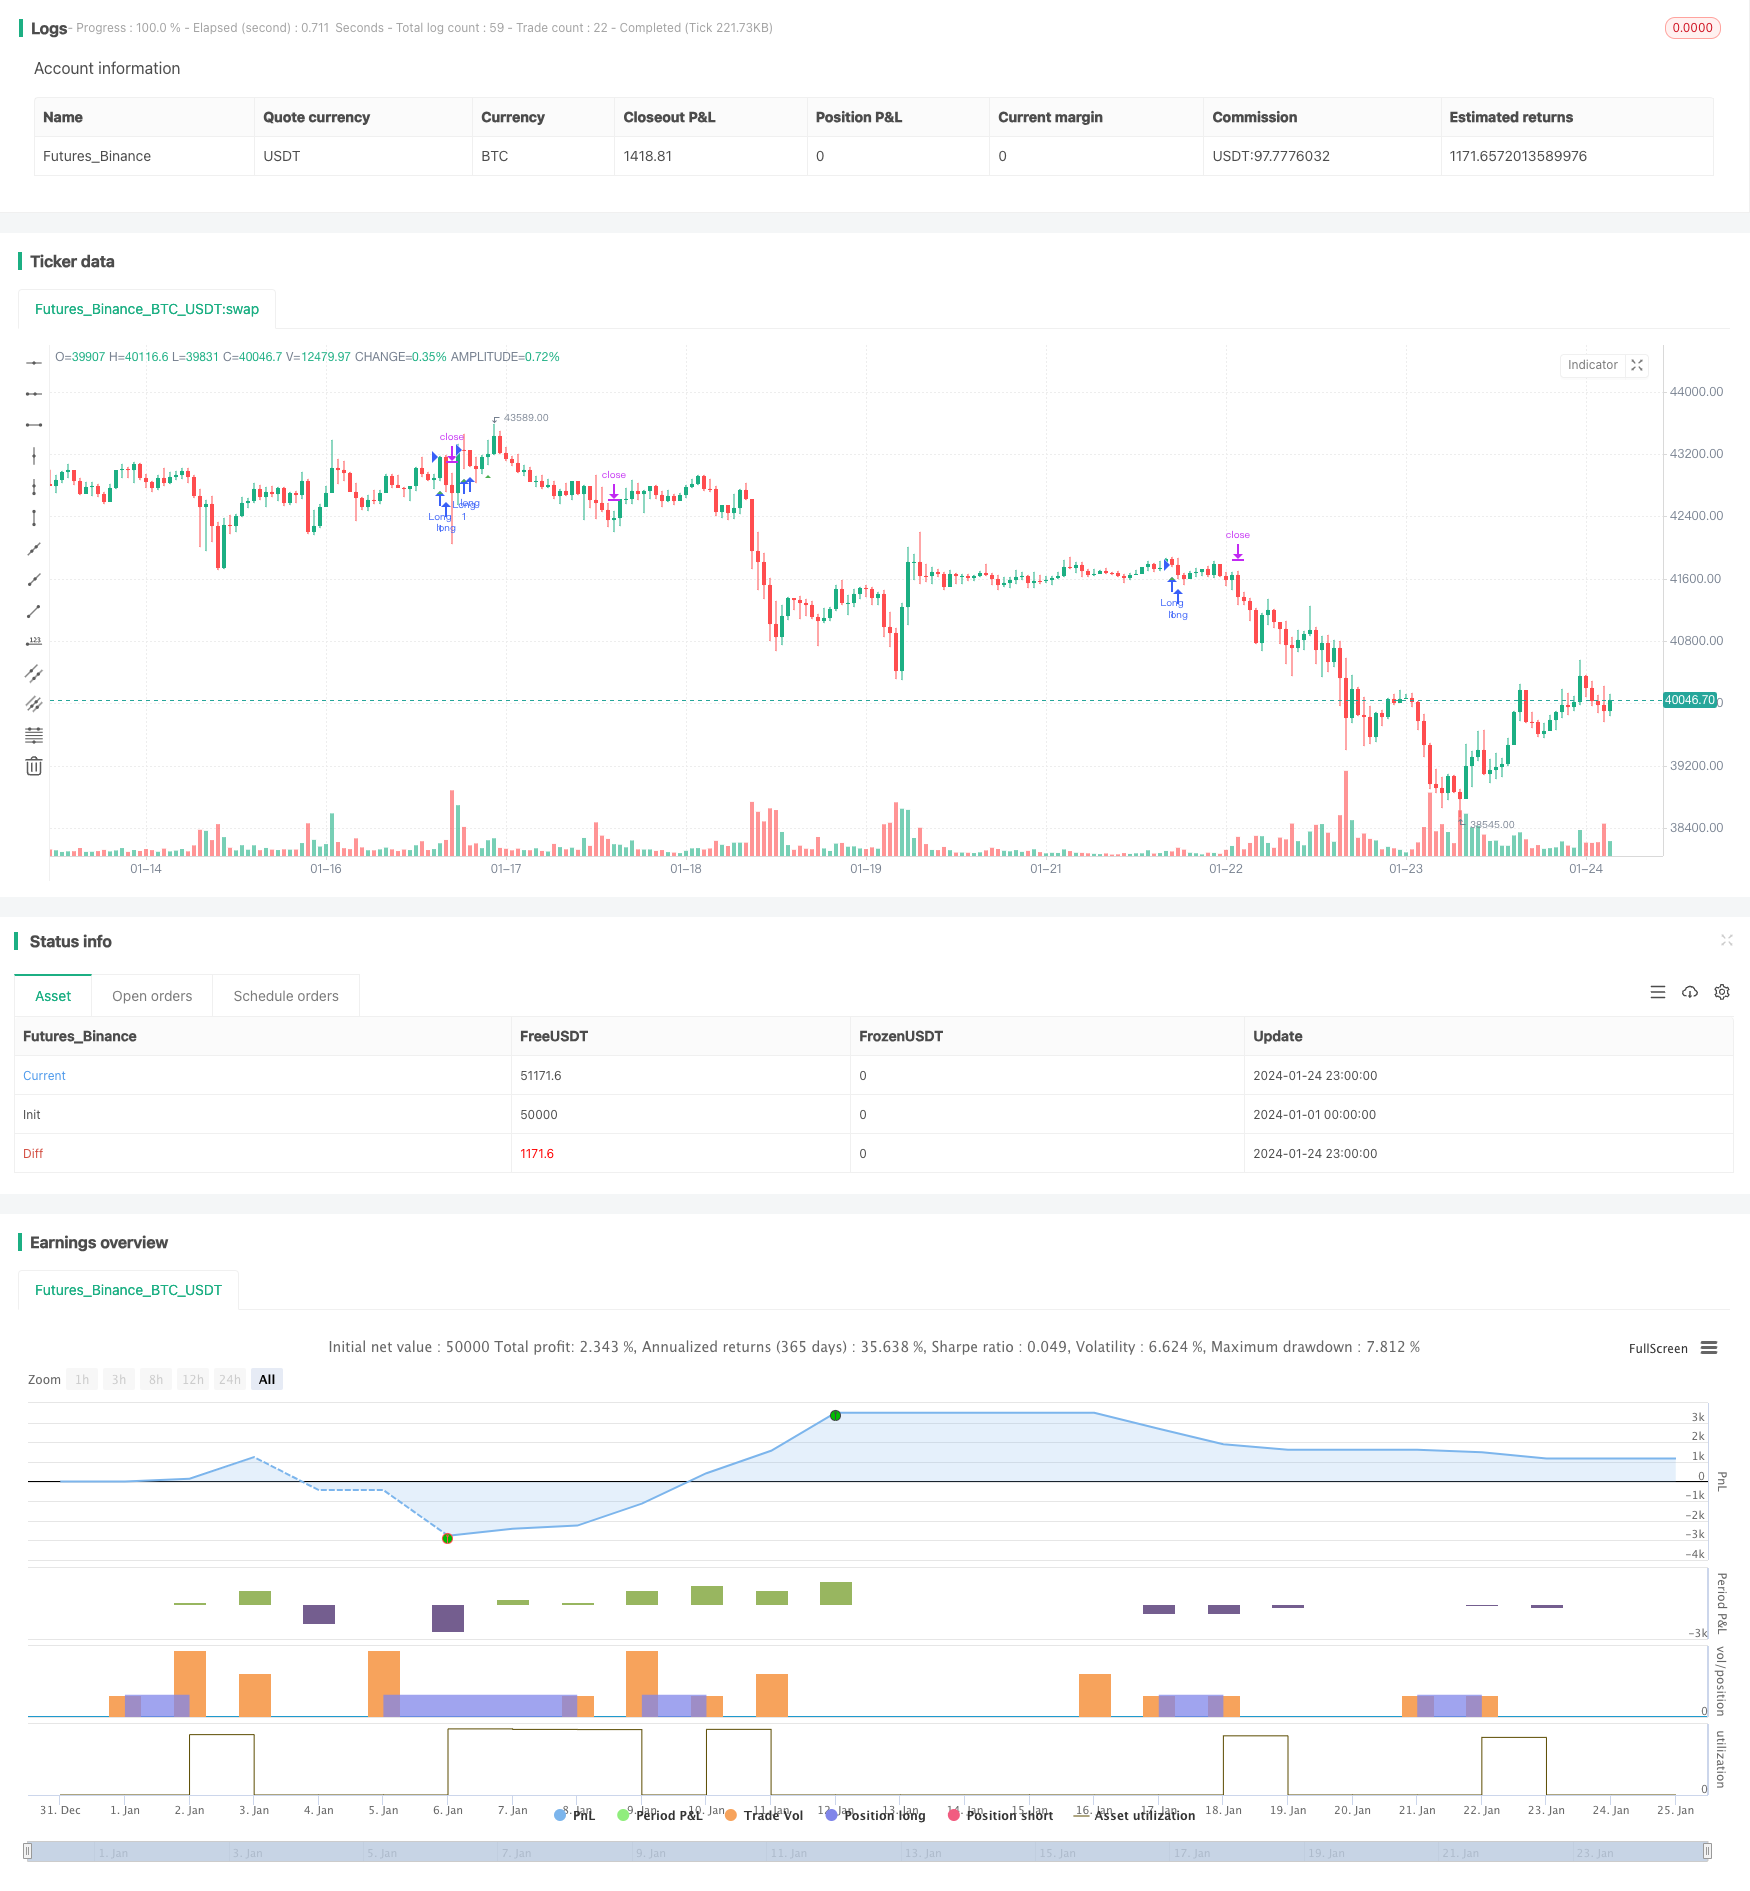
Chiến lược ba EMA RSI ngẫu nhiên là một chiến lược theo dõi xu hướng. Nó kết hợp các chỉ số chuyển động trung bình ba chỉ số và các chỉ số ngẫu nhiên tương đối mạnh mẽ để đánh giá thời gian vào thị trường thông qua tín hiệu chéo của các chỉ số kép.
Nguyên tắc chiến lược
Chiến lược này dựa trên logic sau:
Ba EMA đánh giá xu hướng: 8 ngày đường trên, 14 ngày đường ở giữa, 50 ngày đường dưới tạo thành xu hướng đa đầu, ngược lại tạo thành xu hướng không đầu.
Chỉ số RSI ngẫu nhiên đánh giá chéo: Đường K đi qua đường D từ phía dưới để tạo ra tín hiệu gai vàng, cho thấy sức mạnh đi vào.
Tôi không nghĩ đến chuyện đó.
Khi EMA ba xuất hiện xu hướng đi lên và RSI ngẫu nhiên xuất hiện, hãy làm nhiều hơn. Dựa trên đó, thiết lập các đường dừng và dừng để khóa lợi nhuận.
Phân tích lợi thế
Chiến lược này kết hợp với sự phán đoán của hai chỉ số, có thể khóa xu hướng một cách hiệu quả. Những ưu điểm chính như sau:
Ba EMA sẽ lọc ra những tiếng ồn ngắn hạn và khóa các xu hướng đường dài.
RSI Goldfork xác nhận mạnh vào.
ATR thông minh dừng lỗ, khóa lợi nhuận.
Lập luận chiến lược đơn giản, rõ ràng, dễ hiểu và dễ thực hiện.
Phân tích rủi ro
Những rủi ro chính của chiến lược này là:
Khi EMA ba lần tạo ra nhiều đà chết vàng trong cơn chấn động, việc mở kho thường xuyên sẽ tạo ra rủi ro giao dịch. Có thể giải quyết bằng cách tối ưu hóa tham số EMA hoặc thêm các chỉ số lọc khác.
Không có cơ hội giảm giá. Chỉ cần làm nhiều hơn sẽ bỏ lỡ cơ hội hồi phục dưới cùng.
Hướng tối ưu hóa
Chiến lược này có thể được tối ưu hóa như sau:
Tối ưu hóa các tham số EMA, cải thiện phán đoán xu hướng.
Tăng các chỉ số như MACD, đánh giá xu hướng không đầu, tăng cơ hội làm空.
Tăng chỉ số biến động, như ATR, cải thiện thiết lập Stop Loss Stop.
Kết hợp với chỉ số khối lượng giao dịch, tránh phá vỡ giả.
Sử dụng các công nghệ như học máy để tối ưu hóa tham số.
Tóm tắt
Nhìn chung, chiến lược chéo RSI ngẫu nhiên EMA ba kết hợp với phán đoán hai chỉ số có thể lọc hiệu quả các biến động, khóa xu hướng, là một chiến lược theo dõi xu hướng đơn giản và thực tế. Bằng cách tiếp tục tối ưu hóa các tham số, tăng các chỉ số lọc và sử dụng các công nghệ tiên tiến, chiến lược có thể đạt được hiệu suất tốt hơn.
/*backtest
start: 2024-01-01 00:00:00
end: 2024-01-25 00:00:00
period: 1h
basePeriod: 15m
exchanges: [{"eid":"Futures_Binance","currency":"BTC_USDT"}]
*/

//@version=4

strategy(title="Stoch RSI Crossover Strat + EMA", shorttitle="Stoch RSI Cross + EMA Strat", overlay = true)

// Time Range
FromMonth=input(defval=1,title="FromMonth",minval=1,maxval=12)
FromDay=input(defval=1,title="FromDay",minval=1,maxval=31)
FromYear=input(defval=2020,title="FromYear",minval=2017)
ToMonth=input(defval=1,title="ToMonth",minval=1,maxval=12)
ToDay=input(defval=1,title="ToDay",minval=1,maxval=31)
ToYear=input(defval=9999,title="ToYear",minval=2017)
start=timestamp(FromYear,FromMonth,FromDay,00,00)
finish=timestamp(ToYear,ToMonth,ToDay,23,59)
window()=>true

// See if this bar's time happened on/after start date
afterStartDate = time >= start and time<=finish?true:false

//STOCH RSI
smoothK = input(3, minval=1)
smoothD = input(3, minval=1)
lengthRSI = input(14, minval=1)
lengthStoch = input(14, minval=1)
src = input(close, title="RSI Source")

rsi1 = rsi(src, lengthRSI)
k = sma(stoch(rsi1, rsi1, rsi1, lengthStoch), smoothK)
d = sma(k, smoothD)

//ATR
lengthATR = input(title="ATR Length", defval=14, minval=1)
atr = atr(lengthATR)

//MULTI EMA
emasrc = close,
len1 = input(8, minval=1, title="EMA 1")
len2 = input(14, minval=1, title="EMA 2")
len3 = input(50, minval=1, title="EMA 3")

ema1 = ema(emasrc, len1)
ema2 = ema(emasrc, len2)
ema3 = ema(emasrc, len3)

col1 = color.lime
col2 = color.blue
col3 = color.orange

//EMA Plots
//plot(ema1, title="EMA 1", linewidth=1, color=col1)
//plot(ema2, title="EMA 2", linewidth=1, color=col2)
//plot(ema3, title="EMA 3", linewidth=1, color=col3)

crossup = k[0] > d[0] and k[1] <= d[1]
emapos = ema1 > ema2 and ema2 > ema3 and close > ema1
barbuy = crossup and emapos

//plotshape(crossup, style=shape.triangleup, location=location.belowbar, color=color.white)
plotshape(barbuy, style=shape.triangleup, location=location.belowbar, color=color.green)

longloss = sma(open, 1)
//plot(longloss, color=color.red)

//Buy and Sell Factors
profitfactor = input(title="Profitfactor", type=input.float, step=0.1, defval=2)
stopfactor = input(title="Stopfactor", type=input.float, step=0.1, defval=3)
bought = strategy.position_size[1] < strategy.position_size
longcondition = barbuy

if (longcondition) and (afterStartDate) and strategy.opentrades < 1
    strategy.entry("Long", strategy.long)

if (afterStartDate) and strategy.opentrades > 0
    barsbought = barssince(bought)
    profit_level = strategy.position_avg_price + (atr*profitfactor)
    stop_level = strategy.position_avg_price - (atr*stopfactor)
    strategy.exit("Take Profit/ Stop Loss", "Long", stop=stop_level[barsbought], limit=profit_level[barsbought])