Chiến lược kết hợp Bollinger và RSI của dải co thắt
Tổng quan
Chiến lược này sử dụng sự kết hợp của các đai Brin và các chỉ số tương đối mạnh ((RSI)) để xác định cơ hội cho các đai Brin co lại với RSI tăng, và sử dụng các lệnh dừng theo xu hướng để kiểm soát rủi ro.
Nguyên tắc chiến lược
Trọng tâm của logic giao dịch của chiến lược này là nhận diện sự thu hẹp của Burin và đánh giá xu hướng đang ở giai đoạn đầu của xu hướng tăng khi RSI đang đi lên. Cụ thể, khi tiêu chuẩn trên đường quỹ đạo của Burin trong vòng 20 ngày kém hơn ATR*2 giờ, chúng tôi đánh giá BRI đang thu hẹp; đồng thời, nếu cả RSI ngày 10 và 14 đều có xu hướng tăng, chúng tôi dự đoán giá sẽ phá vỡ BRI và thực hiện nhiều chiến lược.
Sau khi vào sân, chúng tôi sử dụng ATR khoảng cách an toàn + dừng lỗ khi giá tăng để khóa lợi nhuận và kiểm soát rủi ro. Khi giá vượt quá đường dừng hoặc RSI quá nóng ((RSI 14 ngày vượt quá 70, RSI 10 ngày vượt quá RSI 14 ngày).
Phân tích lợi thế
Lợi thế lớn nhất của chiến lược này là sử dụng thu hẹp của Brin để đánh giá thời gian sắp xếp, kết hợp với hướng đột phá của giá dự báo của chỉ số RSI. Ngoài ra, việc sử dụng dừng thích ứng thay vì dừng cố định có thể điều chỉnh linh hoạt theo mức độ biến động của thị trường, do đó mang lại lợi nhuận lớn hơn trong trường hợp đảm bảo rủi ro có thể kiểm soát được.
Phân tích rủi ro
Rủi ro chính của chiến lược này là khi nhận ra sự thu hẹp của vòng Boolean và RSI tăng, thị trường có thể là phá vỡ giả. Ngoài ra, trong trường hợp dừng, dừng thích ứng khi biến động quá lớn có thể không dừng kịp thời.
Hướng tối ưu hóa
Chính sách này có thể được tối ưu hóa theo các khía cạnh sau:
Cải thiện các thiết lập tham số của dải Brin để tối ưu hóa hiệu quả thu hẹp
Thử các tham số RSI khác nhau
Kiểm tra hiệu quả của các phương pháp dừng khác (dừng đường cong, dừng xem lại, v.v.)
Điều chỉnh tham số theo đặc tính của các giống khác nhau
Tóm tắt
Chiến lược này sử dụng sự bổ sung của Brin và RSI để có được tỷ lệ lợi nhuận thu hồi tốt hơn với điều kiện kiểm soát rủi ro. Chiến lược này có thể được tối ưu hóa sau đó từ phương thức dừng lỗ, lựa chọn tham số, v.v., để phù hợp hơn với các loại giao dịch khác nhau.
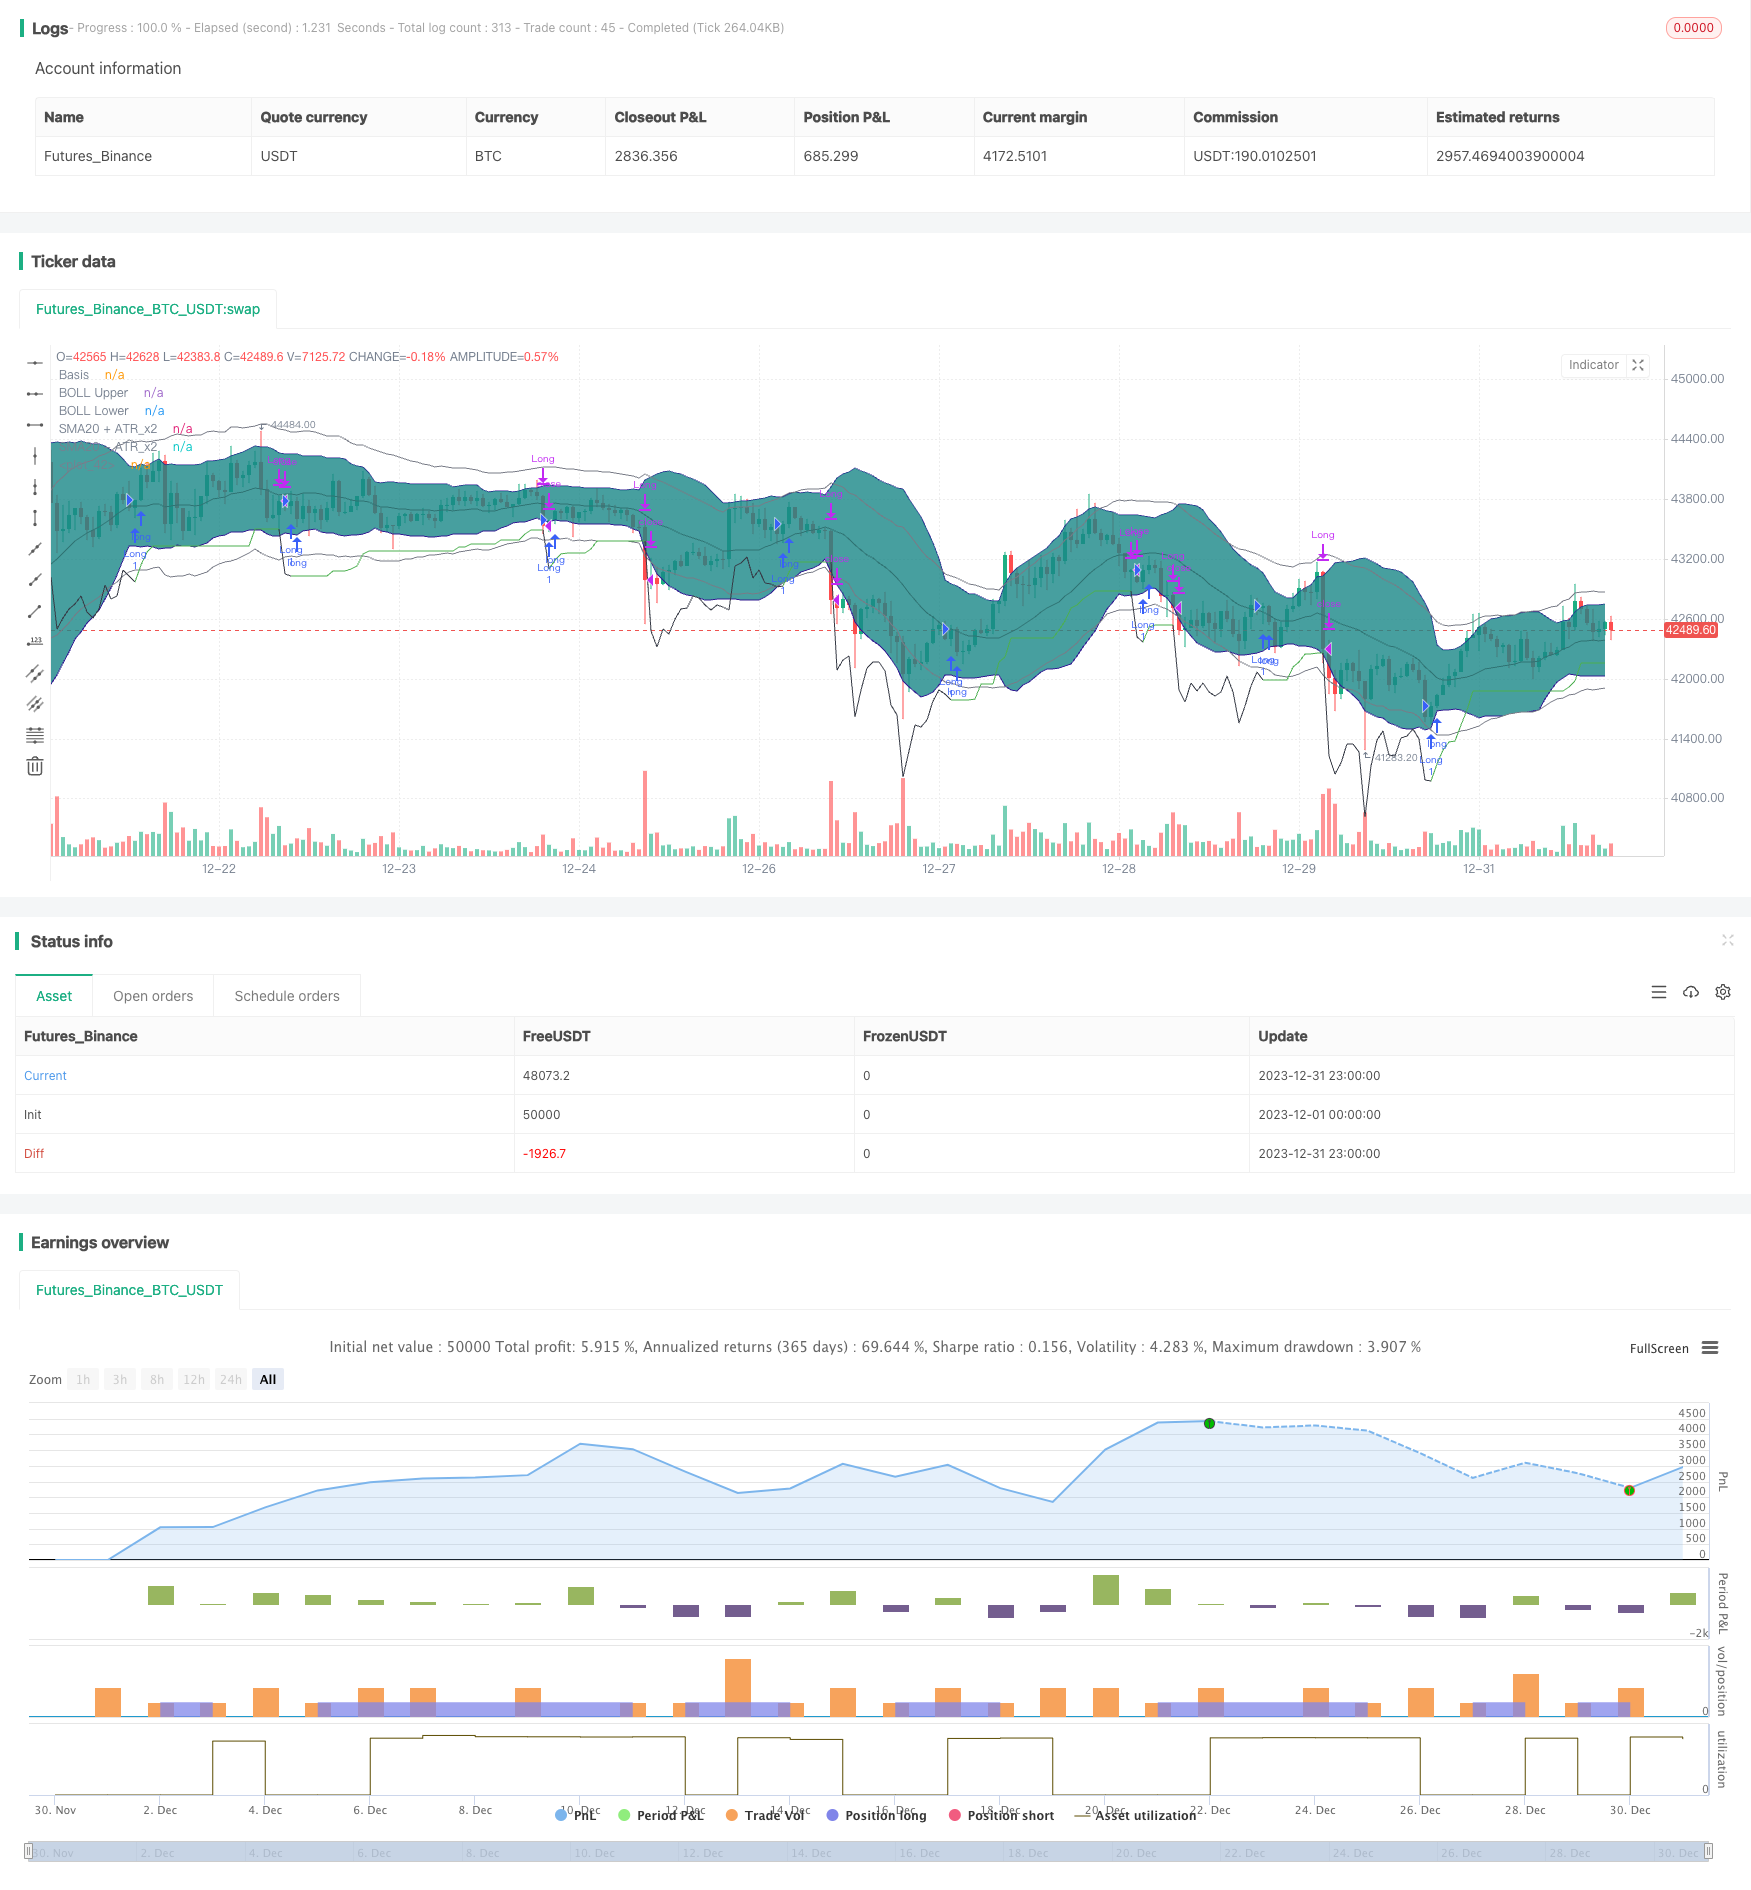
/*backtest
start: 2023-12-01 00:00:00
end: 2023-12-31 23:59:59
period: 1h
basePeriod: 15m
exchanges: [{"eid":"Futures_Binance","currency":"BTC_USDT"}]
*/

// This source code is subject to the terms of the Mozilla Public License 2.0 at https://mozilla.org/MPL/2.0/
// © DojiEmoji
//

//@version=4
strategy("[KL] BOLL + RSI Strategy",overlay=true,pyramiding=1)

// Timeframe {
backtest_timeframe_start = input(defval = timestamp("01 Apr 2016 13:30 +0000"), title = "Backtest Start Time", type = input.time)
USE_ENDTIME = input(false,title="Define backtest end-time (If false, will test up to most recent candle)")
backtest_timeframe_end = input(defval = timestamp("01 May 2021 19:30 +0000"), title = "Backtest End Time (if checked above)", type = input.time)
within_timeframe = true
// }

// Bollinger bands (sdv=2, len=20) {
BOLL_length = 20, BOLL_src = close, SMA20 = sma(BOLL_src, BOLL_length), BOLL_sDEV_x2 = 2 * stdev(BOLL_src, BOLL_length)
BOLL_upper = SMA20 + BOLL_sDEV_x2, BOLL_lower = SMA20 - BOLL_sDEV_x2
plot(SMA20, "Basis", color=#872323, offset = 0)
BOLL_p1 = plot(BOLL_upper, "BOLL Upper", color=color.navy, offset = 0, transp=50)
BOLL_p2 = plot(BOLL_lower, "BOLL Lower", color=color.navy, offset = 0, transp=50)
fill(BOLL_p1, BOLL_p2, title = "Background", color=#198787, transp=85)
// }

// Volatility Indicators {
ATR_x2 = atr(BOLL_length) * 2 // multiplier aligns with BOLL
avg_atr = sma(ATR_x2, input(1,title="No. of candles to lookback when determining ATR is decreasing"))
plot(SMA20+ATR_x2, "SMA20 + ATR_x2", color=color.gray, offset = 0, transp=50)
plot(SMA20-ATR_x2, "SMA20 - ATR_x2", color=color.gray, offset = 0, transp=50)
plotchar(ATR_x2, "ATR_x2", "", location = location.bottom)
//}

// Trailing stop loss {
TSL_source = low
var entry_price = float(0), var stop_loss_price = float(0)

trail_profit_line_color = color.green
if strategy.position_size == 0 or not within_timeframe
    trail_profit_line_color := color.black
    stop_loss_price := TSL_source - ATR_x2
else if strategy.position_size > 0
    stop_loss_price := max(stop_loss_price, TSL_source - ATR_x2)
plot(stop_loss_price, color=trail_profit_line_color)

if strategy.position_size > 0 and stop_loss_price > stop_loss_price[1]
	alert("Stop loss limit raised", alert.freq_once_per_bar)

// } end of Trailing stop loss

//Buy setup - Long positions {
is_squeezing = ATR_x2 > BOLL_sDEV_x2
if is_squeezing and within_timeframe and not is_squeezing[1]
	alert("BOLL bands are squeezing", alert.freq_once_per_bar)
else if not is_squeezing and within_timeframe and is_squeezing[1]
	alert("BOLL bands stopped squeezing", alert.freq_once_per_bar)

ema_trend = ema(close, 20)

concat(a, b) =>
	concat = a
	if a != ""
		concat := concat + ", "
	concat := concat + b
	concat
// }

// Sell setup - Long position {
rsi_10 = rsi(close, 10), rsi_14 = rsi(close, 14)
overbought = rsi_14 > input(70,title="[Exit] RSI(14) value considered as overbought") and rsi_10 > rsi_14
// } end of Sell setup - Long position

// MAIN: {
if within_timeframe
	entry_msg = ""
	exit_msg = ""

    // ENTRY {
	conf_count = 0
    volat_decr = avg_atr <= avg_atr[1]
	rsi_upslope = rsi_10 > rsi_10[1] and rsi_14 > rsi_14[1]

	if volat_decr and rsi_upslope and is_squeezing and strategy.position_size == 0
		strategy.entry("Long",strategy.long, comment=entry_msg)
		entry_price := close
		stop_loss_price := TSL_source - ATR_x2
	// }

    // EXIT	{
	if strategy.position_size > 0
		bExit = false
		if close <= entry_price and TSL_source <= stop_loss_price
            exit_msg := concat(exit_msg, "stop loss [TSL]")
			bExit := true
        else if close > entry_price and TSL_source <= stop_loss_price
            exit_msg := concat(exit_msg, "take profit [TSL]")
            bExit := true
		else if overbought
			exit_msg := concat(exit_msg, "overbought")
			bExit := true

        strategy.close("Long", when=bExit, comment=exit_msg)
	// }
// }

// CLEAN UP:
if strategy.position_size == 0 and not is_squeezing
	entry_price := 0
	stop_loss_price := float(0)