Chiến lược theo dõi xu hướng định lượng
Tổng quan
Chiến lược này sử dụng một số chỉ số để đánh giá xu hướng thị trường, bao gồm Bollinger Bands, RSI, ADX và MACD, với khả năng nhận biết xu hướng mạnh mẽ. Khi tín hiệu chỉ số đồng thời tăng giá, hãy thực hiện chiến lược theo đuổi; Khi tín hiệu chỉ số đồng thời giảm giá, hãy dừng vị trí.
Nguyên tắc chiến lược
- Sử dụng Bollinger Bands để xác định giá là trên đường hoặc dưới đường của Bollinger Bands để xác định xu hướng
- Kết hợp với chỉ số RSI để xác định xem bạn đang ở trong khu vực quá mua quá bán để tránh phá vỡ giả
- Sử dụng ADX để đánh giá cường độ xu hướng, chỉ phát tín hiệu khi xu hướng mạnh
- Sử dụng MACD để xác định sự nhất quán giữa xu hướng ngắn hạn và dài hạn
- Kết hợp thời gian trong ngày, chỉ giao dịch trong thời gian giao dịch được chỉ định
Xác định chính xác xu hướng giá thông qua kết hợp nhiều chỉ số, theo dõi kịp thời khi xu hướng xảy ra và đạt được lợi nhuận vượt trội.
Phân tích lợi thế
Lợi thế lớn nhất của chiến lược này là kết hợp các chỉ số được đánh giá toàn diện và chính xác hơn, có thể xác định xu hướng giá một cách hiệu quả và tránh các tín hiệu sai lệch do chỉ số đơn lẻ gây ra.
Cụ thể, những lợi thế là:
- Brin có thể đánh giá mức độ dao động và mức độ yếu của giá cả.
- RSI tránh mua trong vùng quá mua, bán trong vùng quá bán
- ADX đánh giá sức mạnh của xu hướng, chỉ theo xu hướng mạnh
- MACD đánh giá sự đồng nhất của đường dài và đường ngắn
- Giới hạn thời gian giao dịch, tránh rủi ro qua đêm
Xác định thông qua các chỉ số, có thể giảm tối đa các tín hiệu giả và tăng cường sự ổn định của chiến lược.
Phân tích rủi ro
Những rủi ro chính trong chiến lược này là:
- Sự kiện bất ngờ khiến chỉ số không hoạt động
- Lượng tín hiệu giả trong trận động đất
Đối với rủi ro 1, do phụ thuộc vào nhiều chỉ số, có thể tránh được một số vấn đề do chỉ số duy nhất không hoạt động, nhưng vẫn cần cải thiện cơ chế kiểm soát rủi ro.
Đối với rủi ro 2, các tham số có thể được điều chỉnh thích hợp, thu hẹp phạm vi giao dịch, giảm tần suất giao dịch, giảm rủi ro.
Hướng tối ưu hóa
Chiến lược này có thể được tối ưu hóa như sau:
- Tăng các cơ chế dừng lỗ, chẳng hạn như dừng di chuyển, dừng thời gian, dừng phá vỡ, tránh kéo trở lại quá sâu
- Tối ưu hóa tham số, điều chỉnh các tham số chỉ số, tìm tham số tối ưu
- Thêm điều kiện lọc, chẳng hạn như lọc khối lượng giao dịch, tránh phá vỡ giả với khối lượng nhỏ
- Kết hợp với nhiều chỉ số khác như KDJ, OBV, để cải thiện độ chính xác của tín hiệu
- Tự động tối ưu hóa tham số bằng cách sử dụng phương pháp học máy
Bằng cách tiếp tục tối ưu hóa, liên tục cải thiện sức mạnh của các tham số chiến lược, giảm khả năng tín hiệu giả.
Tóm tắt
Chiến lược này có khả năng nhận ra tín hiệu xu hướng mạnh mẽ hơn, có thể nhận ra xu hướng giá hiệu quả thông qua các chỉ số kết hợp.
Tuy nhiên, cũng có một số rủi ro, cần phải liên tục hoàn thiện cơ chế kiểm soát gió, tối ưu hóa các tham số liên tục, để hoạt động ổn định trong thời gian dài. Nếu sau này có thể giới thiệu các phương pháp học máy để tối ưu hóa các tham số tự động, sẽ làm tăng đáng kể tính thô lỗ và khả năng thu lợi của chiến lược.
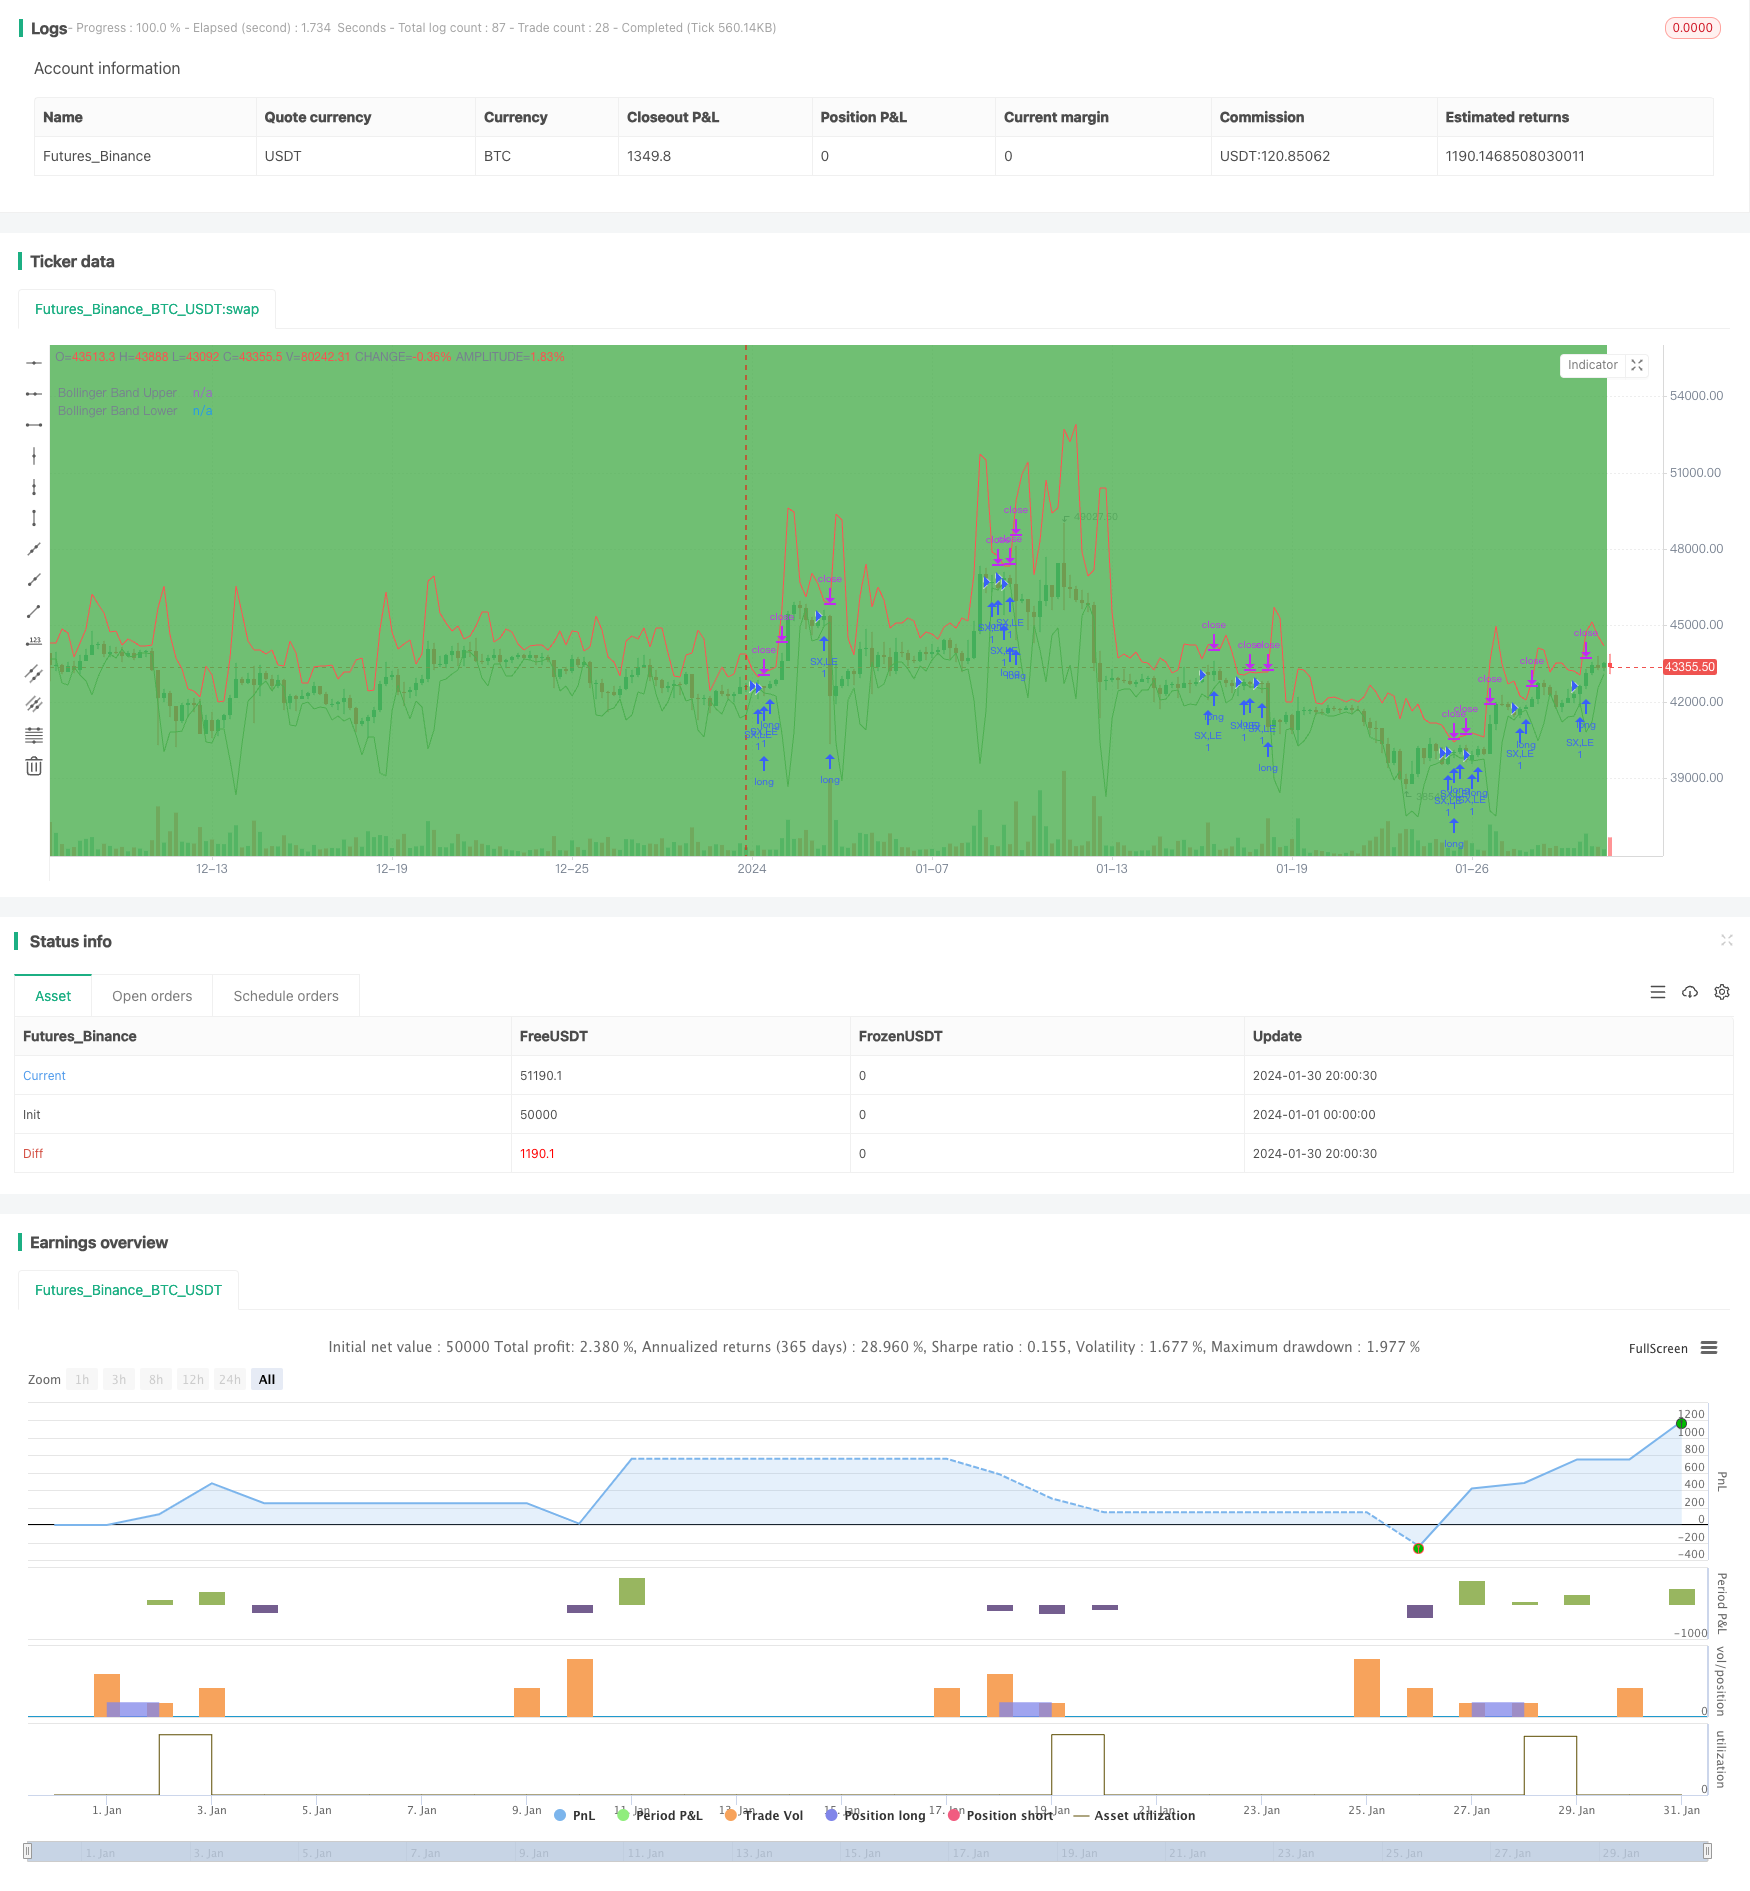
/*backtest
start: 2024-01-01 00:00:00
end: 2024-01-31 00:00:00
period: 5h
basePeriod: 15m
exchanges: [{"eid":"Futures_Binance","currency":"BTC_USDT"}]
*/

// This source code is subject to the terms of the Mozilla Public License 2.0 at https://mozilla.org/MPL/2.0/
// © abilash.s.90


dIMinusCalc(adxLen) =>

    smoothedTrueRange = 0.0
    smoothedDirectionalMovementMinus = 0.0
    dIMinus = 0.0
    trueRange = 0.0
    directionalMovementMinus = 0.0

    trueRange := max(max(high-low, abs(high-nz(close[1]))), abs(low-nz(close[1])))
    directionalMovementMinus := nz(low[1])-low > high-nz(high[1]) ? max(nz(low[1])-low, 0): 0

    smoothedTrueRange := nz(smoothedTrueRange[1]) - (nz(smoothedTrueRange[1])/adxLen) + trueRange
    smoothedDirectionalMovementMinus := nz(smoothedDirectionalMovementMinus[1]) - (nz(smoothedDirectionalMovementMinus[1])/adxLen) + directionalMovementMinus

    dIMinus := smoothedDirectionalMovementMinus / smoothedTrueRange * 100

    dIMinus

dIPlusCalc(adxLen) =>

    smoothedTrueRange = 0.0
    smoothedDirectionalMovementPlus = 0.0
    dIPlus =  0.0
    trueRange = 0.0
    directionalMovementPlus = 0.0

    trueRange := max(max(high-low, abs(high-nz(close[1]))), abs(low-nz(close[1])))
    directionalMovementPlus := high-nz(high[1]) > nz(low[1])-low ? max(high-nz(high[1]), 0): 0

    smoothedTrueRange := nz(smoothedTrueRange[1]) - (nz(smoothedTrueRange[1])/adxLen) + trueRange
    smoothedDirectionalMovementPlus := nz(smoothedDirectionalMovementPlus[1]) - (nz(smoothedDirectionalMovementPlus[1])/adxLen) + directionalMovementPlus

    dIPlus := smoothedDirectionalMovementPlus / smoothedTrueRange * 100

    dIPlus


Adx(adxLen) =>
    dIPlus =  0.0
    dIMinus = 0.0
    dX = 0.0
    aDX = 0.0
    dIPlus := dIPlusCalc(adxLen)
    dIMinus := dIMinusCalc(adxLen)
    dX := abs(dIPlus-dIMinus) / (dIPlus+dIMinus)*100
    aDX := sma(dX, adxLen)

    aDX

BarInSession(sess) => time(timeframe.period, sess) != 0


//@version=4
strategy("Bollinger Band + RSI + ADX + MACD", overlay=true)

//Session

session = input(title="Trading Session", type=input.session, defval="0930-1500")

sessionColor = BarInSession(session) ? color.green : na

bgcolor(color=sessionColor, transp=95)

// Bollinger Bands
src = input(high, title="Bollinger Band Source", type=input.source)
length = input(3, minval=1, type=input.integer, title="Bollinger Band Length")
mult = input(4.989, minval=0.001, maxval=50, step=0.001, type=input.float, title="Bollinger Band Std Dev")
basis = sma(src, length)
dev = mult * stdev(src, length)
upper = basis + dev
lower = basis - dev


plot(upper, title="Bollinger Band Upper", color=color.red)
plot(lower, title="Bollinger Band Lower", color=color.green)

// RSI
rsiSrc = input(close, title="RSI Source", type=input.source)
rsiLength = input(16, minval=1, type=input.integer, title="RSI Length")
rsiComparator = input(39.2, title="RSI Comparator", type=input.float, step=0.1)

rsi = rsi(rsiSrc, rsiLength)

// ADX
adxLength = input(14, minval=1, type=input.integer, title="ADX Length")
adxComparator = input(14, minval=1, type=input.integer, title="ADX Comparator")

adx = Adx(adxLength)

// Heikinashi

haClose = security(heikinashi(syminfo.ticker), timeframe.period, close)
haOpen = security(heikinashi(syminfo.ticker), timeframe.period, open)

nextHaOpen = (haOpen + haClose) / 2

//MACD

macdCalcTypeProcessed = input(title="MACD Source", type=input.source, defval=high)
fast = input(12, title="MACD Fast")
slow = input(20, title="MACD Slow")
signalLen = input(15, title="MACD Signal")

fastMA = ema(macdCalcTypeProcessed, fast)
slowMA = ema(macdCalcTypeProcessed, slow)
macd = fastMA - slowMA
signal = sma(macd, signalLen)


longCondition() =>
    (low < lower) and (rsi[0] > rsiComparator) and (adx > adxComparator) and (close > nextHaOpen) and BarInSession(session) and macd > signal

stop = (close - max((low - (low * 0.0022)), (close - (close * 0.0032)))) / syminfo.mintick
target = (max(upper, (close + (close * 0.0075))) - close) / syminfo.mintick


strategy.entry("SX,LE", strategy.long, when=longCondition(), comment="SX,LE")
strategy.close_all(when=(not BarInSession(session)))
strategy.exit("LX", from_entry="SX,LE", profit=target, loss=stop)