Chiến lược định lượng theo dõi xu hướng dựa trên chỉ báo Hull và chỉ báo LSMA
Tổng quan
Chiến lược này được thực hiện bằng cách kết hợp chỉ số Hull và chỉ số LSMA để xác định hướng xu hướng và điểm đảo ngược xu hướng, để theo dõi xu hướng. Khi chỉ số Hull hiển thị xu hướng tăng và LSMA trên đi qua chỉ số Hull, hãy làm nhiều hơn; Khi chỉ số Hull hiển thị xu hướng giảm và LSMA dưới đi qua chỉ số Hull, hãy làm trống.
Nguyên tắc chiến lược
Chỉ số Hull được sử dụng để xác định xu hướng của giá trị. Khi đường trung đạo ((MHULL) nằm trên đường dưới (LHULL), nó biểu thị xu hướng tăng; ngược lại, nó biểu thị xu hướng giảm.
Chỉ số LSMA được sử dụng để xác định điểm đảo ngược xu hướng. Khi chỉ số LSMA đi qua MHULL, nó biểu thị xu hướng tăng lên hoặc tăng tốc; Khi chỉ số LSMA đi qua MHULL, nó biểu thị xu hướng giảm hoặc tăng tốc.
Kết hợp cả hai, khi chỉ số Hull cho thấy xu hướng tăng ((MHULL > LHULL) và LSMA trên xuyên qua MHULL, làm nhiều; khi chỉ số Hull cho thấy xu hướng giảm ((MHULL < LHULL) và LSMA dưới xuyên qua MHULL, làm trống.
Cài đặt Stop Loss là điểm dao động gần nhất. Cài đặt Stop Loss là điểm thấp nhất gần nhất, Cài đặt Stop Loss là điểm cao nhất gần nhất.
Phân tích lợi thế
Chiến lược này có những ưu điểm sau:
Chỉ số Hull phản ứng nhanh chóng, có thể bắt kịp sự chuyển đổi xu hướng; LSMA mượt mà, nhận biết tín hiệu đảo ngược chính xác và đáng tin cậy.
Các tín hiệu giả được đánh giá bởi chỉ số Hull thông qua LSMA đã làm giảm khả năng giao dịch sai.
Sử dụng điểm biến động như là điểm dừng lỗ, bảo vệ tối đa sự an toàn tài chính.
Nó có thể được sử dụng trong khung thời gian 1 phút hoặc ít hơn, và có thể được sử dụng trong các giao dịch tần số trung bình và thấp.
Phân tích rủi ro
Chiến lược này cũng có một số rủi ro:
Trong tình huống xung đột, chỉ số Hull và LSMA có thể xảy ra nhiều lần giao dịch quá thường xuyên. Các tham số nên được điều chỉnh thích hợp để giảm tần suất giao dịch.
Đặt điểm dừng là điểm dao động có thể được kích hoạt bởi sự điều chỉnh giá trong ngắn hạn, nên mở rộng khoảng cách điểm dừng thích hợp.
Vì chỉ số LSMA chậm trễ, có thể có nguy cơ bị sai lệch một chút. Các chỉ số khác như hình dạng đường K nên được kết hợp để xác nhận.
Hướng tối ưu hóa
Chiến lược này có thể được tối ưu hóa theo các khía cạnh sau:
Tối ưu hóa các tham số của chỉ số Hull và LSMA để kết hợp chúng phù hợp hơn với các giống và khoảng thời gian khác nhau.
Tăng các điều kiện lọc dựa trên biến động, khối lượng giao dịch, v.v. để tránh giao dịch sai trong tình trạng biến động.
Thêm một thuật toán học máy để đánh giá xu hướng.
Kết hợp các kỹ thuật như học sâu để xác định các vùng kháng cự hỗ trợ quan trọng, làm cho dừng lỗ hợp lý hơn.
Tóm tắt
Chiến lược này sử dụng kết hợp các chỉ số Hull và LSMA để đánh giá sự thay đổi hướng xu hướng, thực hiện giao dịch theo dõi xu hướng. Ưu điểm là hoạt động đơn giản, phản ứng nhanh chóng, có thể được áp dụng rộng rãi cho giao dịch định lượng tần số trung bình và thấp.
/*backtest
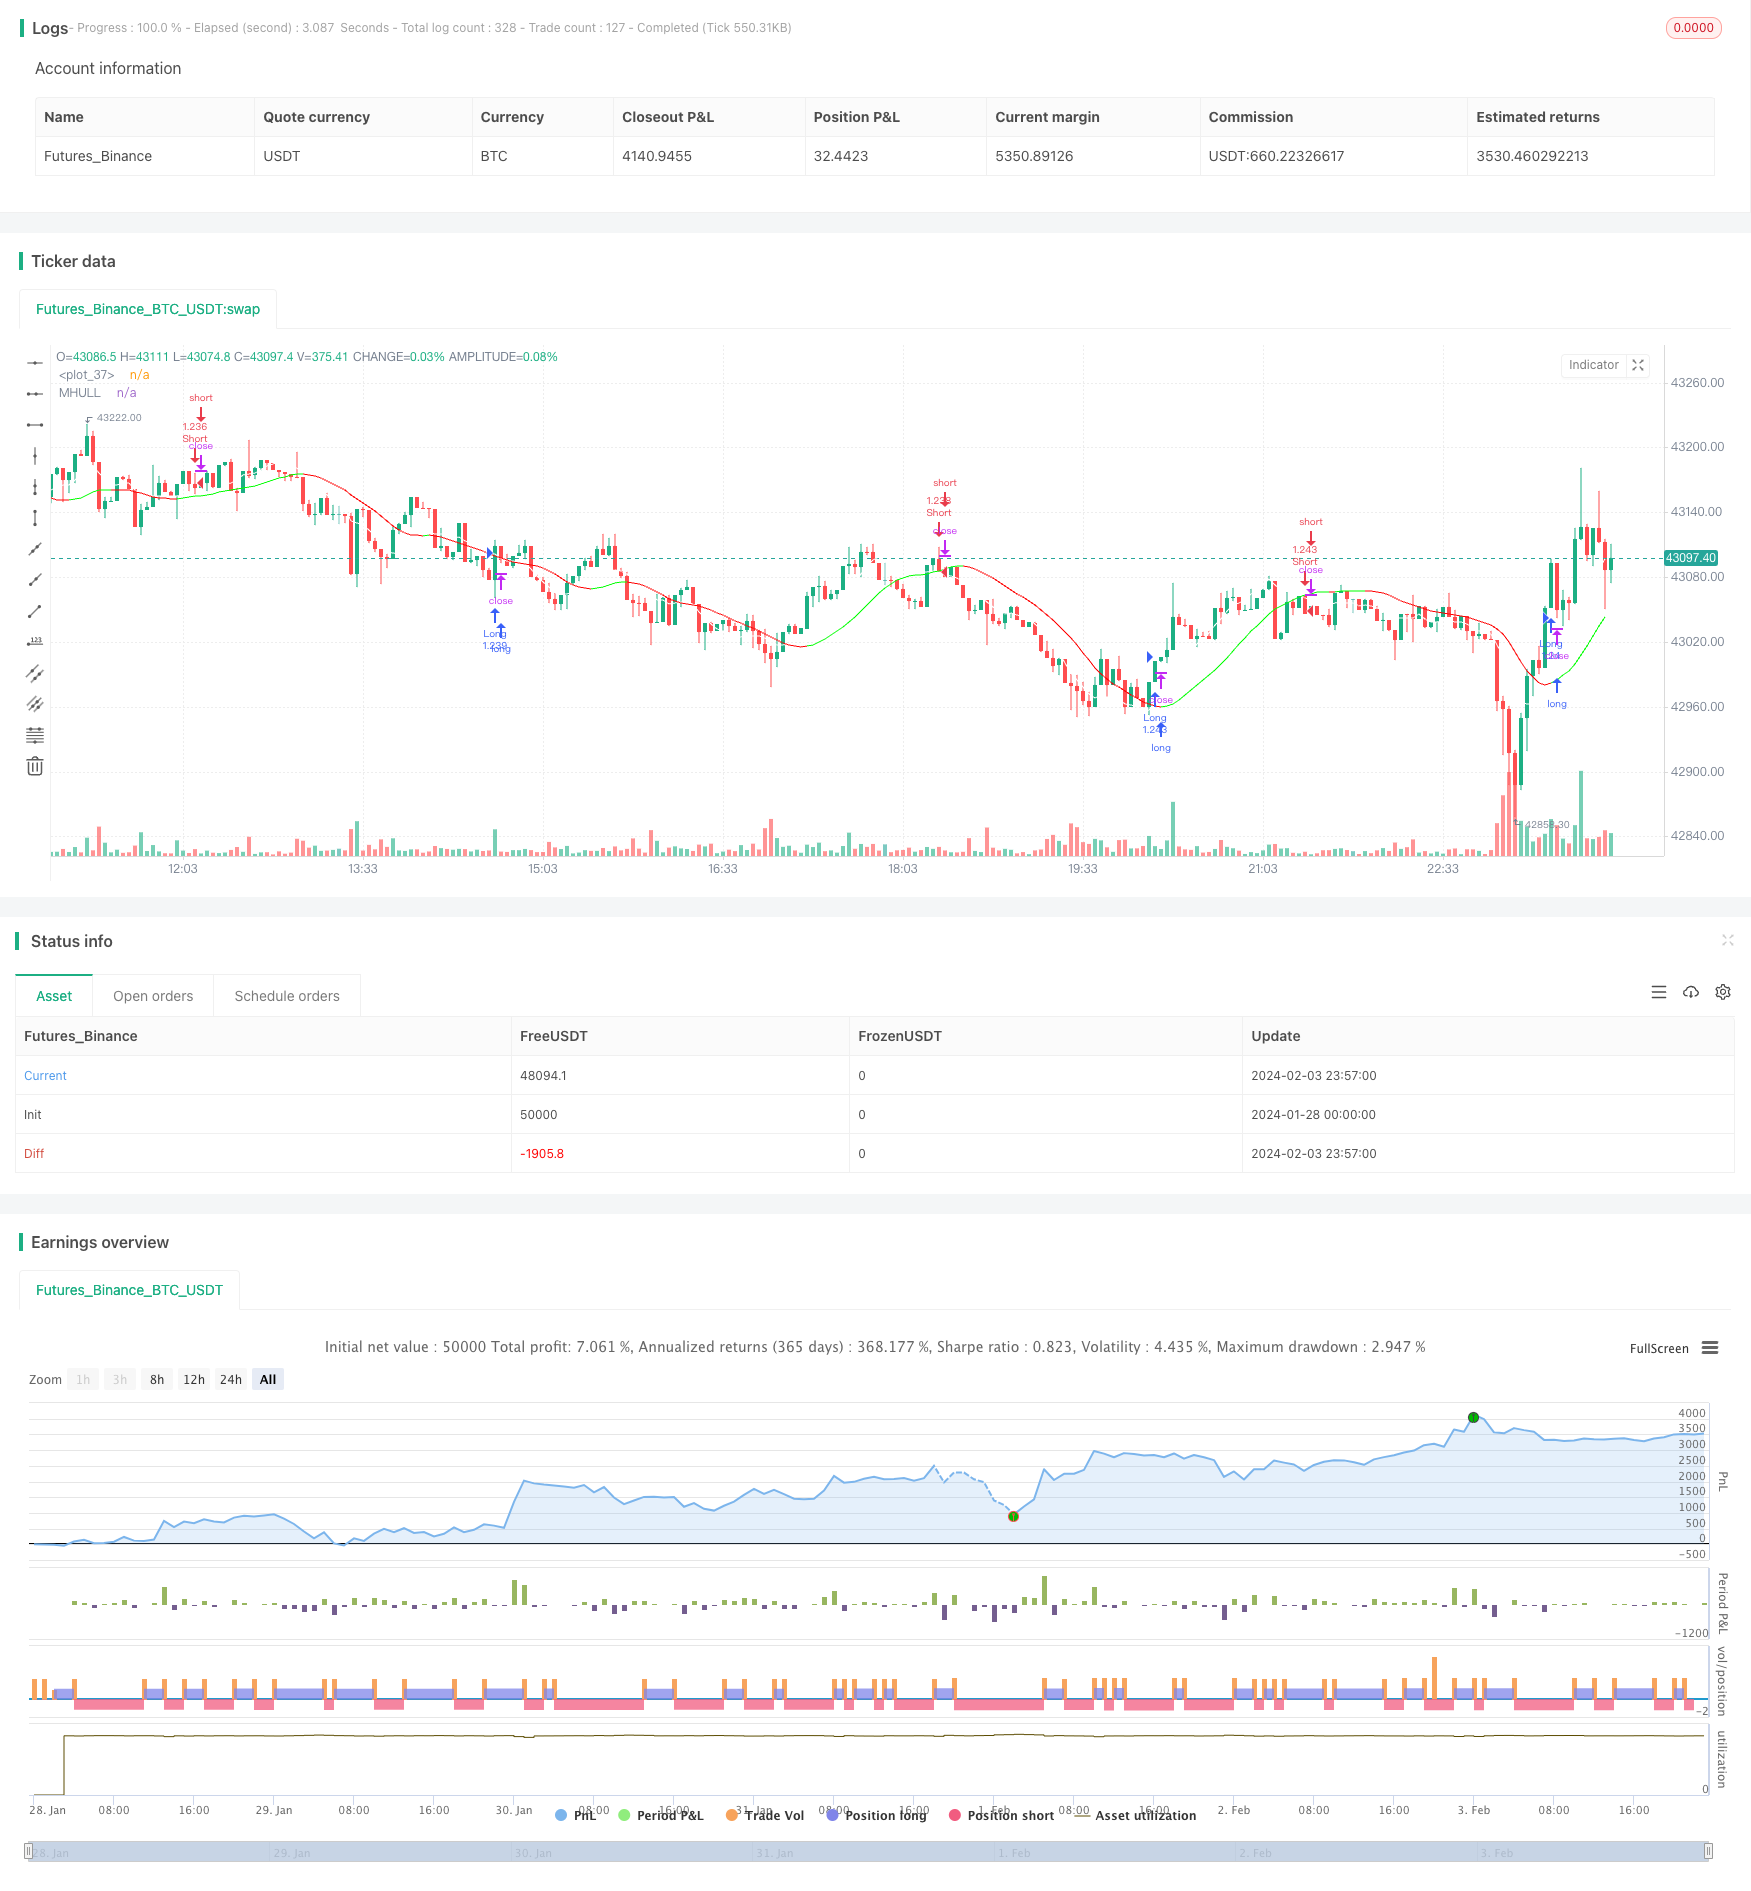
start: 2024-01-28 00:00:00
end: 2024-02-04 00:00:00
period: 3m
basePeriod: 1m
exchanges: [{"eid":"Futures_Binance","currency":"BTC_USDT"}]
*/
// This source code is subject to the terms of the Mozilla Public License 2.0 at https://mozilla.org/MPL/2.0/
// © myn
//@version=5
strategy('Strategy Myth-Busting #9 - HullSuite+LSMA - [MYN]', max_bars_back=5000, overlay=true, pyramiding=0, initial_capital=1000, currency='USD', default_qty_type=strategy.percent_of_equity, default_qty_value=1.0, commission_value=0.075, use_bar_magnifier = false)
// Hull Suite by InSilico
// Least Squares Moving Average
// Long
// Hull Suite is red and LSMA crosses above HUll Suite while red
// Stop loss latest swing low
//Short
// Hull Suite is green and LSMA crosses under HUll Suite while green
// Stop loss latest swing high
//1:4 Risk ratio
// 1 minute timeframe
/////////////////////////////////////
//* Put your strategy logic below *//
/////////////////////////////////////
//72iE0gCVjvM
// LSMA
//░░░░░░░░░░░░░░░░░░░░░░░░░░░░░░░░░░░░░░░░░░░░░░░░░░░░░░░░░░░░░░░░░░░░░░░░░░░░░░░░░░░░░░░░░░░░░░░░░░░░░░░░░░░░░░░░░░░░░░░░░░░░░░░░░░░░░░░░░░░░░░░░░░
//@version=5
//indicator(title = "Least Squares Moving Average", shorttitle="LSMA", overlay=true, timeframe="", timeframe_gaps=true)
length1 = input(title="Length", defval=25, group="Least Squares Moving Average (LSMA)")
offset1 = input(title="Offset", defval=0)
src1 = input(close, title="Source")
lsma = ta.linreg(src1, length1, offset1)
plot(lsma, color=color.white)
// Hull Suite by InSilico
//░░░░░░░░░░░░░░░░░░░░░░░░░░░░░░░░░░░░░░░░░░░░░░░░░░░░░░░░░░░░░░░░░░░░░░░░░░░░░░░░░░░░░░░░░░░░░░░░░░░░░░░░░░░░░░░░░░░░░░░░░░░░░░░░░░░░░░░░░░░░░░░░░░
//@version=5
//Basic Hull Ma Pack tinkered by InSilico
//indicator('Hull Suite by InSilico', overlay=true)
//INPUT
src = input(close, title='Source', group="Hull Suite")
modeSwitch = input.string('Hma', title='Hull Variation', options=['Hma', 'Thma', 'Ehma'])
length = input(55, title='Length(180-200 for floating S/R , 55 for swing entry)')
lengthMult = input(1.0, title='Length multiplier (Used to view higher timeframes with straight band)')
useHtf = input(false, title='Show Hull MA from X timeframe? (good for scalping)')
htf = input.timeframe('240', title='Higher timeframe')
switchColor = input(true, 'Color Hull according to trend?')
candleCol = input(false, title='Color candles based on Hull\'s Trend?')
visualSwitch = input(false, title='Show as a Band?')
thicknesSwitch = input(1, title='Line Thickness')
transpSwitch = input.int(40, title='Band Transparency', step=5)
//FUNCTIONS
//HMA
HMA(_src, _length) =>
ta.wma(2 * ta.wma(_src, _length / 2) - ta.wma(_src, _length), math.round(math.sqrt(_length)))
//EHMA
EHMA(_src, _length) =>
ta.ema(2 * ta.ema(_src, _length / 2) - ta.ema(_src, _length), math.round(math.sqrt(_length)))
//THMA
THMA(_src, _length) =>
ta.wma(ta.wma(_src, _length / 3) * 3 - ta.wma(_src, _length / 2) - ta.wma(_src, _length), _length)
//SWITCH
Mode(modeSwitch, src, len) =>
modeSwitch == 'Hma' ? HMA(src, len) : modeSwitch == 'Ehma' ? EHMA(src, len) : modeSwitch == 'Thma' ? THMA(src, len / 2) : na
//OUT
_hull = Mode(modeSwitch, src, int(length * lengthMult))
HULL = useHtf ? request.security(syminfo.ticker, htf, _hull) : _hull
MHULL = HULL[0]
SHULL = HULL[2]
//COLOR
hullColor = switchColor ? HULL > HULL[2] ? #00ff00 : #ff0000 : #ff9800
//PLOT
///< Frame
Fi1 = plot(MHULL, title='MHULL', color=hullColor, linewidth=thicknesSwitch, transp=50)
Fi2 = plot(visualSwitch ? SHULL : na, title='SHULL', color=hullColor, linewidth=thicknesSwitch, transp=50)
alertcondition(ta.crossover(MHULL, SHULL), title='Hull trending up.', message='Hull trending up.')
alertcondition(ta.crossover(SHULL, MHULL), title='Hull trending down.', message='Hull trending down.')
///< Ending Filler
fill(Fi1, Fi2, title='Band Filler', color=hullColor, transp=transpSwitch)
///BARCOLOR
barcolor(color=candleCol ? switchColor ? hullColor : na : na)
// Long
// Hull Suite is red and LSMA crosses above HUll Suite while red
// Stop loss latest swing low
//Short
// Hull Suite is green and LSMA crosses under HUll Suite while green
// Stop loss latest swing high
//1:4 Risk ratio
longEntry = hullColor == #ff0000 and ta.crossover(lsma, MHULL )
shortEntry = hullColor == #00ff00 and ta.crossunder(lsma, MHULL)
//////////////////////////////////////
//* Put your strategy rules below *//
/////////////////////////////////////
longCondition = longEntry
shortCondition = shortEntry
//define as 0 if do not want to use
closeLongCondition = 0
closeShortCondition = 0
// ADX
//░░░░░░░░░░░░░░░░░░░░░░░░░░░░░░░░░░░░░░░░░░░░░░░░░░░░░░░░░░░░░░░░░░░░░░░░░░░░░░░░░░░░░░░░░░░░░░░░░░░░░░░░░░░░░░░░░░░░░░░░░░░░░░░░░░░░░░░░░░░░░░░░░░
adxEnabled = input.bool(defval = false , title = "Average Directional Index (ADX)", tooltip = "", group ="ADX" )
adxlen = input(14, title="ADX Smoothing", group="ADX")
adxdilen = input(14, title="DI Length", group="ADX")
adxabove = input(25, title="ADX Threshold", group="ADX")
adxdirmov(len) =>
adxup = ta.change(high)
adxdown = -ta.change(low)
adxplusDM = na(adxup) ? na : (adxup > adxdown and adxup > 0 ? adxup : 0)
adxminusDM = na(adxdown) ? na : (adxdown > adxup and adxdown > 0 ? adxdown : 0)
adxtruerange = ta.rma(ta.tr, len)
adxplus = fixnan(100 * ta.rma(adxplusDM, len) / adxtruerange)
adxminus = fixnan(100 * ta.rma(adxminusDM, len) / adxtruerange)
[adxplus, adxminus]
adx(adxdilen, adxlen) =>
[adxplus, adxminus] = adxdirmov(adxdilen)
adxsum = adxplus + adxminus
adx = 100 * ta.rma(math.abs(adxplus - adxminus) / (adxsum == 0 ? 1 : adxsum), adxlen)
adxsig = adxEnabled ? adx(adxdilen, adxlen) : na
isADXEnabledAndAboveThreshold = adxEnabled ? (adxsig > adxabove) : true
//Backtesting Time Period (Input.time not working as expected as of 03/30/2021. Giving odd start/end dates
//░░░░░░░░░░░░░░░░░░░░░░░░░░░░░░░░░░░░░░░░░░░░░░░░░░░░░░░░░░░░░░░░░░░░░░░░░░░░░░░░░░░░░░░░░░░░░░░░░░░░░░░░░░░░░░░░░░░░░░░░░░░░░░░░░░░░░░░░░░░░░░░░░░
useStartPeriodTime = input.bool(true, 'Start', group='Date Range', inline='Start Period')
startPeriodTime = input(timestamp('1 Jan 2019'), '', group='Date Range', inline='Start Period')
useEndPeriodTime = input.bool(true, 'End', group='Date Range', inline='End Period')
endPeriodTime = input(timestamp('31 Dec 2030'), '', group='Date Range', inline='End Period')
start = useStartPeriodTime ? startPeriodTime >= time : false
end = useEndPeriodTime ? endPeriodTime <= time : false
calcPeriod = true
// Trade Direction
// ░░░░░░░░░░░░░░░░░░░░░░░░░░░░░░░░░░░░░░░░░░░░░░░░░░░░░░░░░░░░░░░░░░░░░░░░░░░░░░░░░░░░░░░░░░░░░░░░░░░░░░░░░░░░░░░░░░░░░░░░░░░░░░░░░░░░░░░░░░░░░░░░░░
tradeDirection = input.string('Long and Short', title='Trade Direction', options=['Long and Short', 'Long Only', 'Short Only'], group='Trade Direction')
// Percent as Points
// ░░░░░░░░░░░░░░░░░░░░░░░░░░░░░░░░░░░░░░░░░░░░░░░░░░░░░░░░░░░░░░░░░░░░░░░░░░░░░░░░░░░░░░░░░░░░░░░░░░░░░░░░░░░░░░░░░░░░░░░░░░░░░░░░░░░░░░░░░░░░░░░░░░
per(pcnt) =>
strategy.position_size != 0 ? math.round(pcnt / 100 * strategy.position_avg_price / syminfo.mintick) : float(na)
// Take profit 1
// ░░░░░░░░░░░░░░░░░░░░░░░░░░░░░░░░░░░░░░░░░░░░░░░░░░░░░░░░░░░░░░░░░░░░░░░░░░░░░░░░░░░░░░░░░░░░░░░░░░░░░░░░░░░░░░░░░░░░░░░░░░░░░░░░░░░░░░░░░░░░░░░░░░
tp1 = input.float(title='Take Profit 1 - Target %', defval=100, minval=0.0, step=0.5, group='Take Profit', inline='Take Profit 1')
q1 = input.int(title='% Of Position', defval=100, minval=0, group='Take Profit', inline='Take Profit 1')
// Take profit 2
// ░░░░░░░░░░░░░░░░░░░░░░░░░░░░░░░░░░░░░░░░░░░░░░░░░░░░░░░░░░░░░░░░░░░░░░░░░░░░░░░░░░░░░░░░░░░░░░░░░░░░░░░░░░░░░░░░░░░░░░░░░░░░░░░░░░░░░░░░░░░░░░░░░░
tp2 = input.float(title='Take Profit 2 - Target %', defval=100, minval=0.0, step=0.5, group='Take Profit', inline='Take Profit 2')
q2 = input.int(title='% Of Position', defval=100, minval=0, group='Take Profit', inline='Take Profit 2')
// Take profit 3
// ░░░░░░░░░░░░░░░░░░░░░░░░░░░░░░░░░░░░░░░░░░░░░░░░░░░░░░░░░░░░░░░░░░░░░░░░░░░░░░░░░░░░░░░░░░░░░░░░░░░░░░░░░░░░░░░░░░░░░░░░░░░░░░░░░░░░░░░░░░░░░░░░░░
tp3 = input.float(title='Take Profit 3 - Target %', defval=100, minval=0.0, step=0.5, group='Take Profit', inline='Take Profit 3')
q3 = input.int(title='% Of Position', defval=100, minval=0, group='Take Profit', inline='Take Profit 3')
// Take profit 4
// ░░░░░░░░░░░░░░░░░░░░░░░░░░░░░░░░░░░░░░░░░░░░░░░░░░░░░░░░░░░░░░░░░░░░░░░░░░░░░░░░░░░░░░░░░░░░░░░░░░░░░░░░░░░░░░░░░░░░░░░░░░░░░░░░░░░░░░░░░░░░░░░░░░
tp4 = input.float(title='Take Profit 4 - Target %', defval=100, minval=0.0, step=0.5, group='Take Profit')
/// Stop Loss
// ░░░░░░░░░░░░░░░░░░░░░░░░░░░░░░░░░░░░░░░░░░░░░░░░░░░░░░░░░░░░░░░░░░░░░░░░░░░░░░░░░░░░░░░░░░░░░░░░░░░░░░░░░░░░░░░░░░░░░░░░░░░░░░░░░░░░░░░░░░░░░░░░░░
stoplossPercent = input.float(title='Stop Loss (%)', defval=999, minval=0.01, group='Stop Loss') * 0.01
slLongClose = close < strategy.position_avg_price * (1 - stoplossPercent)
slShortClose = close > strategy.position_avg_price * (1 + stoplossPercent)
/// Leverage
// ░░░░░░░░░░░░░░░░░░░░░░░░░░░░░░░░░░░░░░░░░░░░░░░░░░░░░░░░░░░░░░░░░░░░░░░░░░░░░░░░░░░░░░░░░░░░░░░░░░░░░░░░░░░░░░░░░░░░░░░░░░░░░░░░░░░░░░░░░░░░░░░░░░
leverage = input.float(1, 'Leverage', step=.5, group='Leverage')
contracts = math.min(math.max(.000001, strategy.equity / close * leverage), 1000000000)
/// Trade State Management
// ░░░░░░░░░░░░░░░░░░░░░░░░░░░░░░░░░░░░░░░░░░░░░░░░░░░░░░░░░░░░░░░░░░░░░░░░░░░░░░░░░░░░░░░░░░░░░░░░░░░░░░░░░░░░░░░░░░░░░░░░░░░░░░░░░░░░░░░░░░░░░░░░░░
isInLongPosition = strategy.position_size > 0
isInShortPosition = strategy.position_size < 0
/// ProfitView Alert Syntax String Generation
// ░░░░░░░░░░░░░░░░░░░░░░░░░░░░░░░░░░░░░░░░░░░░░░░░░░░░░░░░░░░░░░░░░░░░░░░░░░░░░░░░░░░░░░░░░░░░░░░░░░░░░░░░░░░░░░░░░░░░░░░░░░░░░░░░░░░░░░░░░░░░░░░░░░
alertSyntaxPrefix = input.string(defval='CRYPTANEX_99FTX_Strategy-Name-Here', title='Alert Syntax Prefix', group='ProfitView Alert Syntax')
alertSyntaxBase = alertSyntaxPrefix + '\n#' + str.tostring(open) + ',' + str.tostring(high) + ',' + str.tostring(low) + ',' + str.tostring(close) + ',' + str.tostring(volume) + ','
/// Trade Execution
// ░░░░░░░░░░░░░░░░░░░░░░░░░░░░░░░░░░░░░░░░░░░░░░░░░░░░░░░░░░░░░░░░░░░░░░░░░░░░░░░░░░░░░░░░░░░░░░░░░░░░░░░░░░░░░░░░░░░░░░░░░░░░░░░░░░░░░░░░░░░░░░░░░░
longConditionCalc = (longCondition and isADXEnabledAndAboveThreshold)
shortConditionCalc = (shortCondition and isADXEnabledAndAboveThreshold)
if calcPeriod
if longConditionCalc and tradeDirection != 'Short Only' and isInLongPosition == false
strategy.entry('Long', strategy.long, qty=contracts)
alert(message=alertSyntaxBase + 'side:long', freq=alert.freq_once_per_bar_close)
if shortConditionCalc and tradeDirection != 'Long Only' and isInShortPosition == false
strategy.entry('Short', strategy.short, qty=contracts)
alert(message=alertSyntaxBase + 'side:short', freq=alert.freq_once_per_bar_close)
//Inspired from Multiple %% profit exits example by adolgo https://www.tradingview.com/script/kHhCik9f-Multiple-profit-exits-example/
strategy.exit('TP1', qty_percent=q1, profit=per(tp1))
strategy.exit('TP2', qty_percent=q2, profit=per(tp2))
strategy.exit('TP3', qty_percent=q3, profit=per(tp3))
strategy.exit('TP4', profit=per(tp4))
strategy.close('Long', qty_percent=100, comment='SL Long', when=slLongClose)
strategy.close('Short', qty_percent=100, comment='SL Short', when=slShortClose)
strategy.close_all(when=closeLongCondition or closeShortCondition, comment='Close Postion')
/// Dashboard
// ░░░░░░░░░░░░░░░░░░░░░░░░░░░░░░░░░░░░░░░░░░░░░░░░░░░░░░░░░░░░░░░░░░░░░░░░░░░░░░░░░░░░░░░░░░░░░░░░░░░░░░░░░░░░░░░░░░░░░░░░░░░░░░░░░░░░░░░░░░░░░░░░░░
// Inspired by https://www.tradingview.com/script/uWqKX6A2/ - Thanks VertMT
showDashboard = input.bool(group="Dashboard", title="Show Dashboard", defval=false)
f_fillCell(_table, _column, _row, _title, _value, _bgcolor, _txtcolor) =>
_cellText = _title + "\n" + _value
table.cell(_table, _column, _row, _cellText, bgcolor=_bgcolor, text_color=_txtcolor, text_size=size.auto)
// Draw dashboard table
if showDashboard
var bgcolor = color.new(color.black,0)
// Keep track of Wins/Losses streaks
newWin = (strategy.wintrades > strategy.wintrades[1]) and (strategy.losstrades == strategy.losstrades[1]) and (strategy.eventrades == strategy.eventrades[1])
newLoss = (strategy.wintrades == strategy.wintrades[1]) and (strategy.losstrades > strategy.losstrades[1]) and (strategy.eventrades == strategy.eventrades[1])
varip int winRow = 0
varip int lossRow = 0
varip int maxWinRow = 0
varip int maxLossRow = 0
if newWin
lossRow := 0
winRow := winRow + 1
if winRow > maxWinRow
maxWinRow := winRow
if newLoss
winRow := 0
lossRow := lossRow + 1
if lossRow > maxLossRow
maxLossRow := lossRow
// Prepare stats table
var table dashTable = table.new(position.bottom_right, 1, 15, border_width=1)
if barstate.islastconfirmedhistory
// Update table
dollarReturn = strategy.netprofit
f_fillCell(dashTable, 0, 0, "Start:", str.format("{0,date,long}", strategy.closedtrades.entry_time(0)) , bgcolor, color.white) // + str.format(" {0,time,HH:mm}", strategy.closedtrades.entry_time(0))
f_fillCell(dashTable, 0, 1, "End:", str.format("{0,date,long}", strategy.opentrades.entry_time(0)) , bgcolor, color.white) // + str.format(" {0,time,HH:mm}", strategy.opentrades.entry_time(0))
_profit = (strategy.netprofit / strategy.initial_capital) * 100
f_fillCell(dashTable, 0, 2, "Net Profit:", str.tostring(_profit, '##.##') + "%", _profit > 0 ? color.green : color.red, color.white)
_numOfDaysInStrategy = (strategy.opentrades.entry_time(0) - strategy.closedtrades.entry_time(0)) / (1000 * 3600 * 24)
f_fillCell(dashTable, 0, 3, "Percent Per Day", str.tostring(_profit / _numOfDaysInStrategy, '#########################.#####')+"%", _profit > 0 ? color.green : color.red, color.white)
_winRate = ( strategy.wintrades / strategy.closedtrades ) * 100
f_fillCell(dashTable, 0, 4, "Percent Profitable:", str.tostring(_winRate, '##.##') + "%", _winRate < 50 ? color.red : _winRate < 75 ? #999900 : color.green, color.white)
f_fillCell(dashTable, 0, 5, "Profit Factor:", str.tostring(strategy.grossprofit / strategy.grossloss, '##.###'), strategy.grossprofit > strategy.grossloss ? color.green : color.red, color.white)
f_fillCell(dashTable, 0, 6, "Total Trades:", str.tostring(strategy.closedtrades), bgcolor, color.white)
f_fillCell(dashTable, 0, 8, "Max Wins In A Row:", str.tostring(maxWinRow, '######') , bgcolor, color.white)
f_fillCell(dashTable, 0, 9, "Max Losses In A Row:", str.tostring(maxLossRow, '######') , bgcolor, color.white)