Chiến lược siêu xu hướng chồng chéo ba
Tổng quan
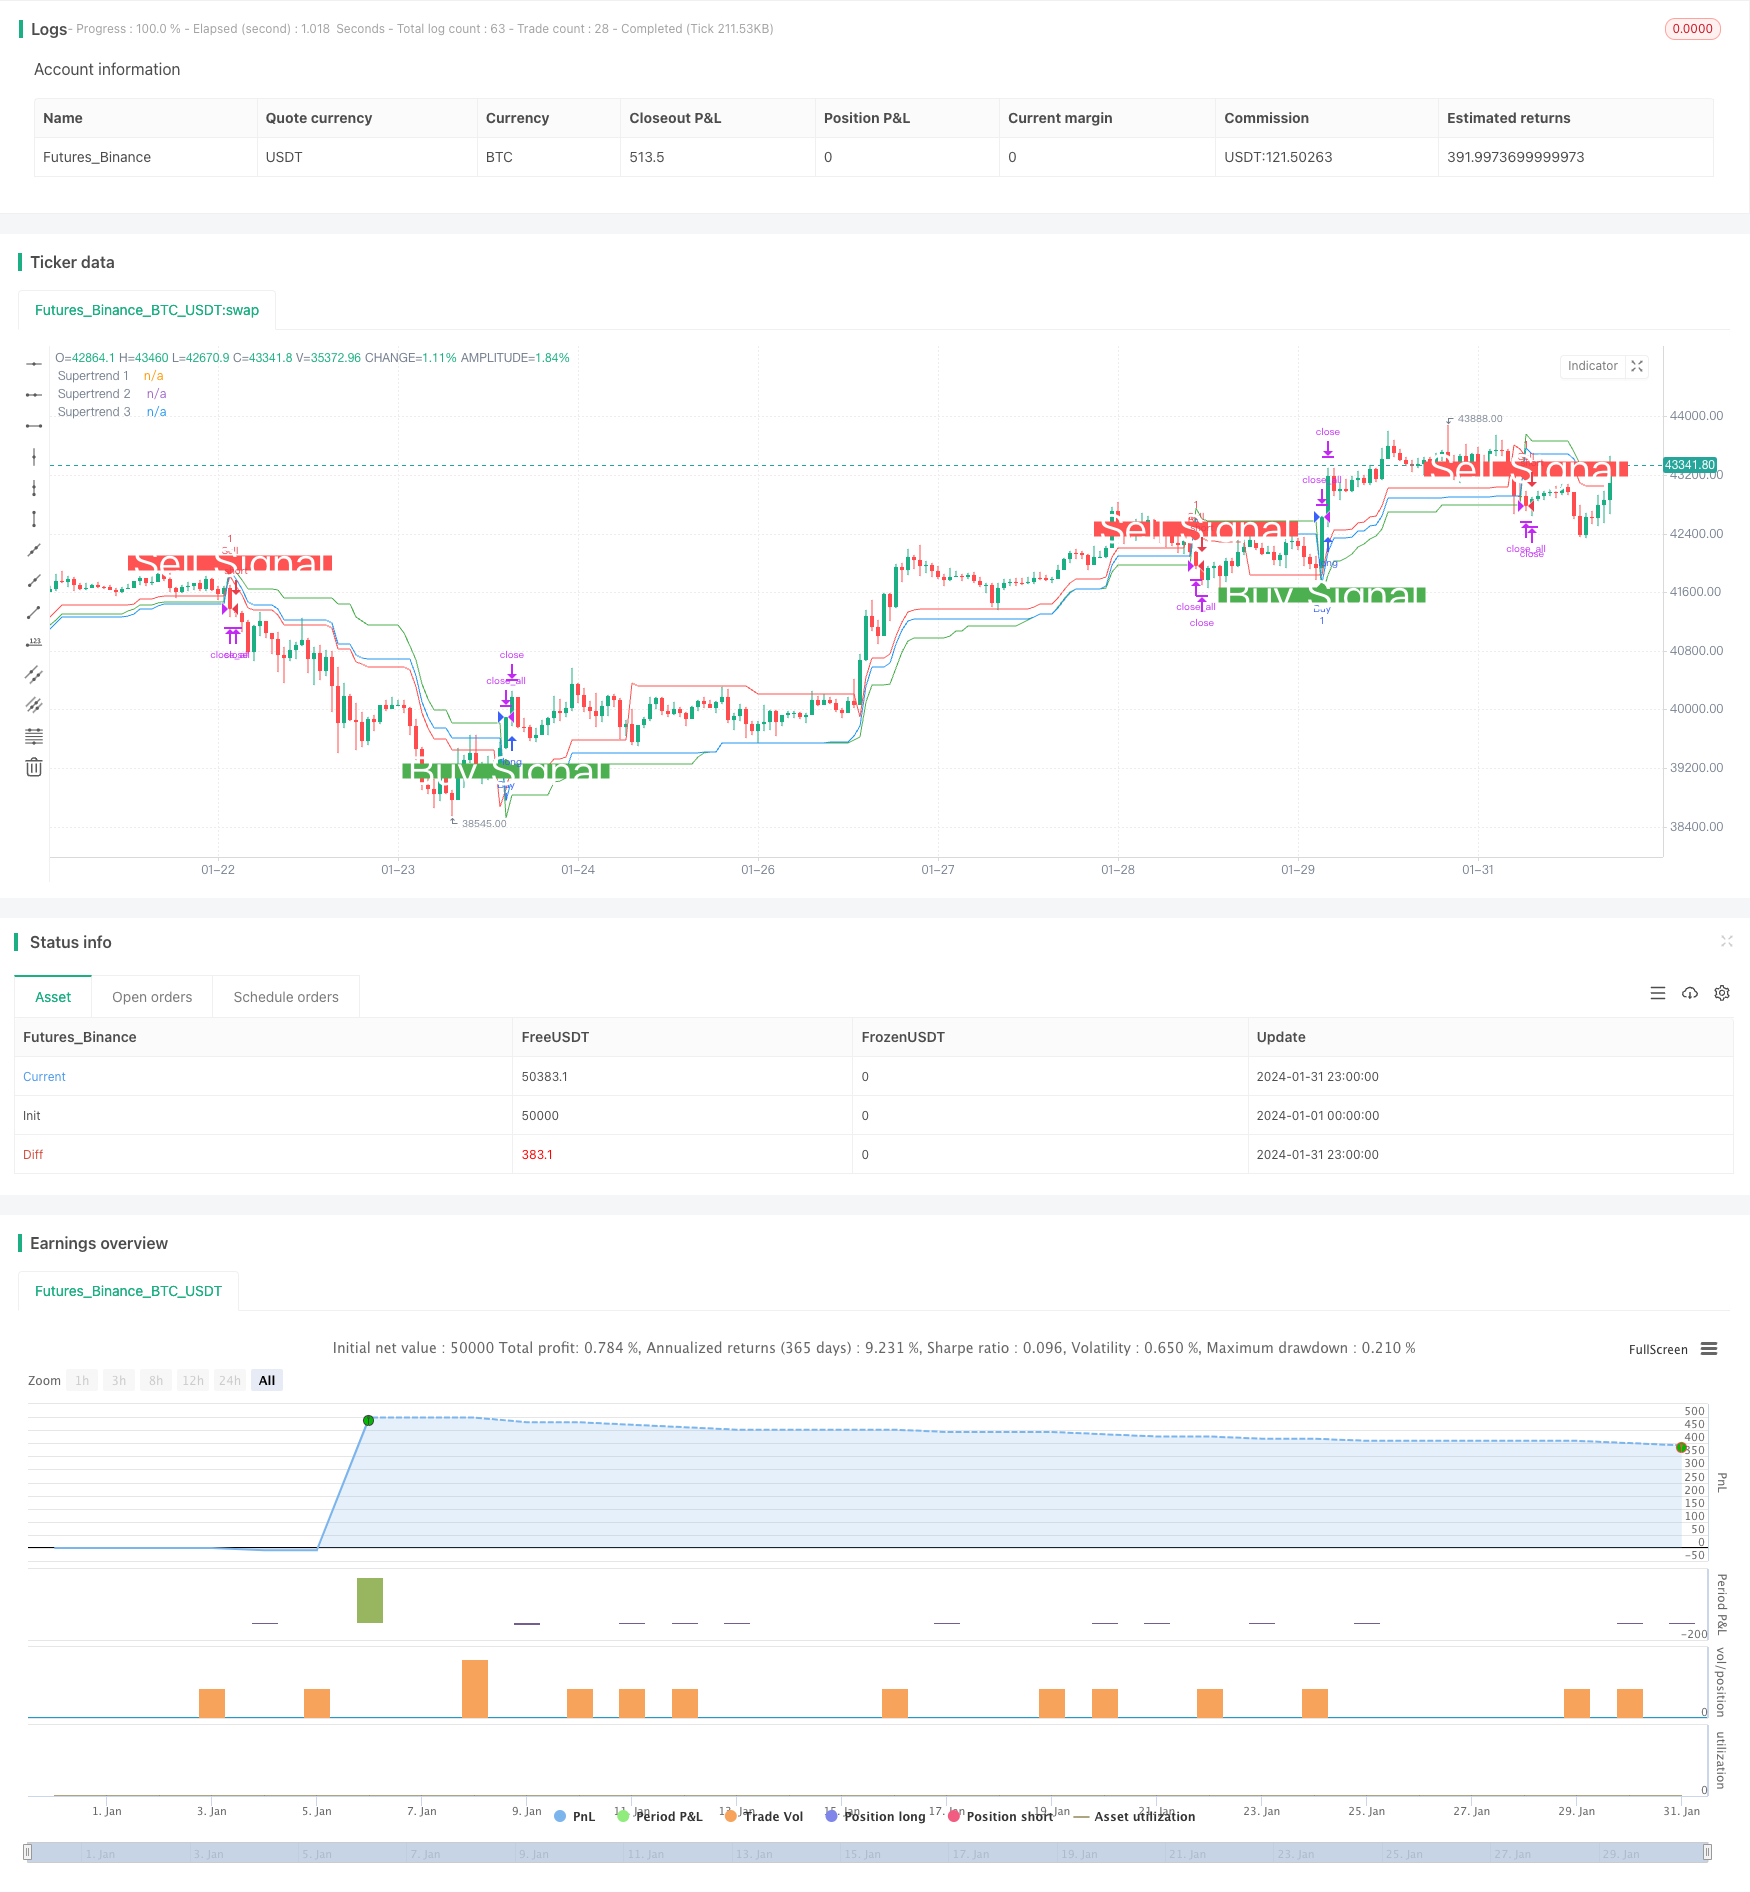
Đây là một chiến lược sử dụng ba chỉ số siêu xu hướng chồng lên nhau để đưa ra quyết định giao dịch. Nó có thể nắm bắt cơ hội định hướng lớn hơn trong một tình huống xu hướng.
Nguyên tắc chiến lược
Chiến lược này sử dụng hàm ta.supertrend() để tính toán các chỉ số siêu xu hướng với ba thiết lập tham số khác nhau. Các chỉ số siêu xu hướng được tính toán lần lượt là siêu xu hướng 3 lần ATR vào ngày 10, siêu xu hướng 1 lần ATR 2 lần ATR vào ngày 14, siêu xu hướng 2 lần ATR 2, và siêu xu hướng 3 lần ATR 2.5 lần ATR vào ngày 20.
Chỉ số siêu xu hướng kết hợp với chỉ số ATR, có thể theo dõi hiệu quả xu hướng thay đổi giá. Chiến lược supertrend ba lần chồng lên nhau, làm cho tín hiệu đáng tin cậy hơn, do đó thu được lợi nhuận lớn hơn trong tình huống xu hướng.
Lợi thế chiến lược
- Cơ chế lọc ba, tránh tín hiệu giả, cải thiện chất lượng tín hiệu
- Chỉ số siêu xu hướng tự nó có chức năng loại bỏ tiếng ồn tốt
- Có thể cấu hình nhiều kết hợp siêu tham số để phù hợp với môi trường thị trường rộng hơn
- Thử nghiệm lịch sử tốt, lợi nhuận có rủi ro cao
Rủi ro chiến lược
- Một số tín hiệu lọc đa có thể đã bỏ lỡ cơ hội
- Hành động trong cơn động đất không tốt
- Cần tối ưu hóa kết hợp của ba nhóm siêu tham số
- Thời gian giao dịch tập trung dễ bị ảnh hưởng bởi sự cố bất ngờ
Những điều sau đây có thể được xem xét để giảm nguy cơ:
- Điều chỉnh điều kiện lọc để giữ một hoặc hai siêu xu hướng
- Tăng chiến lược dừng lỗ
- Tối ưu hóa siêu tham số, tăng tỷ lệ thắng
Hướng tối ưu hóa chiến lược
- Kiểm tra thêm các kết hợp tham số để tìm siêu tham số tốt nhất
- Thêm thuật toán học máy, tham số tối ưu hóa thời gian thực
- Tăng chiến lược dừng lỗ, kiểm soát tổn thất đơn lẻ
- Kết hợp với các chỉ số khác để xác định xu hướng và biến động
- Mở rộng thời gian giao dịch, tránh rủi ro ở một thời điểm duy nhất
Tóm tắt
Chiến lược này có lợi thế như chất lượng tín hiệu cao, các tham số có thể được tối ưu hóa. Tuy nhiên, cũng có một số rủi ro, cần điều chỉnh các tham số và thời gian thoát để thích ứng với môi trường thị trường khác nhau. Nhìn chung, chiến lược này hoạt động nổi bật và đáng để nghiên cứu và áp dụng thêm.
/*backtest
start: 2024-01-01 00:00:00
end: 2024-01-31 23:59:59
period: 1h
basePeriod: 15m
exchanges: [{"eid":"Futures_Binance","currency":"BTC_USDT"}]
*/

//@version=5
strategy('Combined Supertrend Strategy - Ajit Prasad', overlay=true)

// Function to calculate Supertrend
supertrendFunc(atrLength, factor) =>
    [supertrend, direction] = ta.supertrend(factor, atrLength)
    [supertrend, direction]

// Input parameters for the first Supertrend
atrPeriod1 = input(10, 'ATR Length 1')
factor1 = input(3, 'Factor 1')

// Calculate the first Supertrend
[supertrend1, direction1] = supertrendFunc(atrPeriod1, factor1)

// Input parameters for the second Supertrend
atrPeriod2 = input(14, 'ATR Length 2') // Change values as needed
factor2 = input(2, 'Factor 2') // Change values as needed

// Calculate the second Supertrend
[supertrend2, direction2] = supertrendFunc(atrPeriod2, factor2)

// Input parameters for the third Supertrend
atrPeriod3 = input(20, 'ATR Length 3') // Change values as needed
factor3 = input(2.5, 'Factor 3') // Change values as needed

// Calculate the third Supertrend
[supertrend3, direction3] = supertrendFunc(atrPeriod3, factor3)

// Define market opening and closing times
marketOpenHour = 9
marketOpenMinute = 15
marketCloseHour = 15
marketCloseMinute = 30
exitTimeHour = 15
exitTimeMinute = 10

// Fetch historical close values using security function
histClose = request.security(syminfo.tickerid, "D", close)

// Buy condition
buyCondition = close > supertrend1 and close > supertrend2 and close > supertrend3 and close[1] <= supertrend1[1]

// Sell condition
sellCondition = close < supertrend1 and close < supertrend2 and close < supertrend3 and close[1] >= supertrend1[1]

// Exit conditions
buyExitCondition = close < supertrend1[1] or close < supertrend2[1] or close < supertrend3[1]
sellExitCondition = close > supertrend1[1] or close > supertrend2[1] or close > supertrend3[1]

// Execute orders with market timing
if true
    // Buy condition without 'and not'
    strategy.entry('Buy', strategy.long, when = buyCondition)

    // Sell condition without 'and not'
    strategy.entry('Sell', strategy.short, when = sellCondition)

    // Close conditions
    strategy.close('Buy', when = buyExitCondition )
    strategy.close('Sell', when = sellExitCondition)

// Close all trades at 3:10 pm IST
if true
    strategy.close_all()

// Plot Supertrends
plot(supertrend1, 'Supertrend 1', color=color.new(color.green, 0), style=plot.style_linebr)
plot(supertrend2, 'Supertrend 2', color=color.new(color.red, 0), style=plot.style_linebr)
plot(supertrend3, 'Supertrend 3', color=color.new(color.blue, 0), style=plot.style_linebr)

// Plot labels
plotshape(buyCondition, style=shape.labelup, location=location.belowbar, color=color.new(color.green, 0), size=size.large, text='Buy Signal', textcolor=color.new(color.white, 0))
plotshape(sellCondition, style=shape.labeldown, location=location.abovebar, color=color.new(color.red, 0), size=size.large, text='Sell Signal', textcolor=color.new(color.white, 0))