概述
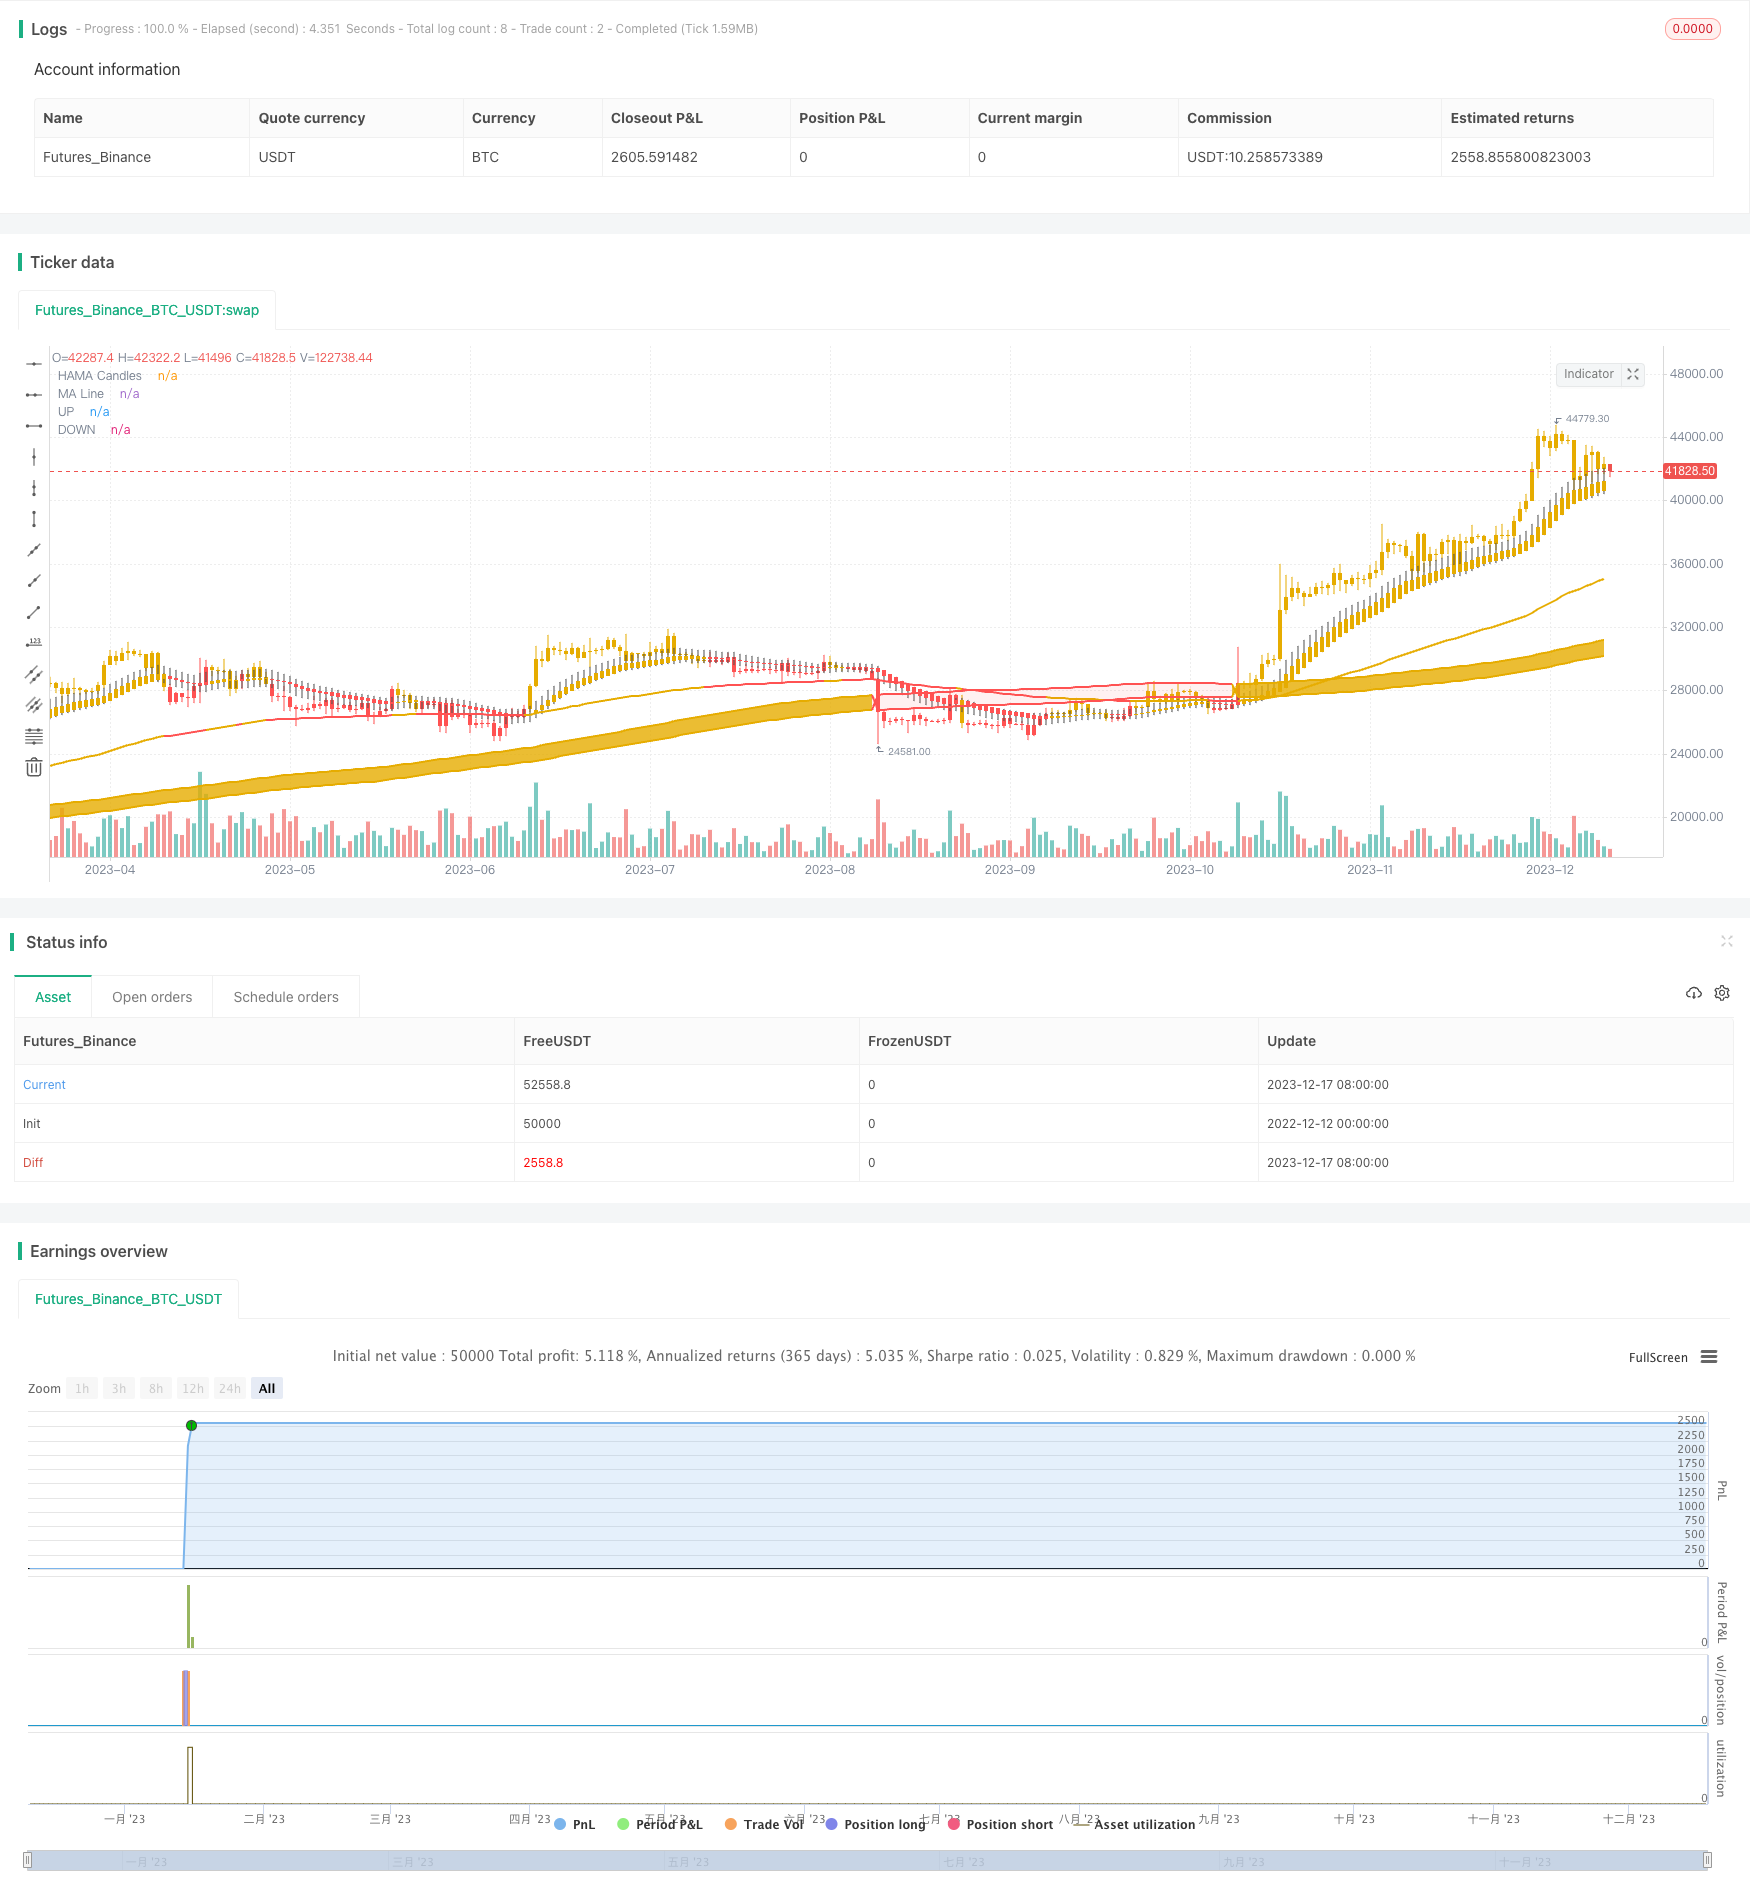
本策略名为“坚如磐石的VIP量化策略”,它融合了改进后威廉SMA指标(Modified WMA)和SSL通道指标(SSL Channel),构建了一个稳定可靠的量化交易框架。
原理
该策略结合了两个指标,一个是改进后的威廉SMA指标,通过计算每根K线的均价,然后应用指数移动平均方法来确定趋势方向。另一个是SSL通道指标,它采用最高价和最低价的移动平均线来确定价格通道,判断目前的趋势状态。
当改进后的威廉SMA指标发出买入信号,即金叉时,我们再结合SSL通道指标判断通道内价格是否合适,如果K线实体完全在通道下限之下时,我们就在该点进行买入开仓。
优势
- 通过结合两个指标,使买入信号更加可靠,避免假突破。
- 改进后的威廉SMA指标可以更准确判断趋势转换点。
- SSL通道指标可以清楚判断价格通道,避免高位买入。
- 采用指数移动平均方法,更有利于判断长期趋势。
风险及解决
- 如果遇到剧烈行情,止损点可能会被轻易触发。可以适当放宽止损范围。
- 移动平均线系统对短期市场噪音敏感,可能产生错误信号。可以适当加大均线参数,增强过滤效果。
- 参数设置不当也会影响策略表现。可以通过回测优化参数,找到最佳参数组合。
优化方向
- 可以测试不同类型的移动平均线,如EMA、VWMA等,寻找最匹配的均线指标。
- 可以加入成交量指标,避免在低量区域发出信号。
- 可以尝试不同的通道绘制方法,如Donchian通道等,使通道界限更加可靠。
- 可以加入其他辅助指标,如MACD、RSI等,进一步确认买入时机。
总结
本策略通过改进后的威廉SMA指标和SSL通道指标的巧妙结合,构建了一个稳定、可靠的量化交易框架。它过滤市场噪音的能力较强,同时也避免了高位买入的风险。如果参数设置得当,并加入一定的优化,它将是一个非常Outperforming的策略。
策略源码
/*backtest
start: 2022-12-12 00:00:00
end: 2023-12-18 00:00:00
period: 1d
basePeriod: 1h
exchanges: [{"eid":"Futures_Binance","currency":"BTC_USDT"}]
*/

// This source code is subject to the terms of the Mozilla Public License 2.0 at https://mozilla.org/MPL/2.0/
// © Darshana_Alwis

//@version=5
strategy("VIP", overlay=true, initial_capital=1000,currency=currency.USD,default_qty_type=strategy.percent_of_equity,default_qty_value=100,pyramiding=0)
//SSS = Sultan+Saud Strategy

//The original idea of the code belonges to saudALThaidy
//The strategy code is basically made out of two other indicators, edited and combined by me.
// 1- NSDT HAMA Candles => https://www.tradingview.com/script/k7nrF2oI-NSDT-HAMA-Candles/
// 2- SSL Channel => https://www.tradingview.com/script/6y9SkpnV-SSL-Channel/


//MA INFO
WickColor = input.color(color.rgb(80, 80, 80, 100), title='Wick Color', tooltip='Suggest Full Transparency.')
LengthMA = input.int(100, minval=1, title='MA Line Length', inline='MA Info')
TakeProfit = input.float(1, minval=0, title='Take Profit Percentage', step=1)
UseStopLose = input.bool(false, title='Use Stop Percentage')
StopLose = input.float(1, minval=0, title='StopLose Percentage', step=1)

MASource = close

ma(source, length, type) =>
    type == "SMA" ? ta.sma(source, length) :
     type == "EMA" ? ta.ema(source, length) :
     type == "SMMA (RMA)" ? ta.rma(source, length) :
     type == "WMA" ? ta.wma(source, length) :
     type == "VWMA" ? ta.vwma(source, length) :
     na

ma1_color  = color.rgb(230, 172, 0)
ma1 = ma(high, 200, "SMA")

ma2_color  = color.red
ma2 = ma(low, 200, "SMA")

Hlv1 = float(na)
Hlv1 := close > ma1 ? 1 : close < ma2 ? -1 : Hlv1[1]
sslUp1   = Hlv1 < 0 ? ma2 : ma1
sslDown1 = Hlv1 < 0 ? ma1 : ma2

Color1 = Hlv1 == 1 ? ma1_color : ma2_color
fillColor1 = color.new(Color1, 90)

highLine1 = plot(sslUp1, title="UP", linewidth=2, color = Color1)
lowLine1 = plot(sslDown1, title="DOWN", linewidth=2, color = Color1)

OpenLength = 25
HighLength = 20
LowLength = 20
CloseLength = 20


SourceOpen = (open[1] + close[1]) / 2
SourceHigh = math.max(high, close)
SourceLow = math.min(low, close)
SourceClose = (open + high + low + close) / 4

funcCalcMA1(src1, len1) => ta.ema(src1, len1)
funcCalcOpen(SourceOpen, OpenLength) => ta.ema(SourceOpen, OpenLength)
funcCalcHigh(SourceHigh, HighLength) => ta.ema(SourceHigh, HighLength)
funcCalcLow(SourceLow, LowLength) => ta.ema(SourceLow, LowLength)
funcCalcClose(SourceClose, CloseLength) => ta.ema(SourceClose, CloseLength)

MA_1 = funcCalcMA1(MASource, LengthMA)

CandleOpen = funcCalcOpen(SourceOpen, OpenLength)
CandleHigh = funcCalcHigh(SourceHigh, HighLength)
CandleLow = funcCalcLow(SourceLow, LowLength)
CandleClose = funcCalcClose(SourceClose, CloseLength)

//PLOT CANDLES
//-------------------------------NSDT HAMA Candels
BodyColor = CandleOpen > CandleOpen[1] ? color.rgb(230, 172, 0) : color.red
barcolor(BodyColor)
plotcandle(CandleOpen, CandleHigh, CandleLow, CandleClose, color=BodyColor, title='HAMA Candles', wickcolor=WickColor, bordercolor=na)
plot(MA_1, title='MA Line', color=BodyColor, style=plot.style_line, linewidth=2)

//------------------------------SSL Channel


plot_buy = false
avg = ((high-low)/2)+low
LongCondition = (Hlv1 == 1 and Hlv1[1] == -1) and (BodyColor == color.rgb(230, 172, 0)) and (MA_1 < avg) and (CandleHigh < avg) and (strategy.opentrades == 0)
if LongCondition
    strategy.entry("BUY with VIP", strategy.long)
    plot_buy := true

base = strategy.opentrades.entry_price(0)
baseProfit = (base+((base/100)*TakeProfit))
baseLose = (base-((base/100)*StopLose))

strategy.exit("SELL with VIP","BUY with VIP",limit = baseProfit)
if UseStopLose and (close < MA_1)
    strategy.exit("SELL with VIP","BUY with VIP",stop = baseLose)
if not UseStopLose and (close < MA_1)
    strategy.exit("SELL with VIP","BUY with VIP", stop = close)

plotshape(plot_buy, title="Buy Label", text="Buy", location=location.belowbar, style=shape.labelup, size=size.tiny, color=Color1, textcolor=color.white)

fill(highLine1, lowLine1, color = fillColor1)