RSI - Kauf-Verkaufssignale
Schriftsteller:ChaoZhang, Datum: 2022-05-09 14:35:23Tags:RSI
Dieser Indikator basiert hauptsächlich auf Überkauf und Überverkauf. Indikator für den kurzfristigen Handel. Auf diese Weise können Sie kleine, aber akzeptable Signale erhalten. Die Hauptgrundlage des Indikators ist wie folgt: Um zu kaufen, wartet der Indikator darauf, dass das Instrument vom Standpunkt des RSI überverkauft wird. Wenn dann das Chart die Unterlinie des Envelope-Indikators von unten nach oben überquert, wird ein Kaufsignal ausgegeben. Für den Verkauf wartet der Indikator, bis das Instrument aus der Perspektive des RSI überkauft ist. Wenn dann das Chart die oberste Linie des Envelope-Indikators von oben nach unten überquert, wird ein Verkaufssignal ausgegeben. Die allgemeine Grundlage ist die Übereinstimmung des Preises und des RSI-Indikators. Die besten Einstellungen habe ich mir selbst ausgedacht: Zeit: 15 Minuten Überkauft: 80 Überverkauf: 25 RSI Länge: 8 Es kann auf verschiedenen Instrumenten durchgeführt werden, aber immer Ihre Gewinn- und Verlustgrenzen festlegen. (Die Gewinn-Verlust-Ratio in diesem Indikator kann 1:1 betragen.)
Haftungsausschluss: Diese Informationen sowie die hier angegebenen Handelsindikatoren und -instrumente sind weder als Angebot noch als Aufforderung zu einem Angebot zum Kauf oder Verkauf von Wertpapieren zu verstehen. Ich übernehme keine Haftung für Gewinn, finanzielle Verbesserung, Verluste oder Schäden, monetär oder anderweitig, die sich aus der Anwendung der in diesem Indikator enthaltenen Informationen ergeben können. Einzelne Händler müssen ihre eigene Sorgfaltspflicht bei der Analyse der vorgestellten Handelsindikatoren, anderer Handelswerkzeuge, Webinare und anderer Bildungsmaterialien anwenden, um festzustellen, ob sie für den einzelnen Händler geeignete und nutzbare Funktionen und Fähigkeiten darstellen.
Zurückprüfung
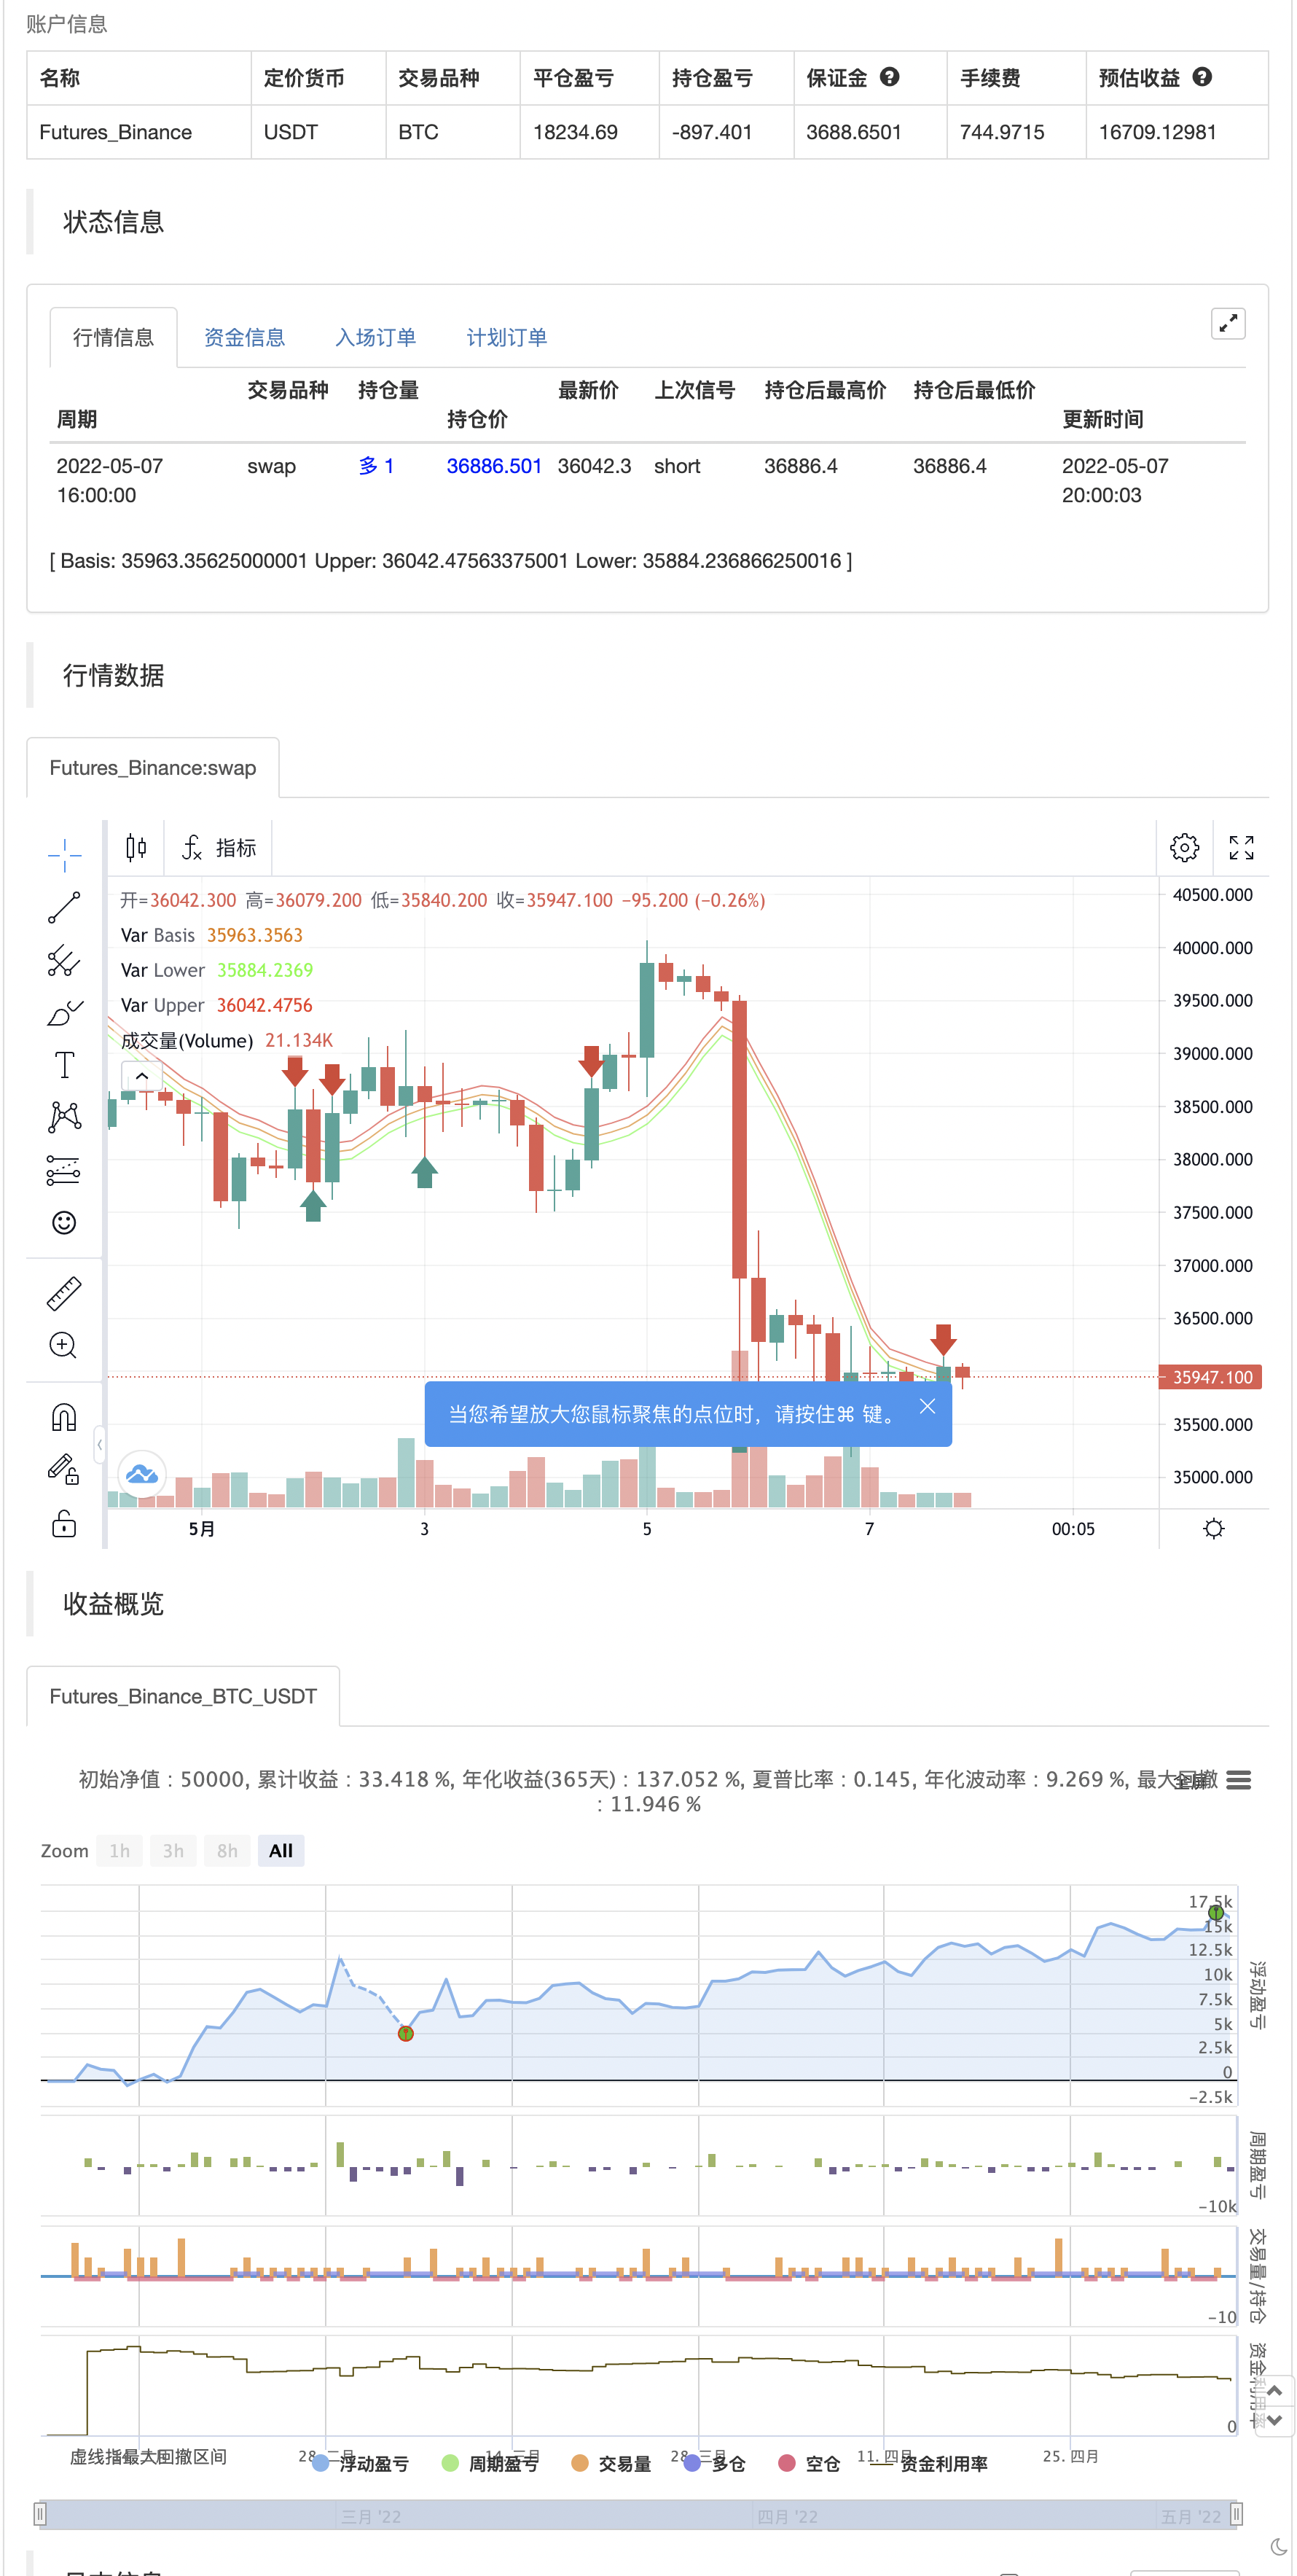
/*backtest
start: 2022-02-08 00:00:00
end: 2022-05-08 00:00:00
period: 4h
basePeriod: 15m
exchanges: [{"eid":"Futures_Binance","currency":"BTC_USDT"}]
*/

// This source code is subject to the terms of the Mozilla Public License 2.0 at https://mozilla.org/MPL/2.0/
// © Saleh_Toodarvari

//@version=5
indicator(title="ENVELOPE - RSI - Buy Sell Signals", shorttitle="ENVELOPE - RSI", overlay=true)
//_________________Envelope_________________
len = input.int(8, title="Envelope Length", minval=1, group="Envelope Settings")
percent = input(0.22,title="Envelope Percent", group="Envelope Settings")
src = input(hl2, title="Envelope Source", group="Envelope Settings")
exponential = input(false)
basis = exponential ? ta.ema(src, len) : ta.sma(src, len)
k = percent/100.0
upper = basis * (1 + k)
lower = basis * (1 - k)
plot(basis, "Basis", color=#ED7300)
u = plot(upper, "Upper", color=#FF2424)
l = plot(lower, "Lower", color=#24FF24)
//fill(u, l, color=color.rgb(33, 150, 243, 95), title="Background")
cross_buy=ta.crossover(close,lower)
cross_sell=ta.crossunder(close,upper)
// _________________RSI_________________
rsiLengthInput = input.int(8, minval=1, title="RSI Length", group="RSI Settings")
rsiSourceInput = input.source(hl2, "RSI Source", group="RSI Settings")
up = ta.rma(math.max(ta.change(rsiSourceInput), 0), rsiLengthInput)
down = ta.rma(-math.min(ta.change(rsiSourceInput), 0), rsiLengthInput)
rsi = down == 0 ? 100 : up == 0 ? 0 : 100 - (100 / (1 + up / down))
Overbought_RSI = input(title="RSI OverBought Limit(Recommended: 70-85)", defval=80, group="RSI Settings")
Oversold_RSI = input(title="RSI OverSold Limit(Recommended: 20-30)", defval=25, group="RSI Settings")
condition_buy= rsi<Oversold_RSI and (ta.cross(low,lower) or ta.cross(close,lower) or ta.cross(high,lower) or ta.cross(open,lower))
condition_sell= rsi>Overbought_RSI and (ta.cross(low,upper) or ta.cross(close,upper) or ta.cross(high,upper) or ta.cross(open,upper))
if cross_sell
    strategy.entry("Enter Long", strategy.long)
else if cross_buy
    strategy.entry("Enter Short", strategy.short)

// plotshape(cross_sell ? condition_sell:na, title="Sell Label", text="Sell", location=location.abovebar, style=shape.labeldown, size=size.tiny, color=color.red, textcolor=color.white)
// sell_sig=plot(cross_sell ? high:na,color=color.new(#000000,100))
// plotshape(cross_buy ? condition_buy:na, title="Buy Label", text="Buy", location=location.belowbar, style=shape.labelup, size=size.tiny, color=color.green, textcolor=color.white)
// buy_sig=plot(cross_buy ? ohlc4:na,color=color.new(#000000,100))
// tpColor = if(cross_sell[1] or cross_sell[2] or cross_buy[1] or cross_buy[2])
//     color.new(#1DBC60, 30)
// else
//     color.new(#000000,100)
// slColor = if(cross_sell[1] or cross_sell[2] or cross_buy[1] or cross_buy[2])
//     color.new(#F74A58, 30)
// else
//     color.new(#000000,100)
// //_________________TP&SL_________________
// TP_Percent = input.float(0.15, "TP %")
// SL_Percent = input.float(0.15, "SL %")
// tp= if condition_sell
//     ohlc4-ohlc4*(TP_Percent/100)
// else if condition_buy
//     ohlc4+ohlc4*(TP_Percent/100)
// sl= if condition_sell
//     ohlc4+ohlc4*(SL_Percent/100)
// else if condition_buy
//     ohlc4-ohlc4*(SL_Percent/100)
// tp_sig=plot(tp,color=color.new(#000000,100),title="tp")
// sl_sig=plot(sl,color=color.new(#000000,100),title="tp")
// lower_plot=plot(lower,color=color.new(#000000,100))
// fill(sell_sig,tp_sig, color=tpColor)
// fill(buy_sig,tp_sig, color=tpColor)
// fill(buy_sig,sl_sig, color=slColor)
// fill(sell_sig,sl_sig, color=slColor)
- MACD RSI Ichimoku Momentum Trend nach langfristiger Strategie
- RSI-Richtungsänderungsstrategie
- Erweiterte Bollinger Bands RSI-Handelsstrategie
- Pivot- und Dynamikstrategie
- Umfassende Handelsstrategie für gleitende Durchschnitte und RSI
- Strategie zur Umstellung am Dienstag (Wochenendfilter)
- Erweiterte EMA-Crossover-Strategie mit RSI/MACD/ATR
- Kombination von MACD und RSI für die langfristige Handelsstrategie
- RSI2-Strategie Intraday-Umkehrung Gewinnrate Rücktest
- Mehrindikatortrend nach Strategie
- AlphaTradingBot Handelsstrategie
- Midas Mk. II - Der ultimative Krypto-Swing
- TMA-Legacy
- TV-Hoch-Niedrig-Strategien
- Beste TradingView-Strategie
- Der Wert des Wertpapiers ist der Wert des Wertpapiers, der für den Wertpapiermarkt verwendet wird.
- Chande Kroll Stopp
- CCI + EMA mit RSI-Kreuzstrategie
- EMA-Bänder + leledc + Bollinger-Bänder Trend-Catching-Strategie
- RSI MTF Ob+Os
- MACD-Willystrategie
- Heikin-Aschi-Trend
- HA Marktverzerrung
- Ichimoku Wolken glatter Oszillator
- Williams %R - Glättet
- QQE MOD + SSL Hybrid + Waddah Attar Explosion
- Kauf/Verkauf von Strat
- Triple Supertrend mit EMA und ADX
- Tom DeMark Sequentielle Wärmekarte
- jma + dwma für Mehrkornprodukte
- MACD-Wert