Flying Dragon Trend-Strategie

Überblick
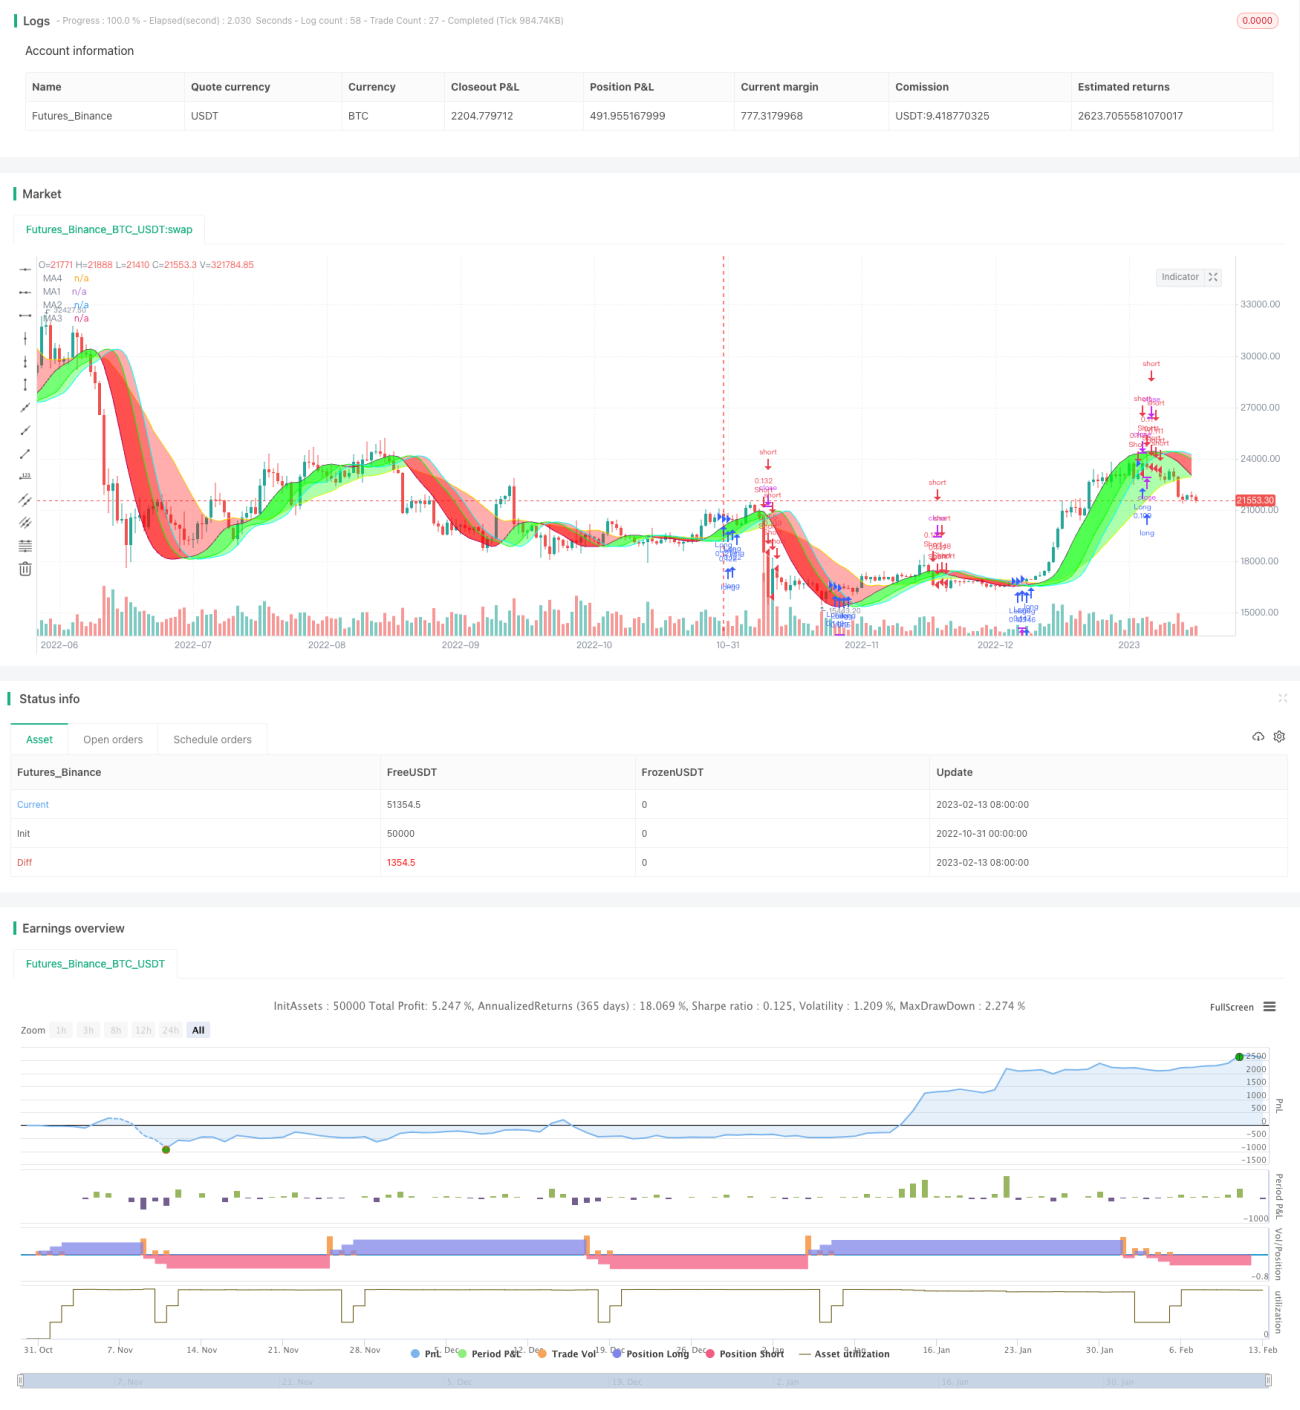
Die Pfeiffer-Trend-Strategie ermöglicht die Trend-Bestimmung und die Erzeugung von Handelssignalen durch Anpassung der Art, Länge und Verschiebung des beweglichen Durchschnitts, die Abbildung von Trendbändern in verschiedenen Farben. Die Strategie findet die optimale Kombination von Parametern in verschiedenen Zeiträumen und erzielt eine Balance zwischen der Genauigkeit der Trend-Bestimmung und dem Handelsrisiko.
Strategieprinzip
Die Strategie verwendet zwei Moving Averages, um Trendbänder zu zeichnen, die als MA1 und MA4 bezeichnet werden. MA1 ist ein schneller Moving Average, MA4 ein langsamer Moving Average.
Der Benutzer kann 5 Risikogruppen auswählen, die unter verschiedenen Risikogruppen handeln, um ein Handelssignal zu erzeugen, das verschiedene Moving Averages durchquert, wobei das Risiko von hoch bis niedrig in der Reihenfolge: MA1 Offset1, MA2, MA3, MA4 ist. Die Farbe der Trendbänder zeigt die aktuelle Trendrichtung an.
Darüber hinaus erlaubt die Strategie den Einsatz von Stop-Loss und die Auswahl von Long-, Short- oder Zwei-Wege-Trades.
Analyse der Stärken
- Die optimale Kombination von Parametern für unterschiedliche Zeitspannen und für eine breitere Palette von Marktumgebungen zu finden
- Eine Vielzahl von Moving Average-Typen zur Auswahl, die für verschiedene Sorten optimiert werden können
- Die Adjustable Divergence ist das Herzstück der Strategie und ermöglicht eine genauere Trendbeurteilung.
- Optionale Risikogruppen, die eine Balance zwischen Risiko und Ertrag herstellen
- Mehrfache Parameter können flexibel kombiniert werden und bieten mehr Optimierungsmöglichkeiten
- Intuitive Trendbänder, die ein klares visuelles Handelssignal bilden
- Unterstützt Schadensbegrenzung, um Risiken zu kontrollieren
Risikoanalyse
- Bei einem hohen Risikograd kann es zu Fehlsignalen kommen. Der Risikograd sollte gesenkt oder die Parameter angepasst werden.
- Wenn sich der Trend umkehrt, besteht die Gefahr, dass ein Verlust aus dem Spiel ausbleibt.
- Verschiedene Sorten benötigen unterschiedliche Parameter zum Testen und Optimieren, nicht alle können dieselben Parameter anwenden.
- Bei Hochfrequenz-Trading ist eine Anpassung an einen schnellen Moving Average erforderlich, um einen langsamen Moving Average zu führen.
- Unzureichende Parameteroptimierung kann zu einer Überempfindlichkeit oder Langsamkeit führen, die mehrfach getestet werden muss
Risiken können kontrolliert und verringert werden, indem die Risikogruppen schrittweise herabgestuft werden, Kombinationsprüfungen mit Parametern erweitert und die Parameter für verschiedene Sorten optimiert werden.
Optimierungsrichtung
- Versuche verschiedene Arten von Moving Average Kombinationen
- Testen Sie mehr Längenparameter, um die optimale Länge zu finden
- Das ist der Schlüssel zur Optimierung.
- Optimierungsparameter nach verschiedenen Sorten
- Optimierung der Stop-Loss-Punkte und Überlegung, ob ein Stop-Loss erforderlich ist
- Versuchen Sie mit einer anderen Kombination von Regeln
- Beurteilung der Notwendigkeit einer Optimierung des Filters
- Erwägen Sie die Einbeziehung von Trendstärkenindikatoren als Hilfsmittel
Zusammenfassen
Die Pfizer-Trendstrategie entwirft ein visuelles Trendhandelssystem durch eine geschickte Kombination von Moving Averages. Die Strategie ist flexibel und kann für verschiedene Sorten und Marktumgebungen optimiert werden.
- 1