Trendfolgestrategien basierend auf mehreren Indikatoren
Überblick
Diese Strategie wird alsMehrindikator-Kombinationen für Trend-Tracking-StrategieDie Multi-Indicator Trend Tracking Strategy (MTI) nutzt mehrere Indikatoren, wie den Fisher-Transformator, den gewichteten Moving Average (WMA), den relativ starken Index (RSI) und die Durchschnittslinie (OBV), um die Richtung des Markttrends zu bestimmen und Trend-Tracking-Handel zu realisieren.
Strategieprinzip
- Der Fisher-Transformation-Indikator beurteilt die Tendenz und Stärke der Preisänderung. Es gibt ein Handelssignal, wenn vier Fisher-Linien gleichzeitig ihre Farbe ändern.
- Die WMA entscheidet über die Richtung der großen Trends. Der RSI filtert falsche Signale.
- Der OBV-Indikator wird verwendet, um Trends zu bestätigen.
Insbesondere enthält der Fisher-Transformations-Indikator vier Linien mit einer Doppel-, Doppel-, Vier- und Achtfachen. Wenn die vier Linien gleichzeitig aufwärts grün sind, erzeugt dies ein Mehr-Signal, und wenn die vier Linien gleichzeitig aufwärts rot sind, erzeugt dies ein Fehlsignal.
Analyse der Stärken
Diese Strategie hat folgende Vorteile:
- Der Fisher-Conversion-Indikator hat eine starke Beurteilungskraft, wenn 4 Fisher-Linien gleichzeitig ihre Farbe ändern, um sicherzustellen, dass eine Trendwende möglich ist.
- Die WMA beurteilt die wichtigsten Trends und vermeidet einen Abwärtstrend.
- Der OBV-Indikator bestätigt Trends und verhindert falsche Durchbrüche im Trendless-Markt.
- Der RSI filtert falsche Signale und stellt sicher, dass die Signale zuverlässig sind.
Durch die Kombination von mehreren Indikatoren, die sowohl die Genauigkeit und Zuverlässigkeit der Handelssignale gewährleisten als auch die Fähigkeit, Trends zu verfolgen, können bessere Strategieeffekte erzielt werden.
Risikoanalyse
Es gibt einige Risiken bei dieser Strategie:
- Wenn sich der Markt ausbildet, kann die Fisher-Linie leicht zu Falschsignalen führen. In diesem Fall ist der RSI-Filter erforderlich.
- Die falsche Einstellung der WMA-Parameter beeinträchtigt auch die Beurteilung der Genauigkeit.
- Der Fisher-Conversion-Indikator ist schlechter im Überschnellverfahren.
- Wenn die Leitung unterbrochen wird, kann die Strategie zu großen Verlusten führen.
Um das Risiko zu verringern, können die RSI-Parameter angepasst und die WMA-Zyklusparameter optimiert werden. Gleichzeitig kann ein Stop-Loss-Punkt gesetzt werden, um übermäßige Verluste zu vermeiden.
Optimierungsrichtung
Die Strategie kann in folgenden Bereichen weiter optimiert werden:
- Strategieeffekte unter verschiedenen Periodiparametern können getestet werden, um die optimale Kombination von Parametern zu finden.
- Die Einführung eines Stop-Loss-Mechanismus. Der Stop-Loss erfolgt, wenn ein bestimmter Prozentsatz des Verlustes erreicht wird.
- Die Parameter des Fisher-Transformations-Indikators werden anhand der Rückmessungen weiter angepasst, um die richtige Kombination von Parametern zu finden, die den Indikator am besten beurteilen.
- Versuchen Sie, andere Kennzahlen zu filtern, z. B. Schwachstellen, Bias usw.
- Verschiedene Positionsgrößen werden getestet.
Zusammenfassen
Diese Strategie verwendet die Fisher-Wechsel-, WMA-, OBV- und RSI-Indikatoren, um die Richtung des Markttrends zu bestimmen. Die Signalpräzision und die Bestätigungsfähigkeit sind hoch und die Trends können effektiv profitieren. Durch die Optimierung der Parameter kann der Profit-Faktor der Strategie weiter verbessert werden.
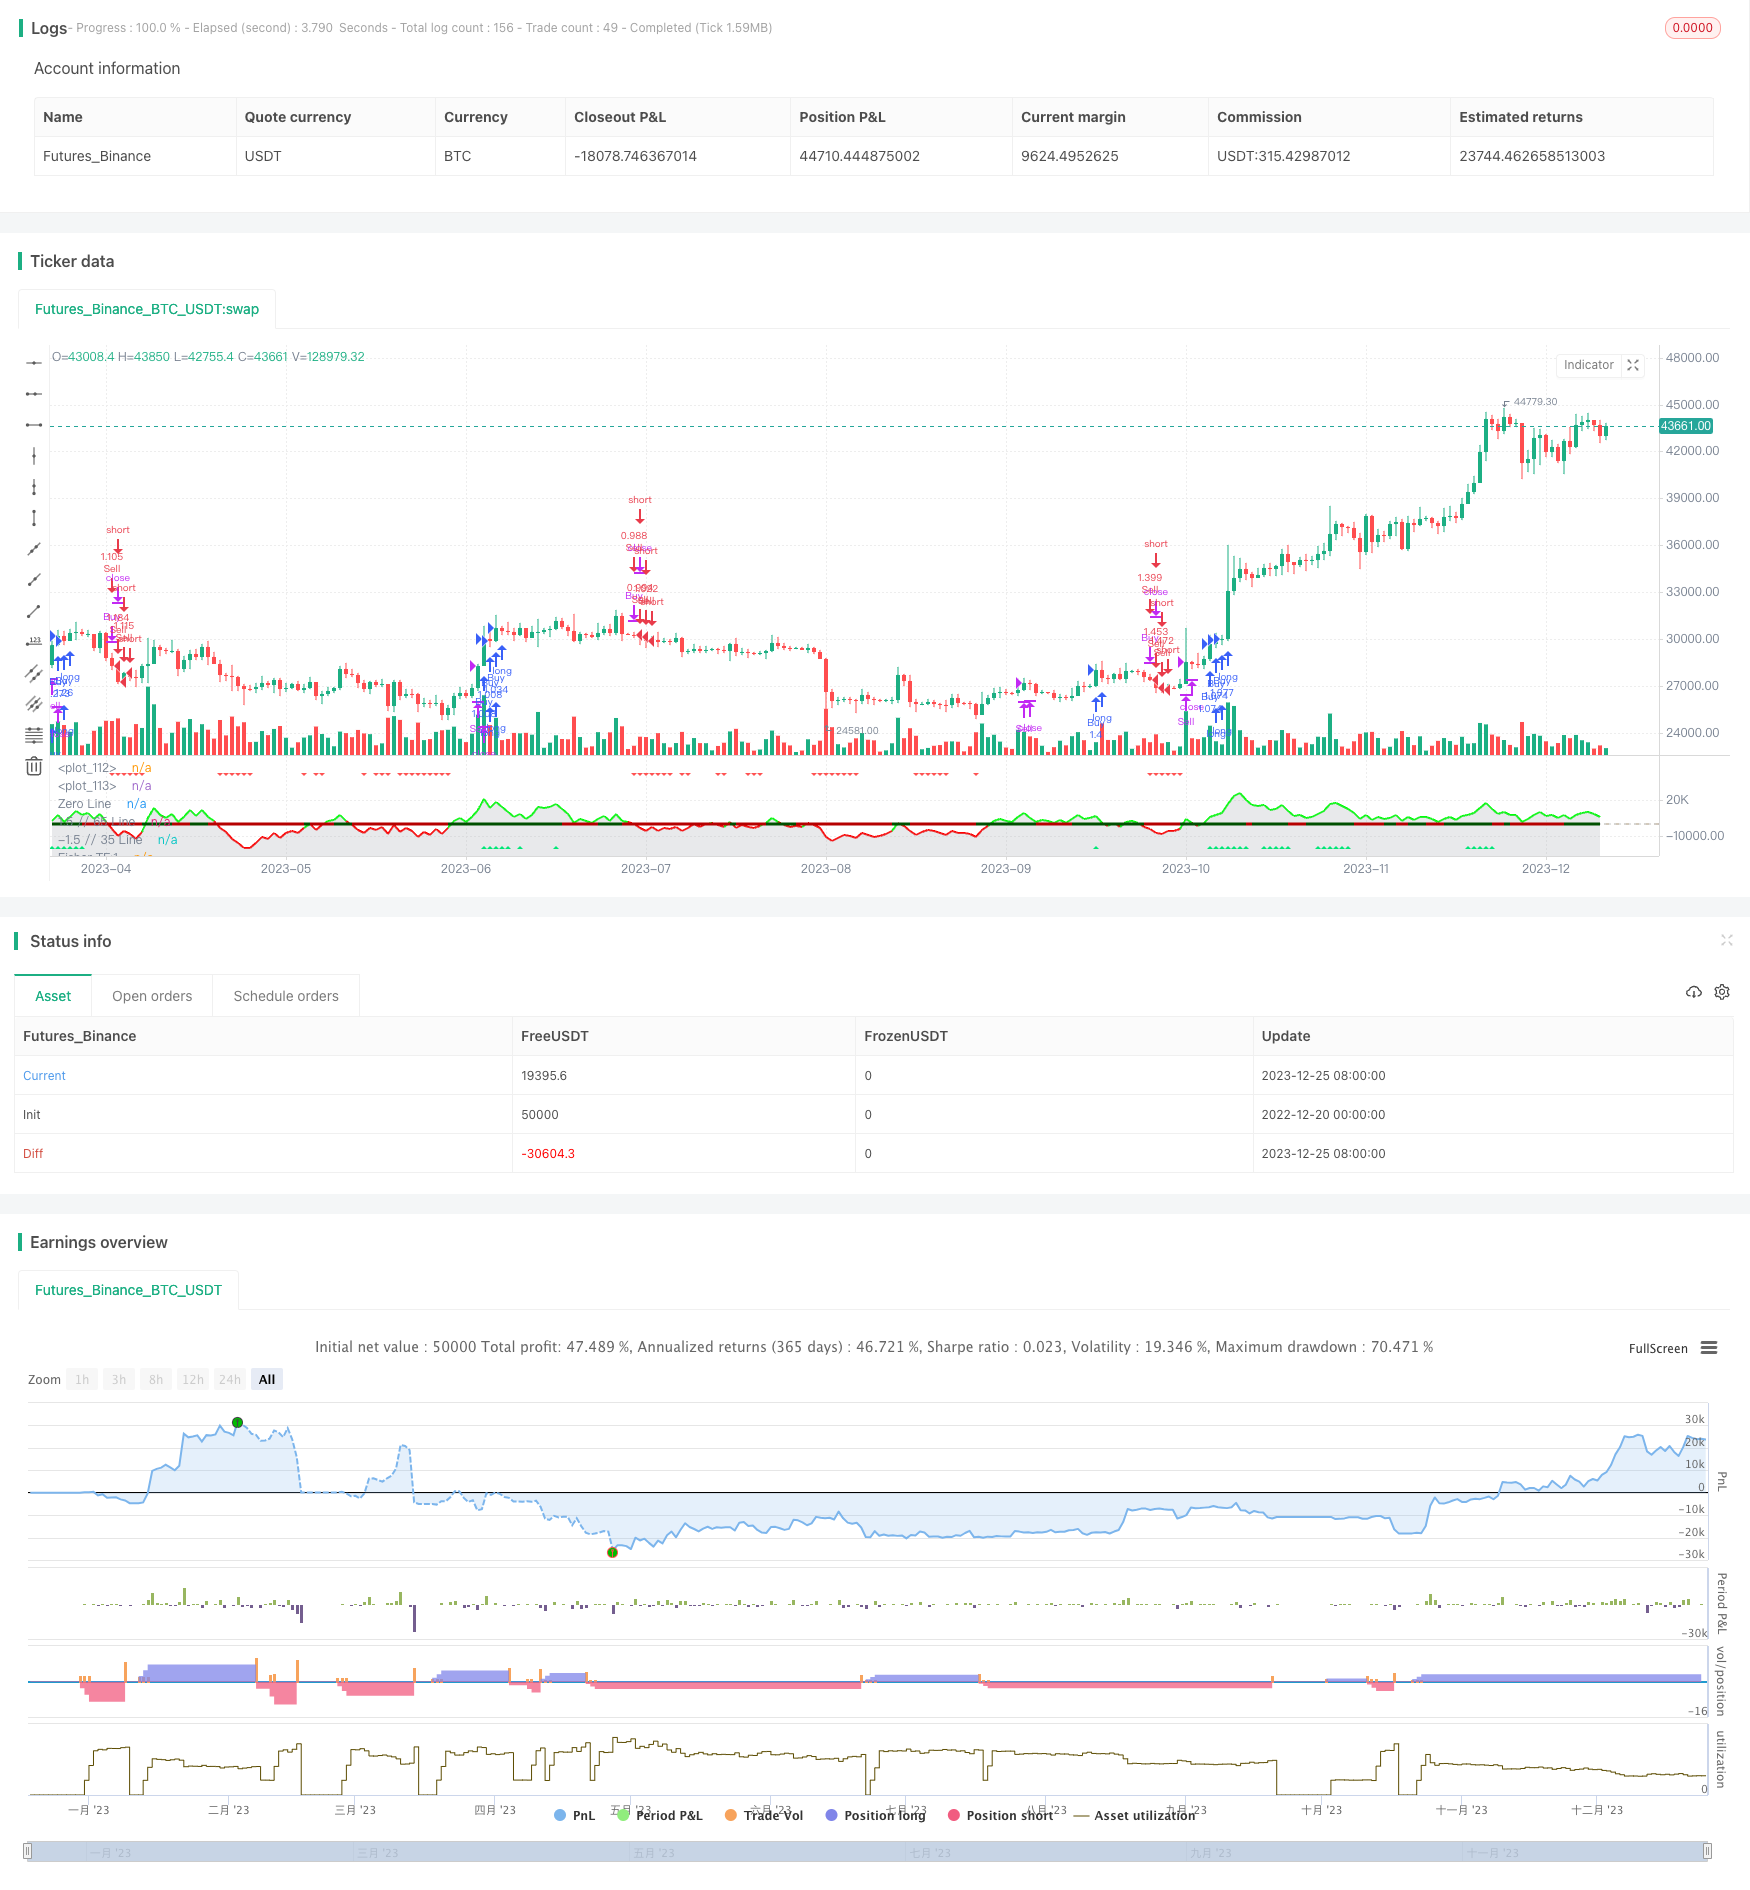
/*backtest
start: 2022-12-20 00:00:00
end: 2023-12-26 00:00:00
period: 1d
basePeriod: 1h
exchanges: [{"eid":"Futures_Binance","currency":"BTC_USDT"}]
*/

//@version=5
//author Sdover0123
strategy(title='FTR, WMA, OBV & RSI Strat', shorttitle='FTR WMA, OBV, RSI',overlay=false, default_qty_type=strategy.percent_of_equity, initial_capital = 100, default_qty_value=100, commission_value = 0.06, pyramiding = 3)
Len = input.int(10, minval=1, group ="Fisher Transform")
mult1 = input.int(1, minval=1, group ="Fisher Transform")
mult2 = input.int(2, minval=1, group ="Fisher Transform")
mult3 = input.int(4, minval=1, group ="Fisher Transform")
mult4 = input.int(8, minval=1, group ="Fisher Transform")
fish(Length, timeMultiplier) =>
    var nValue1 = 0.0
    var nValue2 = 0.0
    var nFish = 0.0
    xHL2 = hl2
    xMaxH = ta.highest(xHL2, Length * timeMultiplier)
    xMinL = ta.lowest(xHL2, Length * timeMultiplier)
    nValue1 := 0.33 * 2 * ((xHL2 - xMinL) / (xMaxH - xMinL) - 0.5) + 0.67 * nz(nValue1[1])
    if nValue1 > .99
        nValue2 := .999
        nValue2
    else if nValue1 < -.99
        nValue2 := -.999
        nValue2
    else
        nValue2 := nValue1
        nValue2
    nFish := 0.5 * math.log((1 + nValue2) / (1 - nValue2)) + 0.5 * nz(nFish[1])
    nFish
Fisher1 = fish(Len, mult1)
Fisher2 = fish(Len, mult2)
Fisher4 = fish(Len, mult3)
Fisher8 = fish(Len, mult4)

rsiLength = input.int(14, minval=1, group ="Moving Averages")
rsiVal = (ta.rsi(close, rsiLength) - 50) / 10
avg = strategy.position_avg_price

wma(source, length) =>
    sum = 0.0
    for i = 0 to length - 1
        sum := sum + source[i] * (length - i)
    wma = sum / (length * (length + 1) / 2)
    wma

wmaLength = input.int(10, "WMA Length", minval=1, group ="Moving Averages")
wmaClose = wma(close, wmaLength)
// Determine if WMA is bullish or bearish
isWmaBullish = wmaClose > wmaClose[1]
isWmaBearish = wmaClose < wmaClose[1]

//OBV
src = close
length = input.int(20, title="OBV Length", group="On-Balance Volume")
obv1(src) =>
    change_1 = ta.change(src)
    ta.cum(ta.change(src) > 0 ? volume : change_1 < 0 ? -volume : 0 * volume)*0.01
os = obv1(src)
obv_osc = os - ta.ema(os, length)
obc_color = (obv_osc > 0 ? color.rgb(0, 255, 8) : color.rgb(255, 0, 0))
plot(obv_osc, color=obc_color, style=plot.style_line, title='OBV-Points', linewidth=2)
plot(obv_osc, color=color.new(#b2b5be, 70), title='OBV', style=plot.style_area)
obvBullFilter = input.float(0.1, minval = 0, maxval = 5, step = 0.01, title ="OBV Bullish minimum value", group="On-Balance Volume")
obvBearFilter = input.float(-0.1, minval = -5, maxval = 0, step = 0.01, title ="OBV Bearish minimum value", group="On-Balance Volume")
obvBull = obv_osc > obvBullFilter
obvBear = obv_osc < obvBearFilter

// Add buy/sell signals
ReversalFilterDown = input.float(-0.7, 'Reversal Down TP Filter', -4, 4, step = 0.01, group = "RSI Level Filters", tooltip = "This is defined by taking the RSI value -50 and /10. When all Fisher lines are changing colour, this will SL/TP the long")
ReversalFilterUp = input.float(0.7, 'Reversal Up TP Filter', -4, 4, step = 0.01, group = "RSI Level Filters", tooltip = "This is defined by taking the RSI value -50 and /10. When all Fisher lines are changing colour, this will SL/TP the short")
RSILevelBuyFilter = input.float(1.66, 'RSI Level Buy Filter', -4, 4, step = 0.01, group = "RSI Level Filters", tooltip = "This is defined by taking the RSI value -50 and /10. Consider negative values")
RSILevelSellFilter = input.float(1, 'RSI Level Sell Filter', -4, 4, step = 0.01, group = "RSI Level Filters", tooltip = "This is defined by taking the RSI value -50 and /10. Consider negative values")
//buys - if breaking out and all Fisher are green and RSI filter value is met
buySignal = Fisher1 > Fisher1[1] and Fisher2 > Fisher2[1] and Fisher4 > Fisher4[1] and Fisher8 > Fisher8[1] and rsiVal > RSILevelBuyFilter and isWmaBullish and obvBull
ReversalUp = Fisher1 > Fisher1[1] and Fisher2 > Fisher2[1] and Fisher4 > Fisher4[1] and Fisher8 > Fisher8[1] and rsiVal > ReversalFilterUp
//sells - if breaking down and all Fisher are green and RSI filter value is met
sellSignal = Fisher1 < Fisher1[1] and Fisher2 < Fisher2[1] and Fisher4 < Fisher4[1] and Fisher8 < Fisher8[1] and rsiVal < RSILevelSellFilter and isWmaBearish and obvBear
ReversalDown = Fisher1 < Fisher1[1] and Fisher2 < Fisher2[1] and Fisher4 < Fisher4[1] and Fisher8 < Fisher8[1] and rsiVal < ReversalFilterDown


// Buy and Sell conditions
if buySignal and time>timestamp(2022, 06, 01, 09, 30) and barstate.isconfirmed
    strategy.close("Sell", comment = "Close Short")
    strategy.entry("Buy", strategy.long, comment = "Long")

if sellSignal and time>timestamp(2022, 06, 01, 09, 30) and barstate.isconfirmed
    strategy.close("Buy", comment = "Close Long")
    strategy.entry("Sell", strategy.short, comment = "Short")

if ReversalDown
    strategy.close("Buy", comment = "Close Long")

if ReversalUp
    strategy.close("Sell", comment = "Close Short")

//Plotting
//Fisher
plot(Fisher1, color=Fisher1 > nz(Fisher1[1]) ? color.green : color.rgb(255, 0, 0), title='Fisher TF:1')
plot(Fisher2, color=Fisher2 > nz(Fisher2[1]) ? color.green : color.rgb(255, 0, 0), title='Fisher TF:1', linewidth=2)
plot(Fisher4, color=Fisher4 > nz(Fisher4[1]) ? #008000 : #b60000, title='Fisher TF:1', linewidth=3)
plot(Fisher8, color=Fisher8 > nz(Fisher8[1]) ? #004f00 : #b60000, title='Fisher TF:1', linewidth=3)
//RSI
plot(rsiVal, color=rsiVal < 0 ? color.purple : color.yellow, linewidth=2, title='RSI')

//WMA
plot(isWmaBullish ? -2 : na, color=color.rgb(76, 175, 79, 20), linewidth=3, style=plot.style_linebr, title="WMA Bullish")
plot(isWmaBearish ? -2 : na, color=color.rgb(255, 82, 82, 20), linewidth=3, style=plot.style_linebr, title="WMA Bearish")

//Buy/Sell Signals
plotshape(buySignal, title='Buy Signal', location=location.bottom, color=color.new(color.lime, 0), style=shape.triangleup, size=size.small)
plotshape(sellSignal, title='Sell Signal', location=location.top, color=color.new(color.red, 0), style=shape.triangledown, size=size.small)

//Orientation
hline(RSILevelBuyFilter, color=color.rgb(25, 36, 99, 20), linestyle=hline.style_dotted, linewidth=2)
hline(RSILevelSellFilter, color=color.rgb(111, 27, 27, 20), linestyle=hline.style_dotted, linewidth=2)
hline(0, color=color.rgb(181, 166, 144, 39), linestyle=hline.style_dashed, linewidth=2, title = "Zero Line")
hline(1.5, color=color.rgb(217, 219, 220, 50), linestyle=hline.style_dotted, linewidth=2, title = "1.5 // 65 Line")
hline(-1.5, color=color.rgb(217, 219, 220, 50), linestyle=hline.style_dotted, linewidth=2, title = "-1.5 // 35 Line")