Trendfolgestrategie mit dualem gleitendem Durchschnitt und StochRSI-Crossover
Überblick
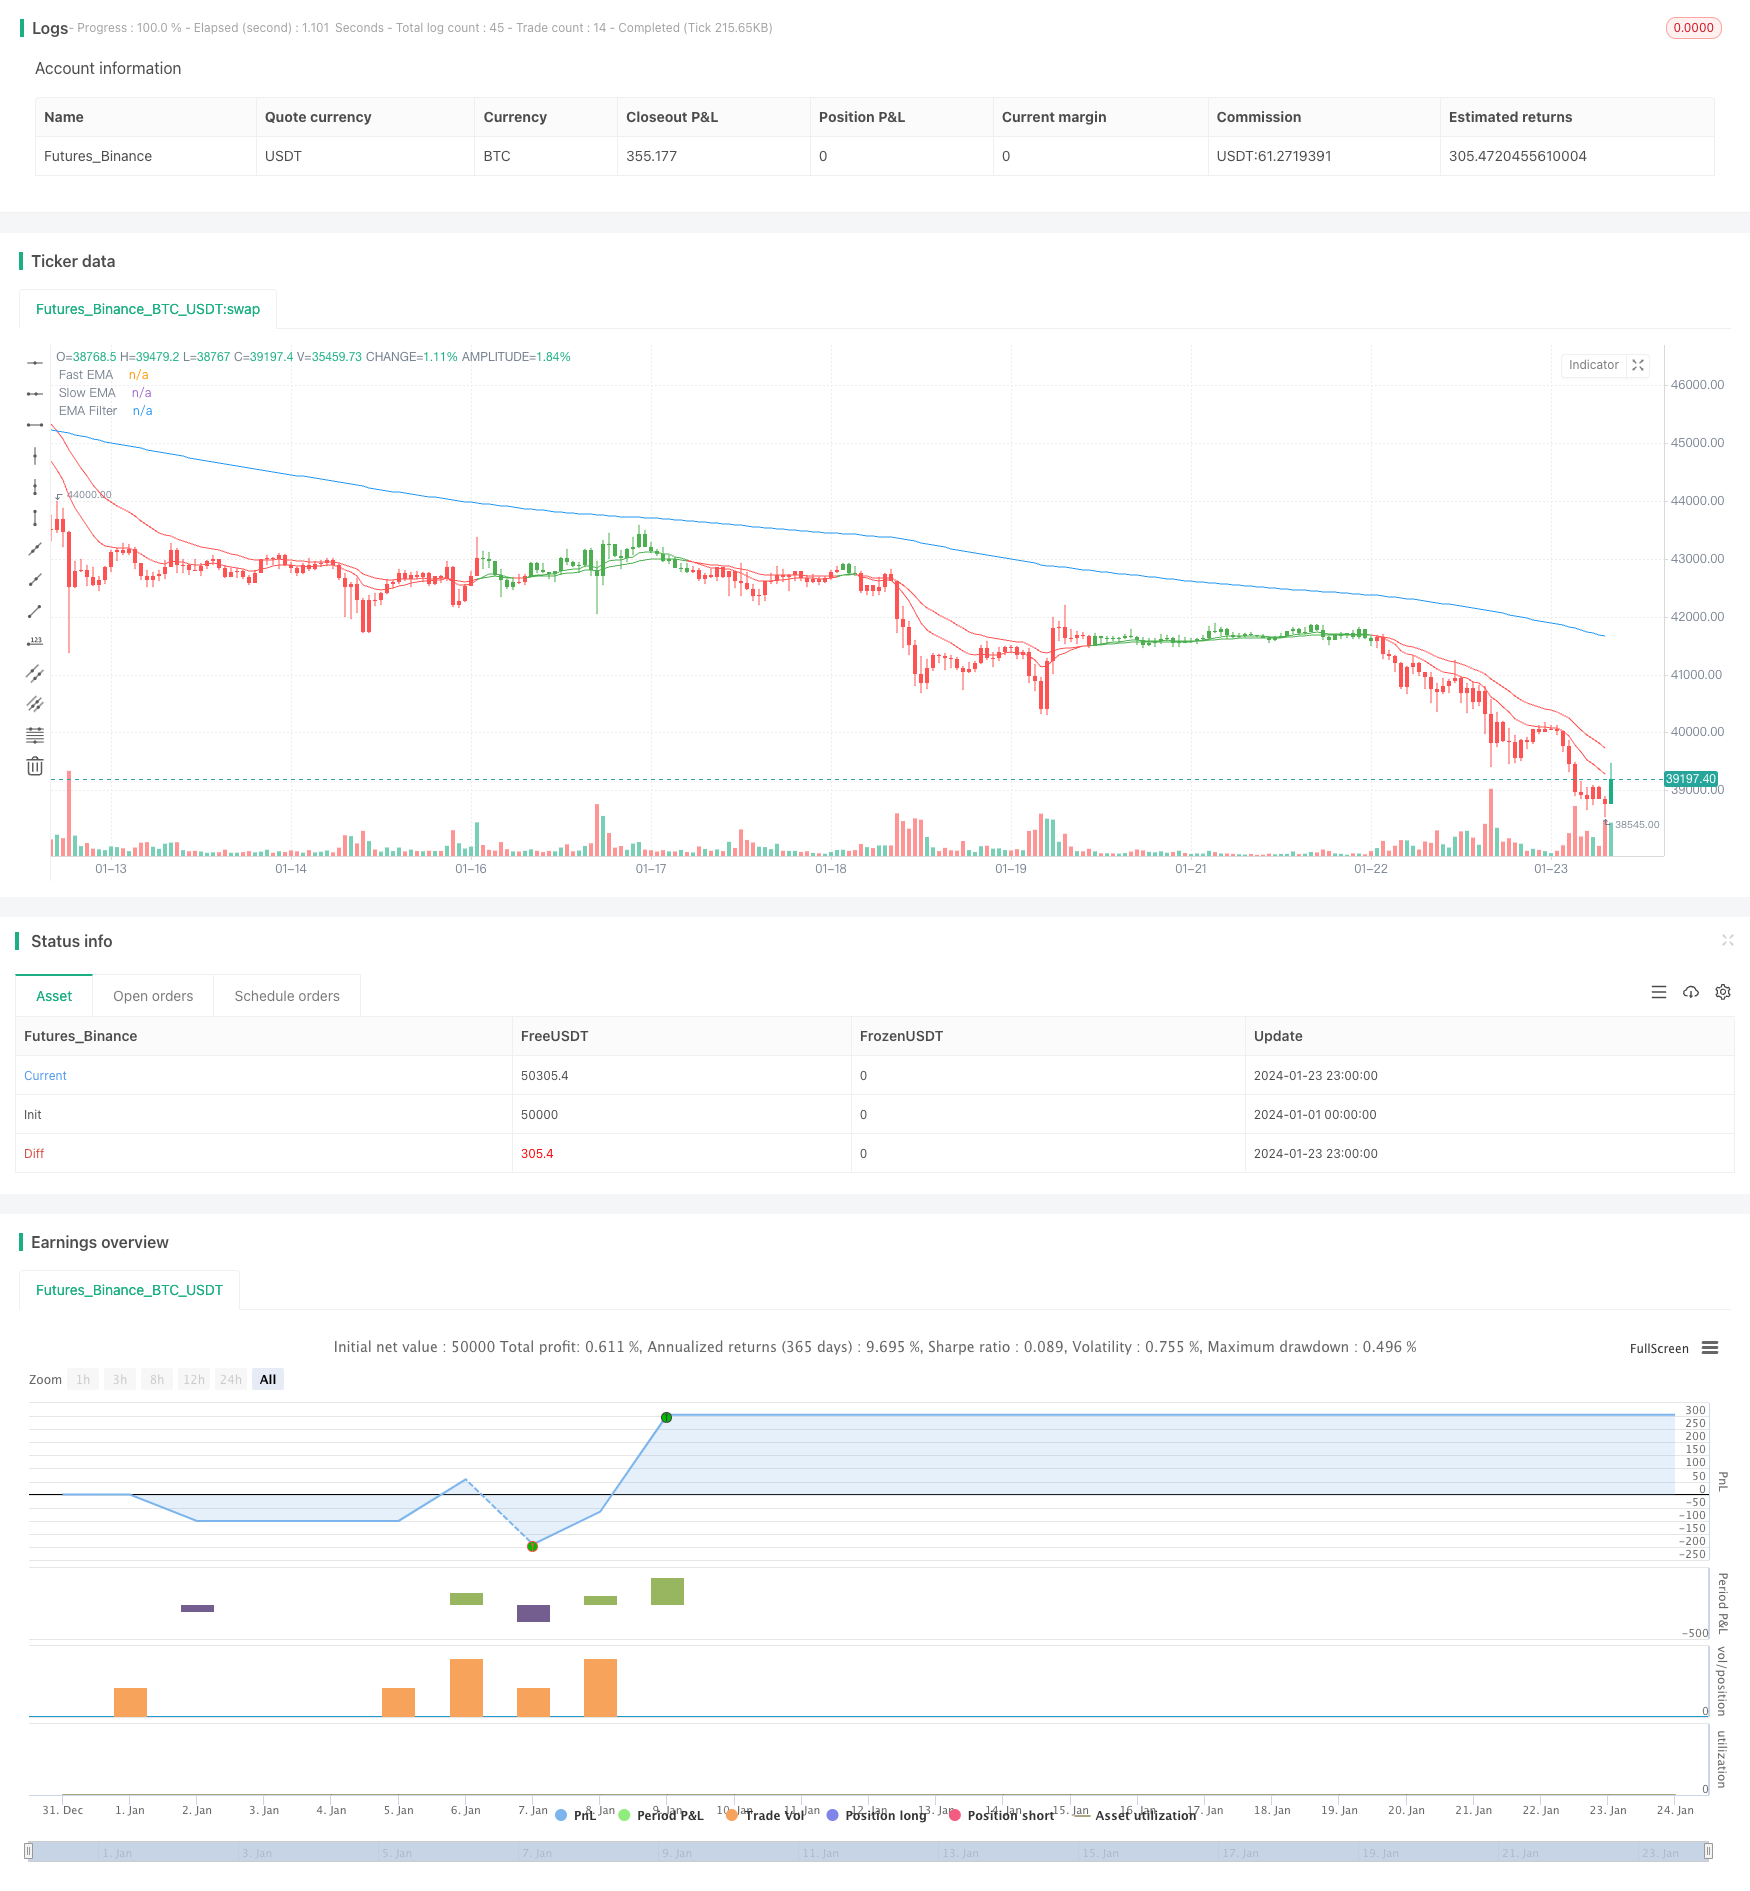
Die Strategie verwendet in Kombination mit einem doppelten Moving Average und dem StochRSI-Indikator, um eine Trendrichtung und einen Einstiegspunkt zu identifizieren. Die Hauptmerkmale sind, dass der Markt in der Anfangsphase des Trends betreten werden kann, während die Überkauf-Überverkauf-Eigenschaften des StochRSI-Indikators verwendet werden, um falsche Durchbrüche zu filtern.
Strategieprinzip
Die Strategie verwendet einen schnellen Moving Average EMA ((12)) und einen langsamen Moving Average EMA ((25)), um ein doppeltes Moving Average-System zu erstellen, das ein Kaufsignal erzeugt, wenn eine schnelle Linie eine langsame Linie durchquert, und ein Verkaufsignal erzeugt, wenn eine schnelle Linie eine langsame Linie durchquert, um die Richtung des großen Trends zu bestimmen.
Die Strategie kombiniert auch die Kreuzung des StochRSI-Indikators, um die Einstiegsmomente weiter zu identifizieren. Der StochRSI kombiniert die Zufallsindikatoren KDJ und RSI, um ein Kaufsignal zu erzeugen, wenn die K-Linie die D-Linie von der Überverkaufszone überquert, und ein Verkaufsignal, wenn die K-Linie die D-Linie von der Überkaufszone überquert.
Die Strategie wird nur dann eingesetzt, wenn ein Signal aus dem Dual Moving Average erzeugt wird, und der StochRSI erzeugt ein entsprechendes Signal. Dadurch können einige falsche Durchbrüche effektiv gefiltert und ungültige Geschäfte vermieden werden.
Analyse der Stärken
Der größte Vorteil dieser Strategie liegt in der Möglichkeit, die Richtung des Trends und die potenziellen Einstiegspunkte frühzeitig zu bestimmen. Die Moving Average-Systeme können bereits zu Beginn des Trends Signale erzeugen, während die Aufnahme des StochRSI-Indikators die falschen Durchbrüche effektiv filtert und falsche Geschäfte verhindert.
Außerdem kombiniert die Strategie die Vorteile von Trend-Analyse und Überkauf-Überverkauf-Urteilen mit den Vorteilen von Trendverfolgung und Umkehrung. Die Strategie kann alle Möglichkeiten erfassen, ob es sich um Trendverfolgung oder Kauf-Überverkauf handelt.
Risikoanalyse
Das Hauptrisiko dieser Strategie liegt in der Verzögerung des Moving Average Systems selbst. Bei plötzlichen dramatischen Veränderungen der Marktlage sind doppelte Moving Average-Systeme oft etwas später in der Lage, ein Signal zu erzeugen, was die Strategie dazu bringt, die beste Einstiegszeit zu verpassen.
Darüber hinaus kann der StochRSI falsche Signale erzeugen, die zu unnötigen Transaktionen führen. Besonders in Zeiten von Marktschwankungen können sich die K- und D-Linien häufig kreuzen, was die Gefahr birgt, dass die Strategie zu viele unwirksame Operationen ausführt.
Optimierungsrichtung
Die Optimierung der Strategie konzentriert sich auf folgende Bereiche:
Anpassung der Parameter für den doppelten gleitenden Durchschnitt, um eine mittlere Periode zu verwenden, die eher dazu beiträgt, Trends zu erfassen;
Optimierung der Parameter des StochRSI, um ein vernünftigeres Überkauf- und Überverkaufskriterium zu entwickeln;
Erhöhung der Auftragsmenge oder Anpassung der Stop-Loss-Höhe, um eine höhere Rendite zu erzielen;
In Kombination mit anderen Indikatoren als Filterbedingungen, um die Unwirksamkeit der Signale weiter zu reduzieren.
Zusammenfassen
Die Strategie als Ganzes eignet sich hervorragend für die Erfassung von mittleren und langen Trends und bietet ein hohes Gewinnpotenzial zu Beginn eines Trends. In Kombination mit dem StochRSI-Indikator als Nebenurteil kann die Strategie in der Lage sein, falsche Signale zu filtern und unnötige Verluste zu vermeiden. Durch die Optimierung der Parameter und die Verbesserung des Risikomanagements kann die Strategie ein leistungsfähiges Instrument sein, um stabile Gewinne zu erzielen.
/*backtest
start: 2024-01-01 00:00:00
end: 2024-01-24 00:00:00
period: 1h
basePeriod: 15m
exchanges: [{"eid":"Futures_Binance","currency":"BTC_USDT"}]
*/

// This source code is subject to the terms of the Mozilla Public License 2.0 at https://mozilla.org/MPL/2.0/
// © btc_charlie / @TheParagonGrp

//@version=5
strategy('BlackBit Trader XO Macro Trend Scanner', overlay=true)

// Variables
var ok = 0
var countBuy = 0
var countSell = 0
src = input(close, title='OHLC Type')
i_fastEMA = input(12, title='Fast EMA')
i_slowEMA = input(25, title='Slow EMA')
i_defEMA = input(25, title='Consolidated EMA')

// Allow the option to show single or double EMA
i_bothEMAs = input(title='Show Both EMAs', defval=true)

// Define EMAs
v_fastEMA = ta.ema(src, i_fastEMA)
v_slowEMA = ta.ema(src, i_slowEMA)
v_biasEMA = ta.ema(src, i_defEMA)

// Color the EMAs
emaColor = v_fastEMA > v_slowEMA ? color.green : v_fastEMA < v_slowEMA ? color.red : #FF530D

// Plot EMAs
plot(i_bothEMAs ? na : v_biasEMA, color=emaColor, linewidth=3, title='Consolidated EMA')
plot(i_bothEMAs ? v_fastEMA : na, title='Fast EMA', color=emaColor)
plot(i_bothEMAs ? v_slowEMA : na, title='Slow EMA', color=emaColor)

// Colour the bars
buy = v_fastEMA > v_slowEMA
sell = v_fastEMA < v_slowEMA

if buy
    countBuy += 1
    countBuy

if buy
    countSell := 0
    countSell

if sell
    countSell += 1
    countSell

if sell
    countBuy := 0
    countBuy

buysignal = countBuy < 2 and countBuy > 0 and countSell < 1 and buy and not buy[1]
sellsignal = countSell > 0 and countSell < 2 and countBuy < 1 and sell and not sell[1]

barcolor(buysignal ? color.green : na)
barcolor(sellsignal ? color.red : na)


bull = countBuy > 1
bear = countSell > 1

barcolor(bull ? color.green : na)
barcolor(bear ? color.red : na)

// Set Alerts

// alertcondition(ta.crossover(v_fastEMA, v_slowEMA), title='Bullish EMA Cross', message='Bullish EMA crossover')
// alertcondition(ta.crossunder(v_fastEMA, v_slowEMA), title='Bearish EMA Cross', message='Bearish EMA Crossover')

// Stoch RSI code

smoothK = input.int(3, 'K', minval=1)
smoothD = input.int(3, 'D', minval=1)
lengthRSI = input.int(14, 'RSI Length', minval=1)
lengthStoch = input.int(14, 'Stochastic Length', minval=1)

rsi1 = ta.rsi(src, lengthRSI)
k = ta.sma(ta.stoch(rsi1, rsi1, rsi1, lengthStoch), smoothK)
d = ta.sma(k, smoothD)

bandno0 = input.int(80, minval=1, title='Upper Band', group='Bands (change this instead of length in Style for Stoch RSI colour to work properly)')
bandno2 = input.int(50, minval=1, title='Middle Band', group='Bands (change this instead of length in Style for Stoch RSI colour to work properly)')
bandno1 = input.int(20, minval=1, title='Lower Band', group='Bands (change this instead of length in Style for Stoch RSI colour to work properly)')

// Alerts

crossoverAlertBgColourMidOnOff = input.bool(title='Crossover Alert Background Colour (Middle Level) [ON/OFF]', group='Crossover Alerts', defval=false)
crossoverAlertBgColourOBOSOnOff = input.bool(title='Crossover Alert Background Colour (OB/OS Level) [ON/OFF]', group='Crossover Alerts', defval=false)

crossoverAlertBgColourGreaterThanOnOff = input.bool(title='Crossover Alert >input [ON/OFF]', group='Crossover Alerts', defval=false)
crossoverAlertBgColourLessThanOnOff = input.bool(title='Crossover Alert <input [ON/OFF]', group='Crossover Alerts', defval=false)

maTypeChoice = input.string('EMA', title='MA Type', group='Moving Average', options=['EMA', 'WMA', 'SMA', 'None'])
maSrc = input.source(close, title='MA Source', group='Moving Average')
maLen = input.int(200, minval=1, title='MA Length', group='Moving Average')

maValue = if maTypeChoice == 'EMA'
    ta.ema(maSrc, maLen)
else if maTypeChoice == 'WMA'
    ta.wma(maSrc, maLen)
else if maTypeChoice == 'SMA'
    ta.sma(maSrc, maLen)
else
    0

crossupCHECK = maTypeChoice == 'None' or open > maValue and maTypeChoice != 'None'
crossdownCHECK = maTypeChoice == 'None' or open < maValue and maTypeChoice != 'None'

crossupalert = crossupCHECK and ta.crossover(k, d) and (k < bandno2 or d < bandno2)
crossdownalert = crossdownCHECK and ta.crossunder(k, d) and (k > bandno2 or d > bandno2)
crossupOSalert = crossupCHECK and ta.crossover(k, d) and (k < bandno1 or d < bandno1)
crossdownOBalert = crossdownCHECK and ta.crossunder(k, d) and (k > bandno0 or d > bandno0)

aboveBandalert = ta.crossunder(k, bandno0)
belowBandalert = ta.crossover(k, bandno1)

bgcolor(color=crossupalert and crossoverAlertBgColourMidOnOff ? #4CAF50 : crossdownalert and crossoverAlertBgColourMidOnOff ? #FF0000 : na, title='Crossover Alert Background Colour (Middle Level)', transp=70)
bgcolor(color=crossupOSalert and crossoverAlertBgColourOBOSOnOff ? #fbc02d : crossdownOBalert and crossoverAlertBgColourOBOSOnOff ? #000000 : na, title='Crossover Alert Background Colour (OB/OS Level)', transp=70)

bgcolor(color=aboveBandalert and crossoverAlertBgColourGreaterThanOnOff ? #ff0014 : crossdownalert and crossoverAlertBgColourMidOnOff ? #FF0000 : na, title='Crossover Alert - K > Upper level', transp=70)
bgcolor(color=belowBandalert and crossoverAlertBgColourLessThanOnOff ? #4CAF50 : crossdownalert and crossoverAlertBgColourMidOnOff ? #FF0000 : na, title='Crossover Alert - K < Lower level', transp=70)

// alertcondition(crossupalert or crossdownalert, title='Stoch RSI Crossover', message='STOCH RSI CROSSOVER')

// Calculate start/end date and time condition
startDate = input(timestamp('2000-12-24T00:00:00'),group = "---------TIME RANGE SETTINGS---------")
finishDate = input(timestamp('2029-02-26T00:00:00'),group = "---------TIME RANGE SETTINGS---------")
time_cond = true


//ema filter
emalen = input(200,"EMA Filter Length",group = "EMA FILTER SETTINGS")
emasource = input(close,"EMA Filter Source",group = "EMA FILTER SETTINGS")
ema_fil = ta.ema(emasource,emalen)
plot(ema_fil,"EMA Filter")

//macd
fast_length = input(title="Fast Length", defval=26,group = "MACD FILTER SETTINGS")
slow_length = input(title="Slow Length", defval=100,group = "MACD FILTER SETTINGS")
src_macd = input(title="Source", defval=close,group = "MACD FILTER SETTINGS")
signal_length = input.int(title="Signal Smoothing",  minval = 1, maxval = 50, defval = 9,group = "MACD FILTER SETTINGS")
sma_source = input.string(title="Oscillator MA Type",  defval="EMA", options=["SMA", "EMA"],group = "MACD FILTER SETTINGS")
sma_signal = input.string(title="Signal Line MA Type", defval="EMA", options=["SMA", "EMA"],group = "MACD FILTER SETTINGS")

// Calculating
fast_ma = sma_source == "SMA" ? ta.sma(src_macd, fast_length) : ta.ema(src_macd, fast_length)
slow_ma = sma_source == "SMA" ? ta.sma(src_macd, slow_length) : ta.ema(src_macd, slow_length)
macd = fast_ma - slow_ma
signal = sma_signal == "SMA" ? ta.sma(macd, signal_length) : ta.ema(macd, signal_length)
hist = macd - signal

//tpsl
takeprofit=input.float(defval=0.3,title="Enter The Take Profit %",group="TP/SL CONDITION INPUTS HERE")/100
stoploss=input.float(defval=0.16,title="Enter The Stop %",group="TP/SL CONDITION INPUTS HERE")/100
tp = strategy.opentrades.entry_price(0)*takeprofit/syminfo.mintick
sl = strategy.opentrades.entry_price(0)*stoploss/syminfo.mintick

lg_rule = buysignal and hist > 0 and close > ema_fil
sh_rule = sellsignal and hist < 0 and close < ema_fil

// Plot Bull/Bear

plotshape(lg_rule, title='Bull', text='Bull', style=shape.triangleup, location=location.belowbar, color=color.new(color.green, 0), textcolor=color.new(color.black, 0), size=size.tiny)
plotshape(sh_rule, title='Bear', text='Bear', style=shape.triangledown, location=location.abovebar, color=color.new(color.red, 0), textcolor=color.new(color.black, 0), size=size.tiny)

//alert
lg_entryal = input("Long entry","Long entry alert",group = "ALERT MESSAGE SETTINGS")
sh_entryal = input("Short entry","Short entry alert",group = "ALERT MESSAGE SETTINGS")

if lg_rule and time_cond and barstate.isconfirmed
    strategy.entry("LONG",strategy.long)
    alert(lg_entryal,alert.freq_once_per_bar_close)
if strategy.position_size > 0
    strategy.exit("LONG EX","LONG",loss = sl,profit = tp,comment_loss = "LONG SL",comment_profit = "LONG TP")

if sh_rule and time_cond and barstate.isconfirmed
    strategy.entry("SHORT",strategy.short)
    alert(sh_entryal,alert.freq_once_per_bar_close)

if strategy.position_size < 0
    strategy.exit("SHORT EX","SHORT",loss = sl,profit = tp,comment_loss = "SHORT SL",comment_profit = "SHORT TP")

//end