Trendfolgende quantitative Strategie basierend auf Wave Trend und VWMA
Überblick
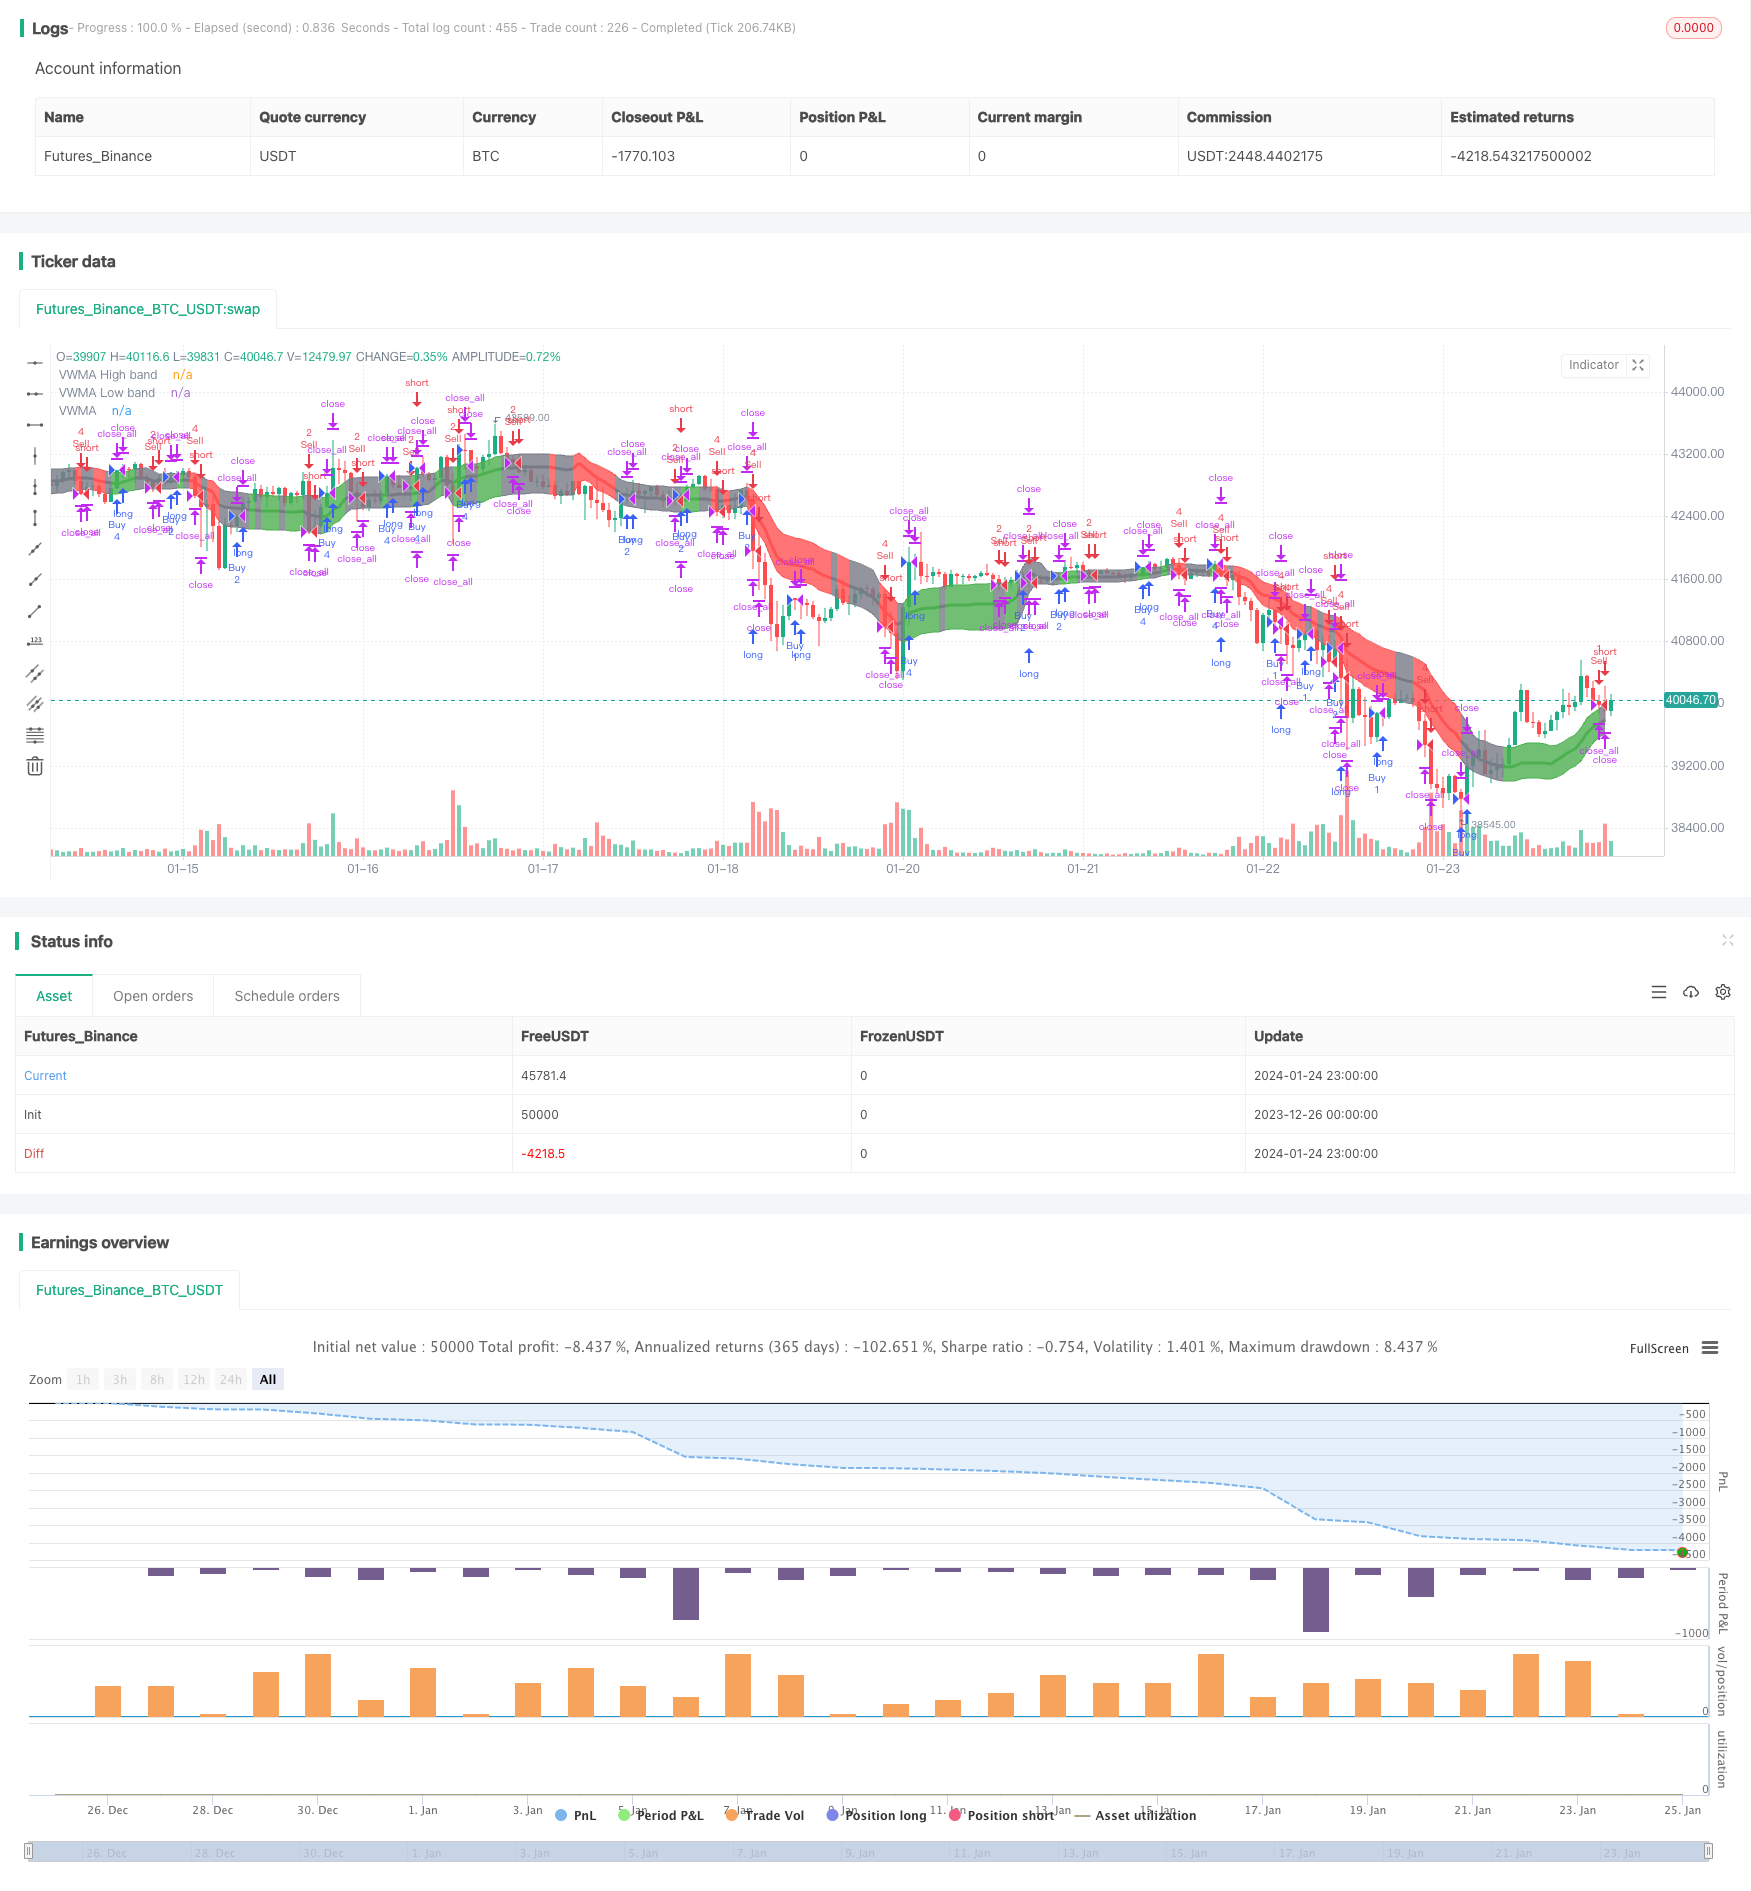
Die Strategie kombiniert Wave Trend Oscillator und VWMA Indikator, um eine quantitative Handelsstrategie zu realisieren, die den Trend verfolgt. Diese Strategie kann Markttrends erkennen und auf Basis der Signale des Wave Trend Oscillators kaufen oder verkaufen. Zusätzlich wird die Handelsgröße auf Basis der Signale des VWMA Indikators bestimmt.
Strategieprinzip
Die Strategie basiert auf zwei Indikatoren:
Wave Trend Oscillator: Ein Indikator, der von LazyBear in TradingView transportiert wurde, um die Wellenläufe von Preisbewegungen zu erkennen und ein Kauf/Verkauf-Signal zu erzeugen. Die spezifische Berechnungsmethode ist: Zuerst wird der Durchschnittswert des Preises abgerechnet, dann der EMA von ap (als esa bezeichnet), dann der EMA des absoluten Wertes der Differenz zwischen ap und esa (als d bezeichnet), und schließlich wird der Konsistenzindex berechnet.*d), die EMA von ci ist Wave Trend ((wt1)), die 4-Perioden-SMA von wt1 ist wt2. Wenn wt1 überwt2 als Kaufsignal und unterwt2 als Verkaufsignal durchbricht.
Der VWMA-Indikator: Ein gewichteter Moving Average, der die Transaktionsmenge berücksichtigt. Je nachdem, ob der Preis innerhalb oder außerhalb der VWMABands liegt, erzeugt er ein Signal von +1 (Mehrköpfig), 0 (Neutral) oder -1.
Die Zeitpunkte für den Kauf und Verkauf werden anhand des Signals des Wave Trend bestimmt. Die Anzahl der einzelnen Transaktionen wird anhand des Pluralitätssignals des VWMA-Indikators bestimmt.
Strategische Vorteile
- Die Kombination von Signalen aus zwei Indikatoren verbessert die Entscheidungsgenauigkeit
- Der VWMA-Wert, der auf den Umsätzen basiert, ist ein Indikator, der die Kräfte des Marktes unterscheidet.
- Anpassbare Handelszeiten, um starke Schwankungen bei wichtigen Nachrichten zu vermeiden
- Anpassung der Anzahl der Transaktionen an die Signale der VWMA, um die Risiken zu reduzieren
Strategisches Risiko
- Der Wave Trend-Indikator könnte falsche Signale erzeugen
- Ungenaue Transaktionsdaten können die VWMA-Index beeinflussen
- Längere historische Daten für die Berechnung von Indikatoren
- Nicht berücksichtigte Stop-Loss-Strategie
Optimierungsrichtung
- Verschiedene Parameterkombinationen testen, um die beste Parameter zu finden
- Erhöhung der Stop-Loss-Strategie
- Erwägen Sie eine Signalfilterung in Verbindung mit anderen Indikatoren
- Verschiedene Zeiträume für den Handel testen
- Wie die Anzahl der Transaktionen mit dynamischer Anpassung berechnet wird
Zusammenfassen
Die Strategie integriert Trendbeurteilung und quantitative Kennzahlen, um eine fortgeschrittene Trendverfolgung zu ermöglichen. Die Strategie hat einige Vorteile, aber es gibt auch einige Risiken, die beachtet werden müssen. Durch die Optimierung der Parameter und Regeln wird erwartet, dass die Stabilität und die Ertragsrate der Strategie weiter verbessert werden.
/*backtest
start: 2023-12-26 00:00:00
end: 2024-01-25 00:00:00
period: 1h
basePeriod: 15m
exchanges: [{"eid":"Futures_Binance","currency":"BTC_USDT"}]
*/

// This source code is subject to the terms of the Mozilla Public License 2.0 at
// https://mozilla.org/MPL/2.0/
//
// Created by jadamcraig
//
// This strategy benefits from extracts taken from the following
// studies/authors.  Thank you for developing and sharing your ideas in an open
// way!
//  * Wave Trend Strategy by thomas.gigure
//  * cRSI + Waves Strategy with VWMA overlay by Dr_Roboto
//
//@version=4

//==============================================================================
//==============================================================================
overlay = true  // plots VWMA (need to close and re-add)
//overlay = false // plots Wave Trend (need to close and re-add)

strategy("Wave Trend w/ VWMA overlay", overlay=overlay)

baseQty = input(defval=1, title="Base Quantity", type=input.float, minval=1)

useSessions = input(defval=true, title="Limit Signals to Trading Sessions?")
sess1_startHour = input(defval=8, title="Session 1: Start Hour",
     type=input.integer, minval=0, maxval=23)
sess1_startMinute = input(defval=25, title="Session 1: Start Minute",
     type=input.integer, minval=0, maxval=59)
sess1_stopHour = input(defval=10, title="Session 1: Stop Hour",
     type=input.integer, minval=0, maxval=23)
sess1_stopMinute = input(defval=25, title="Session 1: Stop Minute",
     type=input.integer, minval=0, maxval=59)
sess2_startHour = input(defval=12, title="Session 2: Start Hour",
     type=input.integer, minval=0, maxval=23)
sess2_startMinute = input(defval=55, title="Session 2: Start Minute",
     type=input.integer, minval=0, maxval=59)
sess2_stopHour = input(defval=14, title="Session 2: Stop Hour",
     type=input.integer, minval=0, maxval=23)
sess2_stopMinute = input(defval=55, title="Session 2: Stop Minute",
     type=input.integer, minval=0, maxval=59)
sess1_closeAll = input(defval=false, title="Close All at End of Session 1")
sess2_closeAll = input(defval=true, title="Close All at End of Session 2")

//==============================================================================
//==============================================================================
//                    Volume Weighted Moving Average (VWMA)
//==============================================================================
//==============================================================================
plotVWMA = overlay

// check if volume is available for this equity
useVolume = input(
     title="VWMA: Use Volume (uncheck if equity does not have volume)",
     defval=true)

vwmaLen = input(defval=21, title="VWMA: Length", type=input.integer, minval=1,
     maxval=200)
vwma = vwma(close, vwmaLen)
vwma_high = vwma(high, vwmaLen)
vwma_low = vwma(low, vwmaLen)

if not(useVolume)
    vwma := wma(close, vwmaLen)
    vwma_high := wma(high, vwmaLen)
    vwma_low := wma(low, vwmaLen)

// +1 when above, -1 when below, 0 when inside
vwmaSignal(priceOpen, priceClose, vwmaHigh, vwmaLow) =>
    sig = 0
    color = color.gray
    if priceClose > vwmaHigh
        sig := 1
        color := color.green
    else if priceClose < vwmaLow
        sig := -1
        color := color.red
    else
        sig := 0
        color := color.gray
    [sig,color]

[vwma_sig, vwma_color] = vwmaSignal(open, close, vwma_high, vwma_low)

priceAboveVWMA = vwma_sig ==  1 ? true : false
priceBelowVWMA = vwma_sig == -1 ? true : false
// plot(priceAboveVWMA?2.0:0,color=color.blue)
// plot(priceBelowVWMA?2.0:0,color=color.maroon)

//bandTrans = input(defval=70, title="VWMA Band Transparancy (100 invisible)",
//     type=input.integer, minval=0, maxval=100)
//fillTrans = input(defval=70, title="VWMA Fill Transparancy (100 invisible)",
//     type=input.integer, minval=0, maxval=100)
bandTrans = 60
fillTrans = 60

// ***** Plot VWMA *****
highband = plot(plotVWMA?fixnan(vwma_high):na, title='VWMA High band',
     color = vwma_color, linewidth=1, transp=bandTrans)
lowband = plot(plotVWMA?fixnan(vwma_low):na, title='VWMA Low band',
     color = vwma_color, linewidth=1, transp=bandTrans)
fill(lowband, highband, title='VWMA Band fill', color=vwma_color,
     transp=fillTrans)
plot(plotVWMA?vwma:na, title='VWMA', color = vwma_color, linewidth=3,
     transp=bandTrans)

//==============================================================================
//==============================================================================
//                                  Wave Trend
//==============================================================================
//==============================================================================
plotWaveTrend = not(overlay)

n1 = input(10, "Wave Trend: Channel Length")
n2 = input(21, "Wave Trend: Average Length")
obLevel1 = input(60, "Wave Trend: Over Bought Level 1")
obLevel2 = input(53, "Wave Trend: Over Bought Level 2")
osLevel1 = input(-60, "Wave Trend: Over Sold Level 1")
osLevel2 = input(-53, "Wave Trend: Over Sold Level 2")

ap = hlc3
esa = ema(ap, n1)
d = ema(abs(ap - esa), n1)
ci = (ap - esa) / (0.015 * d)
tci = ema(ci, n2)

wt1 = tci
wt2 = sma(wt1,4)

plot(plotWaveTrend?0:na, color=color.gray)
plot(plotWaveTrend?obLevel1:na, color=color.red)
plot(plotWaveTrend?osLevel1:na, color=color.green)
plot(plotWaveTrend?obLevel2:na, color=color.red, style=3)
plot(plotWaveTrend?osLevel2:na, color=color.green, style=3)

plot(plotWaveTrend?wt1:na, color=color.green)
plot(plotWaveTrend?wt2:na, color=color.red, style=3)
plot(plotWaveTrend?wt1-wt2:na, color=color.blue, transp=80)

//==============================================================================
//==============================================================================
//                               Order Management
//==============================================================================
//==============================================================================
// Define Long and Short Conditions
longCondition = crossover(wt1, wt2)
shortCondition = crossunder(wt1, wt2)

// Define Quantities
orderQty = baseQty * 2
if (longCondition)
    if (vwma_sig == 1)
        if ( strategy.position_size >= (baseQty * 4 * -1) and
             strategy.position_size < 0 )
            orderQty := baseQty * 4 + abs(strategy.position_size)
        else
            orderQty := baseQty * 4
    else if (vwma_sig == 0)
        if ( strategy.position_size >= (baseQty * 2 * -1) and
             strategy.position_size < 0 )
            orderQty := baseQty * 2 + abs(strategy.position_size)
        else
            orderQty := baseQty * 2
    else if (vwma_sig == -1)
        if ( strategy.position_size >= (baseQty * 1 * -1) and
             strategy.position_size < 0 )
            orderQty := baseQty * 1 + abs(strategy.position_size)
        else
            orderQty := baseQty * 1
else if (shortCondition)
    if (vwma_sig == -1)
        if ( strategy.position_size <= (baseQty * 4) and
             strategy.position_size > 0 )
            orderQty := baseQty * 4 + strategy.position_size
        else
            orderQty := baseQty * 4
    else if (vwma_sig == 0)
        if ( strategy.position_size <= (baseQty * 2) and
             strategy.position_size > 2 )
            orderQty := baseQty * 2 + strategy.position_size
        else
            orderQty := baseQty * 2
    else if (vwma_sig == 1)
        if ( strategy.position_size <= (baseQty * 1) and
             strategy.position_size > 0 )
            orderQty := baseQty * 1 + strategy.position_size
        else
            orderQty := baseQty * 1

// Determine if new trades are permitted
newTrades = false
if (useSessions)
    if ( hour == sess1_startHour and minute >= sess1_startMinute )
        newTrades := true
    else if ( hour > sess1_startHour and hour < sess1_stopHour )
        newTrades := true
    else if ( hour == sess1_stopHour and minute < sess1_stopMinute )
        newTrades := true
    else if ( hour == sess2_startHour and minute >= sess2_startMinute )
        newTrades := true
    else if ( hour > sess2_startHour and hour < sess2_stopHour )
        newTrades := true
    else if ( hour == sess2_stopHour and minute < sess2_stopMinute )
        newTrades := true
    else
        newTrades := false
else
    newTrades := true

// Long Signals
if ( longCondition  )
    strategy.order("Buy", strategy.long, orderQty)

// Short Signals
if ( shortCondition  )
    strategy.order("Sell", strategy.short, orderQty)

// Close open position at end of Session 1, if enabled
if (sess1_closeAll )
    strategy.close_all()

// Close open position at end of Session 2, if enabled
if (sess2_closeAll  )
    strategy.close_all()