Bollinger + RSI, doble estrategia v1.1
El autor:¿ Qué pasa?, Fecha: 2022-05-07 14:59:50Las etiquetas:Indicador de riesgo
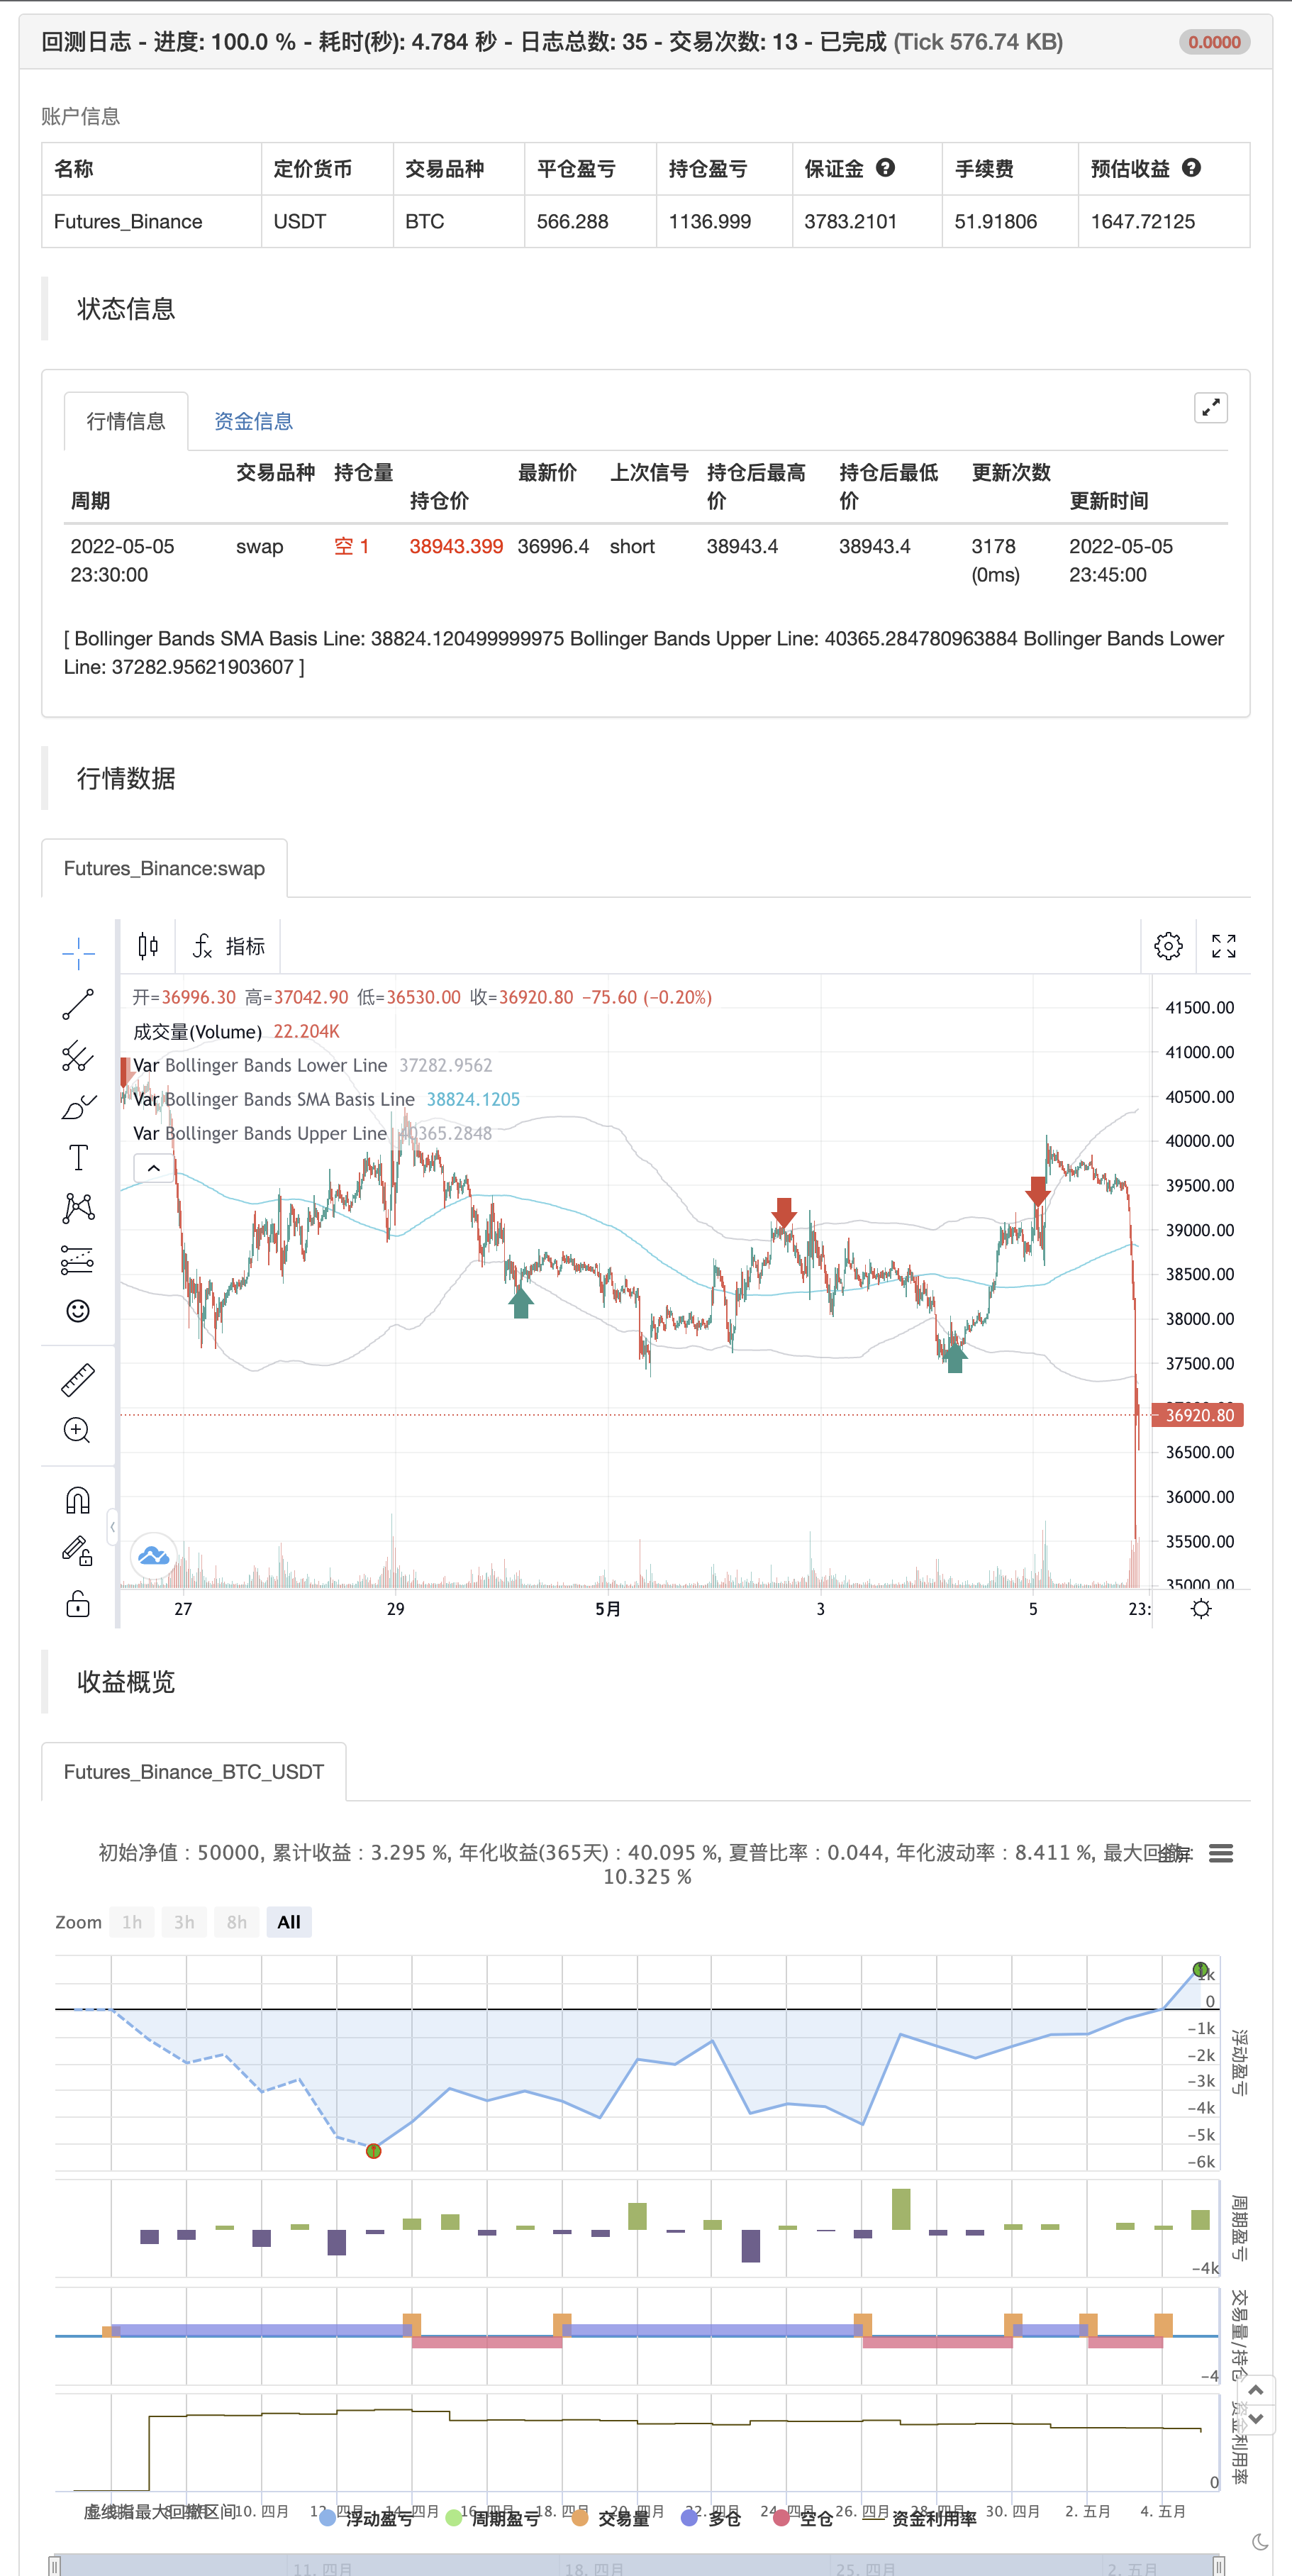
Esta estrategia utiliza el indicador RSI junto con las bandas de Bollinger para vender cuando el precio está por encima de la banda superior de Bollinger (y para comprar cuando este valor está por debajo de la banda inferior).
ActualizaciónEn esta versión actualizada 1.1 la estrategia se simplificó para el usuario (menos entradas) y se hizo más exitosa en backtesting mediante el uso de un período de 200 para el SMA que es la base de la banda de Bollinger.
Y al igual que la primera versión, esta estrategia no utiliza precios de cierre de un marco de tiempo más alto y no debe volver a pintar después de que la vela actual se haya cerrado.
Todos los trades implican un alto riesgo; el rendimiento pasado no es necesariamente indicativo de resultados futuros. Los resultados hipotéticos o simulados del rendimiento tienen ciertas limitaciones inherentes. A diferencia de un registro de rendimiento real, los resultados simulados no representan el comercio real. Además, ya que las operaciones no se han ejecutado realmente, los resultados pueden haber subcompensado o sobrecompensado el impacto de ciertos factores del mercado, como la falta de liquidez. Los programas de comercio simulados en general también están sujetos al hecho de que están diseñados con el beneficio de la retrospectiva.
P.S. Para los usuarios avanzados si desea acceder a más funciones de este script de estrategia, entonces por favor use la versión 1.0:Las pruebas
/*backtest
start: 2022-04-06 00:00:00
end: 2022-05-05 23:59:00
period: 15m
basePeriod: 5m
exchanges: [{"eid":"Futures_Binance","currency":"BTC_USDT"}]
*/

//@version=2
strategy("Bollinger + RSI, Double Strategy (by ChartArt) v1.1", shorttitle="CA_-_RSI_Bol_Strat_1.1", overlay=true)

// ChartArt's RSI + Bollinger Bands, Double Strategy - Update
//
// Version 1.1
// Idea by ChartArt on January 18, 2015.
//
// This strategy uses the RSI indicator
// together with the Bollinger Bands
// to sell when the price is above the
// upper Bollinger Band (and to buy when
// this value is below the lower band).
//
// This simple strategy only triggers when
// both the RSI and the Bollinger Bands
// indicators are at the same time in
// a overbought or oversold condition.
//
// In this version 1.1 the strategy was
// both simplified for the user and
// made more successful in backtesting.
//
// List of my work:
// https://www.tradingview.com/u/ChartArt/
//
//  __             __  ___       __  ___
// /  ` |__|  /\  |__)  |   /\  |__)  |
// \__, |  | /~~\ |  \  |  /~~\ |  \  |
//
//


///////////// RSI
RSIlength = input(6,title="RSI Period Length")
RSIoverSold = 50
RSIoverBought = 50
price = close
vrsi = rsi(price, RSIlength)


///////////// Bollinger Bands
BBlength = input(200, minval=1,title="Bollinger Period Length")
BBmult = 2 // input(2.0, minval=0.001, maxval=50,title="Bollinger Bands Standard Deviation")
BBbasis = sma(price, BBlength)
BBdev = BBmult * stdev(price, BBlength)
BBupper = BBbasis + BBdev
BBlower = BBbasis - BBdev
source = close
buyEntry = crossover(source, BBlower)
sellEntry = crossunder(source, BBupper)
plot(BBbasis, color=aqua,title="Bollinger Bands SMA Basis Line")
p1 = plot(BBupper, color=silver,title="Bollinger Bands Upper Line")
p2 = plot(BBlower, color=silver,title="Bollinger Bands Lower Line")
//fill(p1, p2)


///////////// Colors
switch1=input(true, title="Enable Bar Color?")
switch2=input(true, title="Enable Background Color?")
TrendColor = RSIoverBought and (price[1] > BBupper and price < BBupper) and BBbasis < BBbasis[1] ? red : RSIoverSold and (price[1] < BBlower and price > BBlower) and BBbasis > BBbasis[1] ? green : na
///barcolor(switch1?TrendColor:na)
//bgcolor(switch2?TrendColor:na,transp=50)


///////////// RSI + Bollinger Bands Strategy
if (not na(vrsi))

    if (crossover(vrsi, RSIoverSold) and crossover(source, BBlower))
        strategy.entry("RSI_BB_L", strategy.long, stop=BBlower,  comment="RSI_BB_L")

    if (crossunder(vrsi, RSIoverBought) and crossunder(source, BBupper))
        strategy.entry("RSI_BB_S", strategy.short, stop=BBupper,  comment="RSI_BB_S")

//plot(strategy.equity, title="equity", color=red, linewidth=2, style=areabr)
- MACD RSI Ichimoku Tendencia de impulso después de una estrategia larga
- Estrategia de cambio de dirección de los indicadores de riesgo
- Estrategia de negociación mejorada de bandas de Bollinger RSI
- Estrategia de pivote y impulso
- Estrategia de negociación integral de la media móvil y el índice de variabilidad
- Estrategia de cambio de martes (filtro de fin de semana)
- Estrategia reforzada de cruce de la EMA con el RSI/MACD/ATR
- Estrategia de negociación a largo plazo combinada del MACD y del RSI
- RSI2 Estrategia de reversión intradiaria de la tasa de ganancia
- Tendencia de múltiples indicadores siguiendo la estrategia
- Estrategia de negociación de AlphaTradingBot
- Baguetas de granos
- La máquina de moler
- Indicador de inversión de K I
- Las velas engullentes
- MA Emperador en sí
- Puntos de reversión de Demark
- Los patrones de swing altos/bajos y de velas
- Superposición de TMA
- El valor de las operaciones de mercado se calcula a partir de las siguientes cifras:
- Sistema de disparo por honda CM
- Estrategia de bandas de Bollinger
- Seguimiento de tendencias optimizado
- Retorno mensual en las estrategias de PineScript
- ADX y DI para v4
- MacD Indicador personalizado-marco de tiempo múltiple + Todas las opciones disponibles!
- Indicador: Oscilador de tendencia de onda
- Indicador de impulso de compresión
- La tendencia alfa
- el comercio en marcos de tiempo múltiples
- Oscilador de sentimiento