Estrategia de impulso de cruce de medias móviles dobles

Descripción general
La estrategia utiliza el principio de doble cruce de líneas uniformes, combinando el juicio de tendencia del indicador MACD y los cruces de destaque de fondo, complementado con el punto de forma, con el objetivo de capturar la tendencia intermedia del mercado. La lógica principal es entrar en el mercado cuando se produce una conversión en la dirección de la línea uniforme, entrar en el cruce de destaque a través del color de fondo MACD, en combinación con el juicio de cambio de color del diagrama rectangular MACD.
Principio de estrategia
La estrategia utiliza el EMA rápido y el EMA lento para construir dos líneas medias, y las líneas rápidas y lentas se cruzan para determinar la dirección de la tendencia. Al mismo tiempo, se calculan el MACD y el Signal, cuya diferencia se traza como un gráfico rectangular.
De acuerdo con el código, la longitud de la línea rápida es de 12, la longitud de la línea lenta es de 26, lo que indica tendencias a corto y largo plazo. La longitud de la señal es de 9, para un procesamiento de suavización adicional.
Logía cruzada:
- trend_up = macd > signal: una línea lenta en una línea rápida, que representa una tendencia alcista a corto plazo
- trend_dn = macd < signal: la línea rápida atraviesa la línea lenta, lo que representa una tendencia bajista a corto plazo
El punto de intersección:
- cross_UP = signal[1] >= macd[1] and signal < macd: la línea rápida atraviesa la línea lenta desde abajo
- cross_DN = signal[1] <= macd[1] and signal > macd: la línea rápida atraviesa la línea lenta desde arriba hacia abajo
El gráfico rectangular muestra el cambio de color para determinar la intensidad de la tendencia:
- histA_IsUp = columna de la gráfica vertical crece y es mayor que 0, lo que representa el aumento de la fuerza de ascenso
- histA_IsDown = columnas del diagrama rectangular menores y mayores que 0, que representan la disminución de la fuerza ascendente
- El mismo que abajo.
Ventajas estratégicas
-
Utiliza dos líneas de equilibrio para determinar la dirección de la tendencia a medio plazo, evitando ser interrumpido por el ruido del mercado a corto plazo
-
Los indicadores MACD ayudan a determinar las tendencias y la intensidad a corto plazo para aumentar la probabilidad de obtener ganancias
-
Los cambios de color en el diagrama vertical determinan el tamaño de la intensidad, lo que permite un mejor momento de entrada
-
El color de fondo de las marcas de puntos cruzados, a primera vista
-
Período medíocre personalizable para adaptarse a diferentes entornos del mercado
-
Se pueden ajustar los parámetros MACD para optimizar el efecto del indicador
-
Ofrece varias formas de confirmación de entrada: dirección de la línea media, cruce de indicadores, ruptura de forma
Riesgo estratégico
-
La línea de paridad binaria determina que la tendencia intermedia no es sensible a las fluctuaciones a corto plazo y puede perder oportunidades de línea corta.
-
Los parámetros del MACD están mal configurados, el indicador no funciona bien y emite una señal errónea
-
Hay cierta ceguera con sólo el ingreso de la línea media y la señal MACD
-
No se ha considerado el mecanismo de suspensión de pérdidas y existe el riesgo de que las pérdidas aumenten
-
Falta de estricta gestión de fondos y control de posiciones
Soluciones posibles:
-
En combinación con otros indicadores para limitar el rango de fluctuación a corto plazo y controlar el riesgo
-
Optimización de los parámetros MACD para probar el efecto en diferentes mercados
-
Aumentar las señales de confirmación por factores como la forma y el momento
-
Establecer mecanismos de detención de pérdidas para evitar pérdidas excesivas
-
Adición de un módulo de administración de fondos para controlar las posiciones individuales según el tamaño de los fondos
Dirección de optimización de la estrategia
-
Prueba de combinaciones de parámetros de línea media optimizadas para adaptarse a más situaciones de mercado
-
Prueba diferentes tipos de línea media, como VWAP, línea media de banda ancha, etc.
-
Aumentar el volumen de tráfico y evitar falsas brechas
-
Indicadores como el RSI confirman el exceso de compra y venta
-
Establecer mecanismos de detención de pérdidas, tales como detención de movimiento, detención de vibraciones, etc.
-
Unirse a un mecanismo de gestión de posiciones para controlar las posiciones individuales en función del tamaño de los fondos
-
Se puede considerar la optimización de parámetros en combinación con algoritmos de aprendizaje automático
-
Expansión de la estrategia Universe y profundización de las direcciones de inversión de la cartera
Resumir
La estrategia integra el juicio de tendencia de doble línea y el indicador de movimiento MACD, agrega características de forma, y construye una estrategia de negociación a medio plazo relativamente estable. La ventaja central es capturar la dirección de la tendencia principal y evitar ser interrumpido por el ruido del mercado a corto plazo. Pero también hay algunos espacios para la optimización, como el mecanismo de suspensión de pérdidas, la gestión de riesgos, etc. En general, la estrategia tiene un buen valor de referencia como prueba de concepto, pero el descenso en el mercado cerrado aún necesita una prueba completa y un ajuste optimizado.
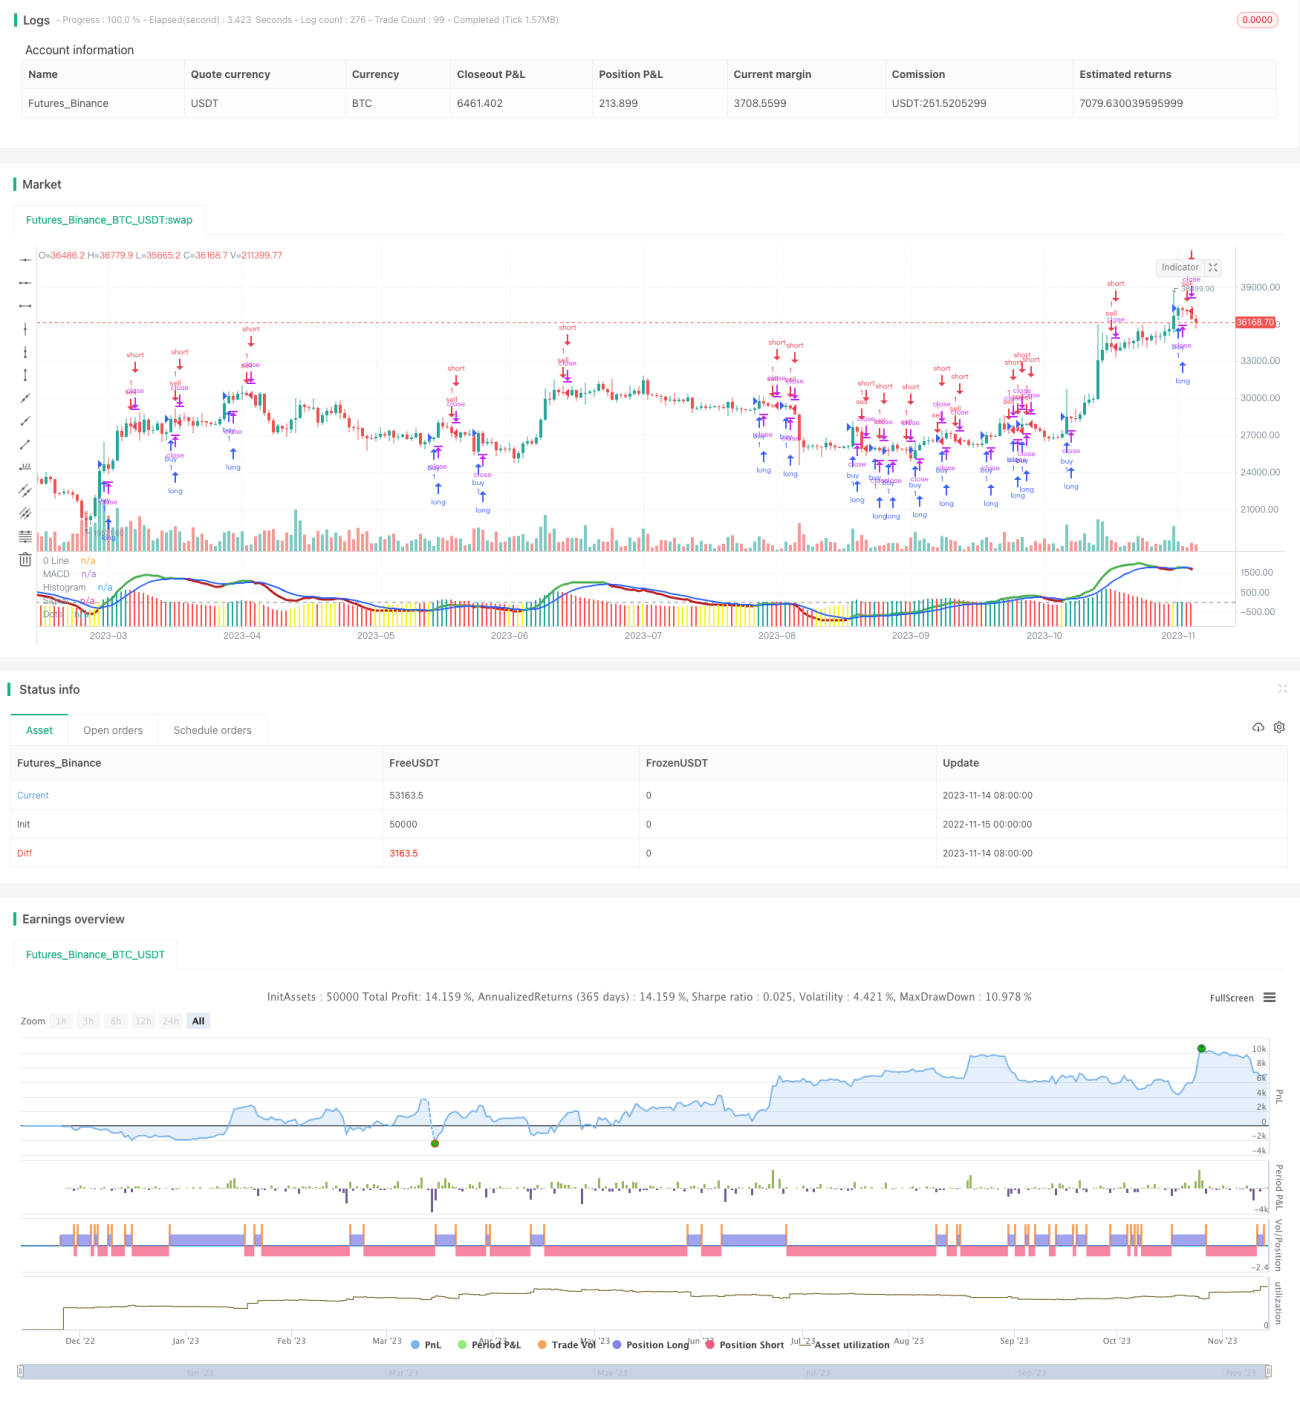
/*backtest
start: 2022-11-15 00:00:00
end: 2023-11-15 00:00:00
period: 1d
basePeriod: 1h
exchanges: [{"eid":"Futures_Binance","currency":"BTC_USDT"}]
*/

//@version=5
strategy(title="Histogram MacD MVP_V2.1", shorttitle="Histogram MacD MVP_2.1")
//Plot Inputs
res = input.timeframe("", "Indicator TimeFrame")- 1