Estrategia de escape de triángulo doble de Moonlight Tracker


Fecha de creación: 2023-11-21 13:49:10 Última modificación: 2023-11-21 13:49:10
Copiar: 0 Número de Visitas: 688
1
Seguir
1617
Seguidores

Estrategia de escape de triángulo doble de Moonlight Tracker

Descripción general

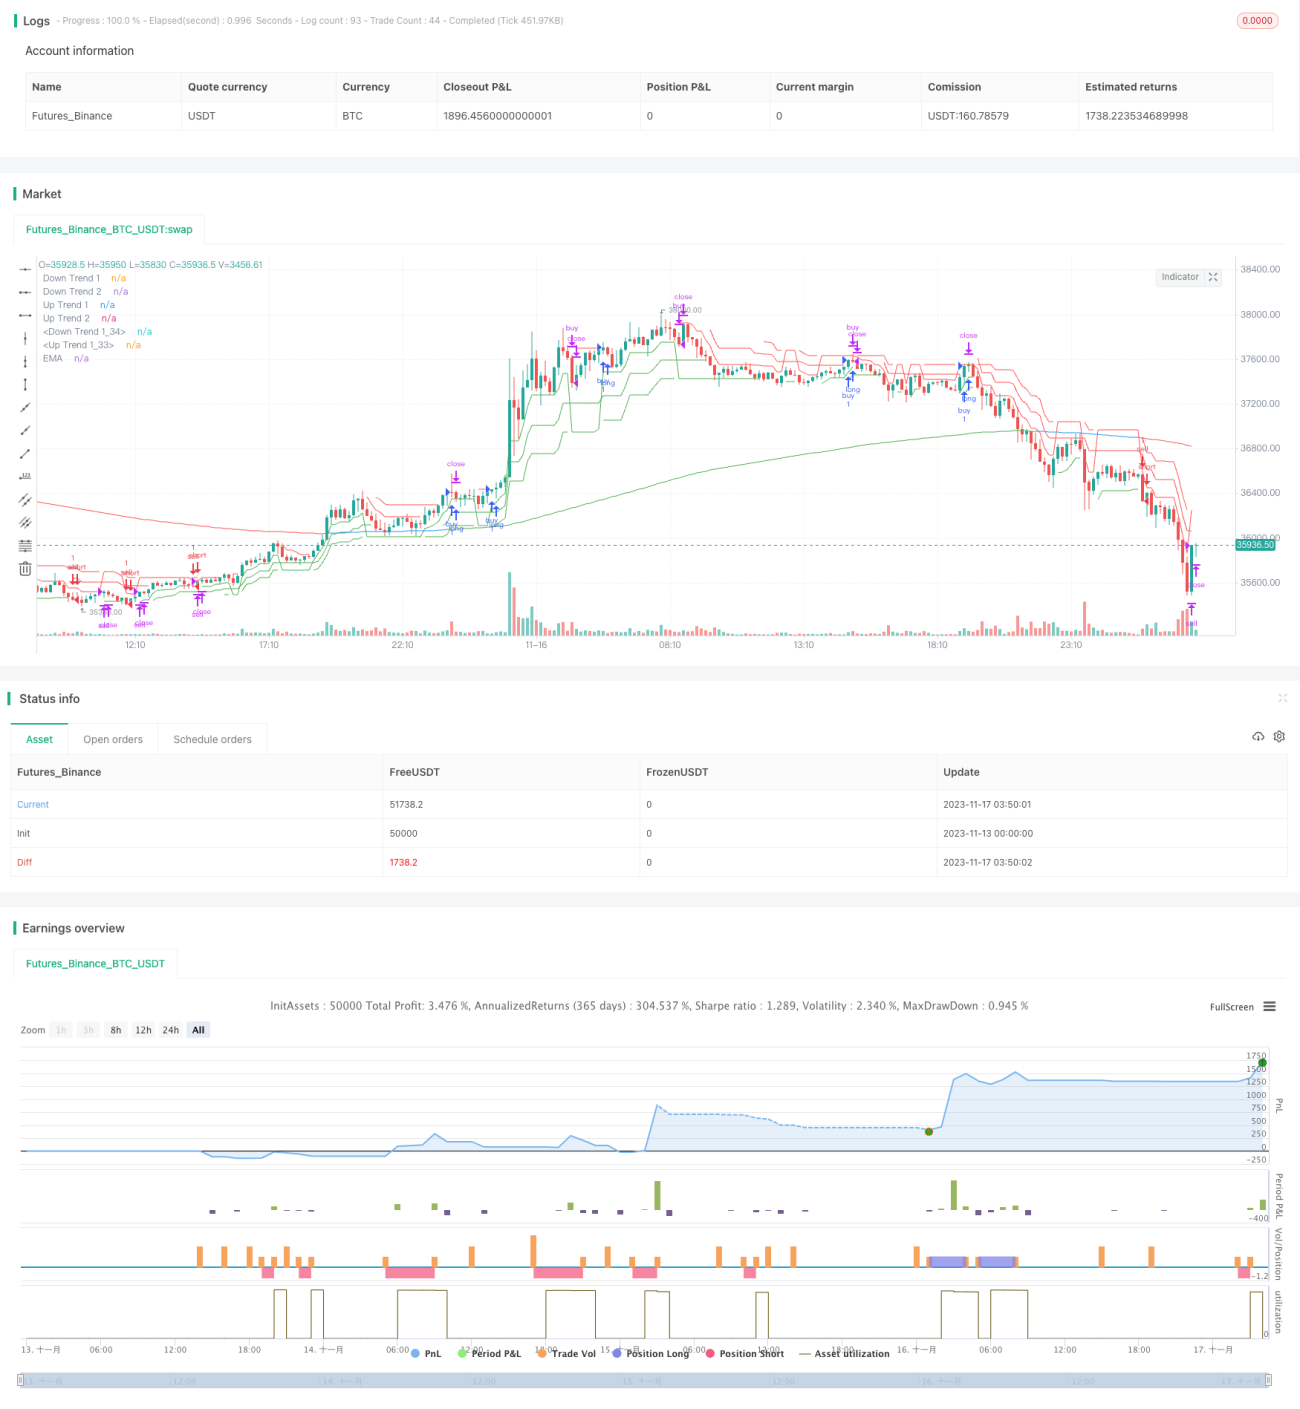
Esta estrategia permite un alto índice de seguimiento de las operaciones de ruptura mediante la construcción de un canal de doble triángulo, combinado con un indicador de tendencia súper para determinar la dirección de la ruptura de precios. La estrategia combina al mismo tiempo la determinación de la tendencia general del mercado por parte de la EMA, para evitar operaciones ineficaces en situaciones de crisis.

Principio de estrategia

  1. Construir un indicador de tendencias súper de tres parámetros diferentes para determinar la dirección de la tendencia de los precios a corto, medio y largo plazo.

  2. El canal de doble triángulo determina si el precio ha roto el canal ascendente o descendente, como señal de entrada y salida de la lista.

  3. Combinando los EMA de 233 ciclos para determinar la dirección de la tendencia general, el precio necesita hacer más para romper el canal ascendente en el mercado de múltiples EMA, y el mercado de cabezas vacías para romper el canal descendente.

  4. Juzga las señales de parada y pérdida a través de la combinación de tres indicadores de tendencia súper. Cuando más de dos indicadores cambian de color, la posición se detiene o se detiene.

Ventajas estratégicas

  1. El canal de doble triángulo combinado con el juicio de múltiples períodos de tiempo permite capturar con precisión las rupturas de tendencia.

  2. Las condiciones de selección múltiple evitan que las transacciones no sean válidas y aumentan la probabilidad de ganar.

  3. El seguimiento dinámico de la parada de pérdidas reduce el riesgo de retiro.

  4. La configuración de los parámetros es simple y fácil de usar.

Riesgo y optimización de la estrategia

  1. En los mercados con grandes ciclos de volatilidad, es posible que se abran posiciones con frecuencia y luego se detengan las pérdidas. Se puede ajustar adecuadamente el parámetro de ciclo ATR para reducir la frecuencia de apertura de posiciones.

  2. Si la EMA es demasiado corta, no se puede determinar la tendencia general, y si es demasiado larga, el seguimiento no es sensible. Se recomienda la prueba para determinar los parámetros óptimos de la EMA.

  3. El nivel de stop loss no puede seguir dinámicamente los cambios en la amplitud de las fluctuaciones del mercado y requiere un ajuste de intervención manual. Posteriormente, se puede considerar combinar el ajuste dinámico de la distancia de stop loss con el ATR.

Resumir

La estrategia de brecha de doble triángulo de Moonlight Tracker permite la captura precisa de brechas fuertes a través de la combinación de indicadores de tendencia súper y canales de doble triángulo. Al mismo tiempo, el mecanismo de filtración en varios niveles puede filtrar señales ineficaces y tiene una mayor ganancia. La configuración simple de los parámetros también lo hace fácil de usar.

Código Fuente de la Estrategia
/*backtest
start: 2023-11-13 00:00:00
end: 2023-11-17 04:00:00
period: 10m
basePeriod: 1m
exchanges: [{"eid":"Futures_Binance","currency":"BTC_USDT"}]
*/

// @version=5
// author=theasgard and moonshot-indicator (ms)
// year 2021
//
// This is a well knowen strategy by using 3 different Supertrends and a trend-defining EMA,
// feel free to play around with the settings, a backtest on 8h ETHUSDT pair brought some good results using 
// the 233EMA and investing 75% of a 10k start capital
//
// the idea is to have at least 2 supertrnds going green above the trend-EMA to go long and exit by turning 
// 2 supertrends red (idea: 1 supertrend in red could initialize a take profit)
// shorts work vice versa
// The EMA shows in green for uptrends and in red for downtrends, if it is blue no Signal will be taken because 
// the 3 supertrends are not all above or below the trendline(EMA)

strategy("ms hypertrender", overlay=true)

// set up 3 supertrendlines and colour the direction up/down
atrPeriod1 = input(10, "ATR Length 1")
factor1 = input.float(1.0, "ATR Factor 1", step = 0.01)
[supertrend1, direction1] = ta.supertrend(factor1, atrPeriod1)
upTrend1 = plot(direction1 < 0 ? supertrend1 : na, "Up Trend 1", color = color.green, style=plot.style_linebr)
downTrend1 = plot(direction1 < 0? na : supertrend1, "Down Trend 1", color = color.red, style=plot.style_linebr)

atrPeriod2 = input(11, "ATR Length 2")
factor2 = input.float(2.0, "ATR Factor 2", step = 0.01)
[supertrend2, direction2] = ta.supertrend(factor2, atrPeriod2)
upTrend2 = plot(direction2 < 0 ? supertrend2 : na, "Up Trend 2", color = color.green, style=plot.style_linebr)
downTrend2 = plot(direction2 < 0? na : supertrend2, "Down Trend 2", color = color.red, style=plot.style_linebr)

atrPeriod3 = input(12, "ATR Length 3")
factor3 = input.float(3.0, "ATR Factor 3", step = 0.01)
[supertrend3, direction3] = ta.supertrend(factor3, atrPeriod3)
upTrend3 = plot(direction3 < 0 ? supertrend3 : na, "Up Trend 1", color = color.green, style=plot.style_linebr)
downTrend3 = plot(direction3 < 0? na : supertrend3, "Down Trend 1", color = color.red, style=plot.style_linebr)

//set up the trend dividing EMA and color uptrend nutreal downtrend
len = input.int(233, minval=1, title="Trend-EMA Length")
src = input(close, title="Source")
offset = input.int(title="Offset", defval=0, minval=-500, maxval=500)

//general Bull or Bear Trend? Visualized by ema
ematrend = ta.ema(src, len)
generaluptrend = supertrend1 > ematrend and supertrend2 > ematrend and supertrend3 > ematrend
generaldowntrend = supertrend1 < ematrend and supertrend2 < ematrend and supertrend3 < ematrend
emacolor = if generaluptrend
    color.green
else if generaldowntrend
    color.red
else
    color.blue
plot(ematrend, title="EMA", color=emacolor, offset=offset)

// Bullish? min 2 supertrends green
bullish = (direction1 < 0 and direction2 < 0) or (direction1 < 0 and direction3 < 0) or (direction2 < 0 and direction3 < 0) and generaluptrend
extremebullish = direction1 < 0 and direction2 < 0 and direction3 < 0 and generaluptrend //all 3 green

// Bearish? min 2 supertrends red
bearish = (direction1 > 0 and direction2 > 0) or (direction1 > 0 and direction3 > 0) or (direction2 > 0 and direction3 > 0) and generaldowntrend
extremebearish = direction1 > 0 and direction2 > 0 and direction3 > 0 and generaldowntrend //all 3 red

// Open Long
//plotchar(((bullish and not bullish[1]) or (extremebullish and not extremebullish[1])) and (emacolor==color.green)? close : na, title = 'Start Long', char='▲', color = #80eb34, location = location.belowbar, size = size.small)

// TP 10% Long
TP10long = ((generaluptrend and bullish[1]) or (generaluptrend and extremebullish[1])) and (direction1 > 0 or direction2 > 0 or direction3 > 0)
//plotchar(TP10long and not TP10long[1]? close : na, title = 'TP on Long', char='┼', color = #ffd000, location = location.abovebar, size = size.tiny)

// Exit Long
//plotchar(extremebearish and not extremebearish[1] or bearish and not bearish[1]? close : na, title = 'Close all Longs', char='Ꭓ', color = #ff0037, location = location.abovebar, size = size.tiny)

// Open Short
//plotchar(((bearish and not bearish[1]) or (extremebearish and not extremebearish[1])) and (emacolor==color.red)? close : na, title = 'Start Short', char='▼', color = #0547e3, location = location.abovebar, size = size.small)

// TP 10% Short
TP10short = ((generaldowntrend and bearish[1]) or (generaldowntrend and extremebearish[1])) and (direction1 < 0 or direction2 < 0 or direction3 < 0)
//plotchar(TP10short and not TP10short[1]? close : na, title = 'TP on Short', char='┼', color = #ffd000, location = location.belowbar, size = size.tiny)

// Exit Short
//plotchar(extremebullish and not extremebullish[1] or bullish and not bullish[1]? close : na, title = 'Close all Shorts', char='Ꭓ', color = #ff0037, location = location.belowbar, size = size.tiny)

// Set stop loss level with input options (optional)
longLossPerc = input.float(title="Long Stop Loss (%)",
     minval=0.0, step=0.1, defval=1) * 0.01

shortLossPerc = input.float(title="Short Stop Loss (%)",
     minval=0.0, step=0.1, defval=1) * 0.01
     
// Determine stop loss price
longStopPrice  = strategy.position_avg_price * (1 - longLossPerc)
shortStopPrice = strategy.position_avg_price * (1 + shortLossPerc)

openlong = (((bullish and not bullish[1]) or (extremebullish and not extremebullish[1])) and (emacolor==color.green))
openshort = (((bearish and not bearish[1]) or (extremebearish and not extremebearish[1])) and (emacolor==color.red))
exitlong = (extremebearish and not extremebearish[1] or bearish and not bearish[1]) or TP10long
exitshort = (extremebullish and not extremebullish[1] or bullish and not bullish[1]) or TP10short
strategy.entry("buy", strategy.long, when=openlong)
strategy.entry("sell", strategy.short, when=openshort)

strategy.close("buy", when=exitlong)
strategy.close("sell", when=exitshort)

// Submit exit orders based on calculated stop loss price
if (strategy.position_size > 0)
    strategy.exit(id="Long Stop", stop=longStopPrice)

if (strategy.position_size < 0)
    strategy.exit(id="Short Stop", stop=shortStopPrice)