Estrategia de seguimiento de tendencias con indicador Williams de EMA doble

Descripción general
La estrategia combina el indicador de doble EMA y el indicador de Williams para identificar la dirección de la tendencia y hacer un seguimiento cuando la tendencia es fuerte. Su idea básica es:
- Filtrando las tendencias más fuertes con combinaciones de doble EMA
- El índice Williams confirma que se encuentra en zona de sobreventa
- Combinado con el indicador RSI, evita los altibajos
El principio
La estrategia utiliza el EMA a corto plazo y el EMA a largo plazo en los dos EMA. Cuando el EMA a corto plazo se eleva cruzando el EMA a largo plazo se genera una señal de compra y el EMA a corto plazo se eleva cruzando el EMA a largo plazo se genera una señal de venta.
Además, la estrategia también se combina con el indicador Williams para identificar reversiones. El indicador Williams determina si el precio está sobrecomprado o sobrevendido mediante la determinación de los máximos y mínimos periódicos. Cuando el indicador Williams muestra sobrecompra, genera una señal de venta; cuando muestra sobreventa, genera una señal de compra.
En el código, la lógica de juicio es:
Entrada múltiple: el EMA a corto plazo atraviesa el EMA a mediano plazo y el EMA a largo plazo, y el indicador Williams muestra una zona de sobreventa y forma un mínimo en la zona de sobreventa, lo que indica una oportunidad de reversión, en este momento se genera una señal de compra.
Entrada en blanco: el EMA corto atraviesa el EMA intermedio y el EMA largo, y el indicador Williams muestra zonas de sobrecompra, y en las zonas de sobreventa se forma el punto más alto, lo que indica una oportunidad de reversión, en este momento se produce una señal de venta.
Además, la estrategia incluye el indicador RSI para confirmar aún más las señales de negociación y evitar la persecución ciega de las caídas.
Las ventajas
La mayor ventaja de esta estrategia es que utiliza el doble EMA para filtrar una gran cantidad de tendencias no válidas, y solo selecciona las tendencias de mediano y largo plazo más fuertes para seguirlas, lo que filtra el ruido y reduce las transacciones no válidas.
Además, la introducción del indicador Williams también tiene un efecto muy bueno. La primera es la capacidad de identificar oportunidades de reversión y así cerrar posiciones a tiempo; la segunda es la capacidad de confirmar aún más la eficacia de las señales de tendencia.
El uso combinado de doble EMA y Willams permite a la estrategia obtener buenas ganancias de seguimiento en variedades a medio y largo plazo, al tiempo que permite identificar reveses y limitar las pérdidas.
El riesgo
El principal riesgo de esta estrategia es la dificultad para identificar el punto de reversión de la tendencia. A pesar de la introducción del indicador Williams y el indicador RSI para asegurar la eficacia de la inversión, la dificultad de la inversión sigue siendo grande y no se puede evitar por completo el riesgo de seguir la caída.
Además, la propia combinación de dos EMAs presenta un cierto retraso. También puede presentar cierta dificultad para la estrategia de identificación cuando las tendencias a corto plazo y las tendencias a medio y largo plazo se desconectan.
Optimización
La estrategia puede ser optimizada en los siguientes aspectos:
-
Prueba más combinaciones de EMA para encontrar mejores parámetros
-
Aumentar el mecanismo de salida de adaptación, utilizando indicadores como el ATR y el índice de volatilidad para determinar la reversión de la tendencia
-
Añadir elementos de aprendizaje automático para hacer predicciones de tendencias y reversiones con LSTM
-
La teoría de las ondas y otros métodos para mejorar las reglas de inversión
-
Introducción de la gestión de posiciones adaptable, adaptando el tamaño de las posiciones a las condiciones del mercado
Resumir
Esta estrategia combina con éxito el doble EMA y el indicador de Williams para capturar tendencias a medio y largo plazo y obtener mayores ganancias en las grandes tendencias. Al mismo tiempo, la introducción del indicador de Williams también permite a la estrategia identificar reveses y detener los pérdidas a tiempo.
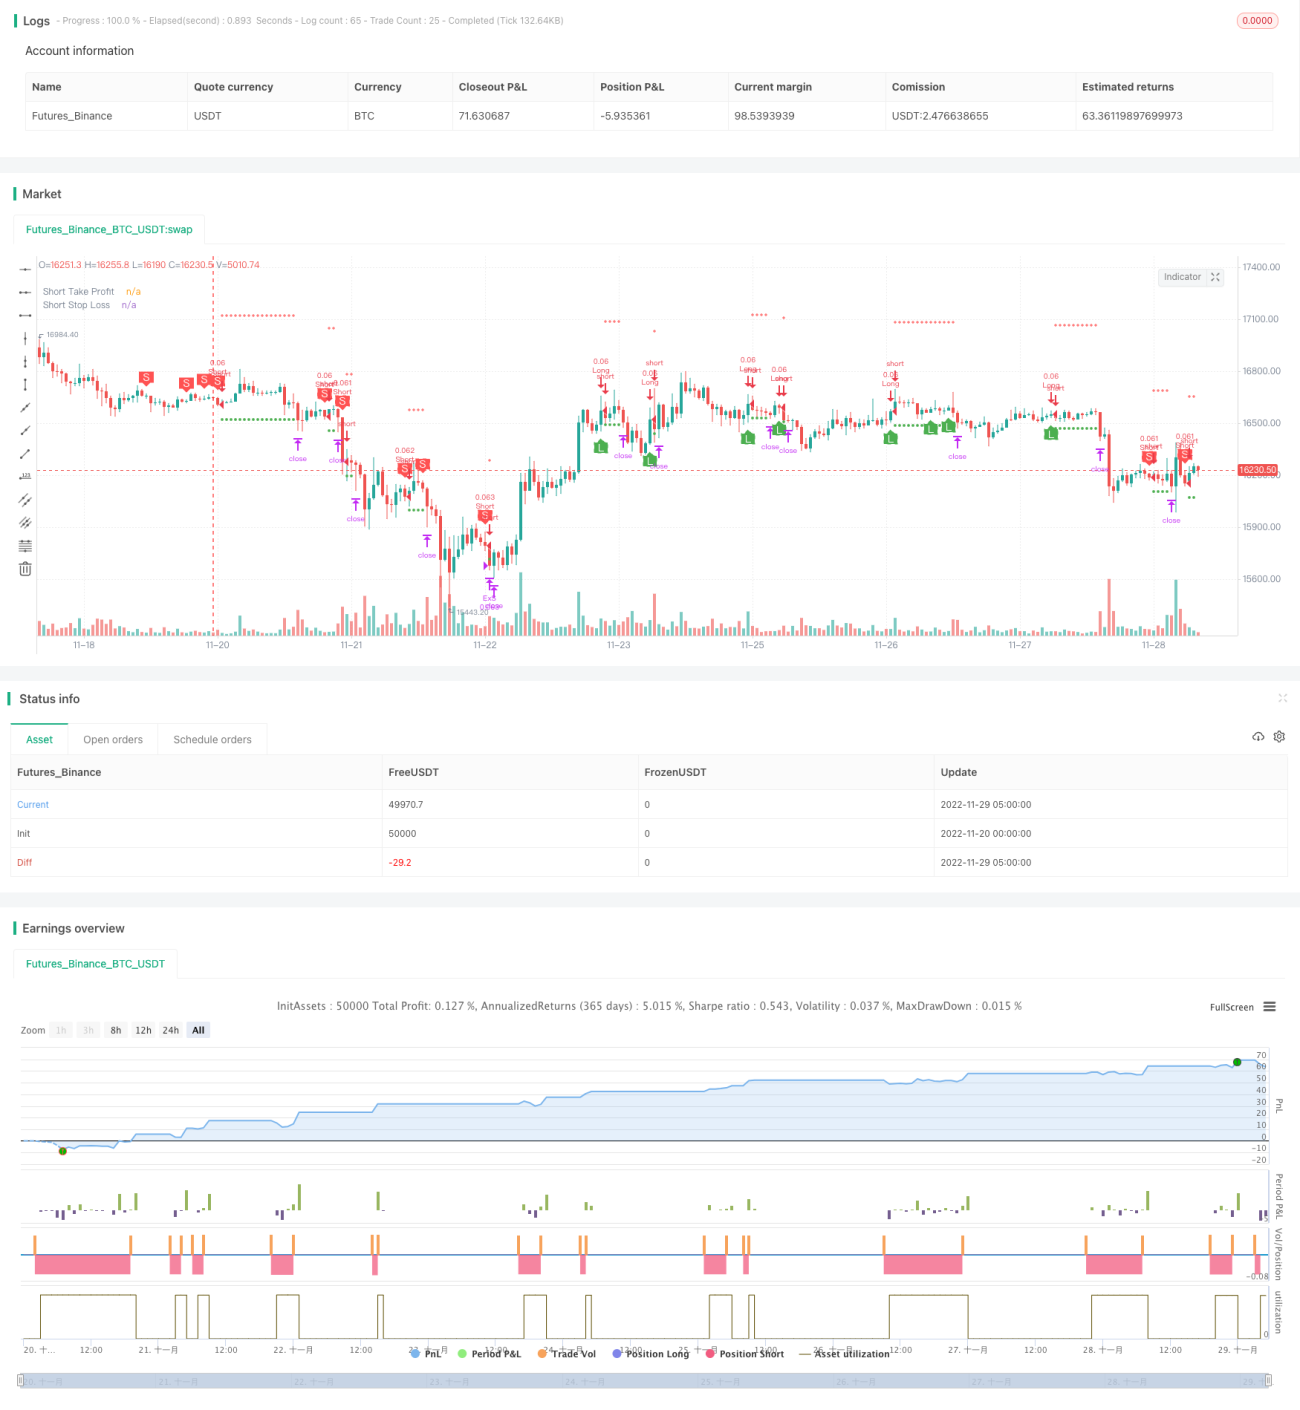
/*backtest
start: 2022-11-20 00:00:00
end: 2022-11-29 05:20:00
period: 1h
basePeriod: 15m
exchanges: [{"eid":"Futures_Binance","currency":"BTC_USDT"}]
*/

// This source code is subject to the terms of the Mozilla Public License 2.0 at https://mozilla.org/MPL/2.0/
// © B_L_A_C_K_S_C_O_R_P_I_O_N
// v 1.1
- 1