Estrategia de ruptura de supertendencias entre marcos temporales
Descripción general
La estrategia combina el indicador de tendencia súper con el indicador de la banda de Brin en varios marcos temporales, identifica la dirección de la tendencia y los puntos de resistencia de soporte clave, realiza entradas en el momento de una ruptura de temblor y se basa en posiciones de salida cruzadas. La estrategia se aplica principalmente a las variedades de futuros de mercancías con alta volatilidad, como el oro, la plata, el petróleo crudo, etc.
Principio de estrategia
Función de tendencia súper multi-marco de tiempo personalizado basado en Pine Scriptpine_supertrend(), combinando diferentes períodos (por ejemplo, 1 minuto y 5 minutos) para determinar la dirección de la tendencia del gran ciclo.
Al mismo tiempo, se calcula el descenso de la banda de Brin y se hace un juicio de ruptura de canal. Cuando el precio rompe la banda de Brin y se pone en trayectoria, se considera que está en una ruptura de la bolsa; cuando el precio cae por debajo de la banda de Brin, se considera una ruptura de la bajista.
Las señales estratégicas:
Señales múltiples: precio de cierre > Brin se pone en marcha y precio de cierre > Indicador de tendencia súper de marco de tiempo múltiple Señales de cabeza hueca: precio de cierre < la banda de Brin baja y precio de cierre < indicador de tendencia súper de marco de tiempo múltiple
Separar el daño:
Detención múltiple: precio de cierre < 5 minutos indicador de tendencia súper Detención en blanco: precio de cierre > indicador de tendencia súper de 5 minutos
Por lo tanto, la estrategia capta la resonancia entre el indicador de tendencia súper y el indicador de la banda de Brin para procesar transacciones en situaciones de alta volatilidad.
Análisis de las ventajas
- Utiliza el indicador de tendencias súper de marcos temporales para determinar la dirección de la tendencia de ciclo grande y mejorar la calidad de la señal
- La cinta de Brin en la vía baja actúa como un punto de resistencia de soporte clave para reducir la falsa ruptura.
- Indicadores de tendencia súper como punto de parada, reducción de pérdidas y control de riesgos
Análisis de riesgos
- Los indicadores de tendencia súper están rezagados y pueden haber perdido el punto de reversión de la tendencia
- La configuración incorrecta de los parámetros de la banda de Bryn puede causar operaciones demasiado frecuentes o demasiado perdidas
- Los precios de los futuros de las mercancías fluctúan fuertemente en el mercado nocturno o en caso de eventos importantes y son propensos a sufrir pérdidas
La solución al riesgo:
- Combinación de varias señales auxiliares para evitar falsas brechas
- Optimización de los parámetros de la banda de Bryn para encontrar el punto de equilibrio óptimo
- Ajuste de la posición de parada para ampliar la distancia de parada
Dirección de optimización
- Intentar otros indicadores de tendencia, como KDJ, MACD, etc., como ayuda para el juicio
- Aumentar la probabilidad de juicio de los modelos de aprendizaje automático como ayuda
- Optimización de parámetros para encontrar la combinación óptima de hiperparámetros
Resumir
La estrategia integra las supertendencias con dos indicadores de alta eficiencia de la banda de Brin para lograr un manejo de alta probabilidad a través del análisis de marcos temporales y el juicio de ruptura de canales. La estrategia controla eficazmente el riesgo de los fondos y confirma que se pueden obtener mejores rendimientos en variedades de alta volatilidad.
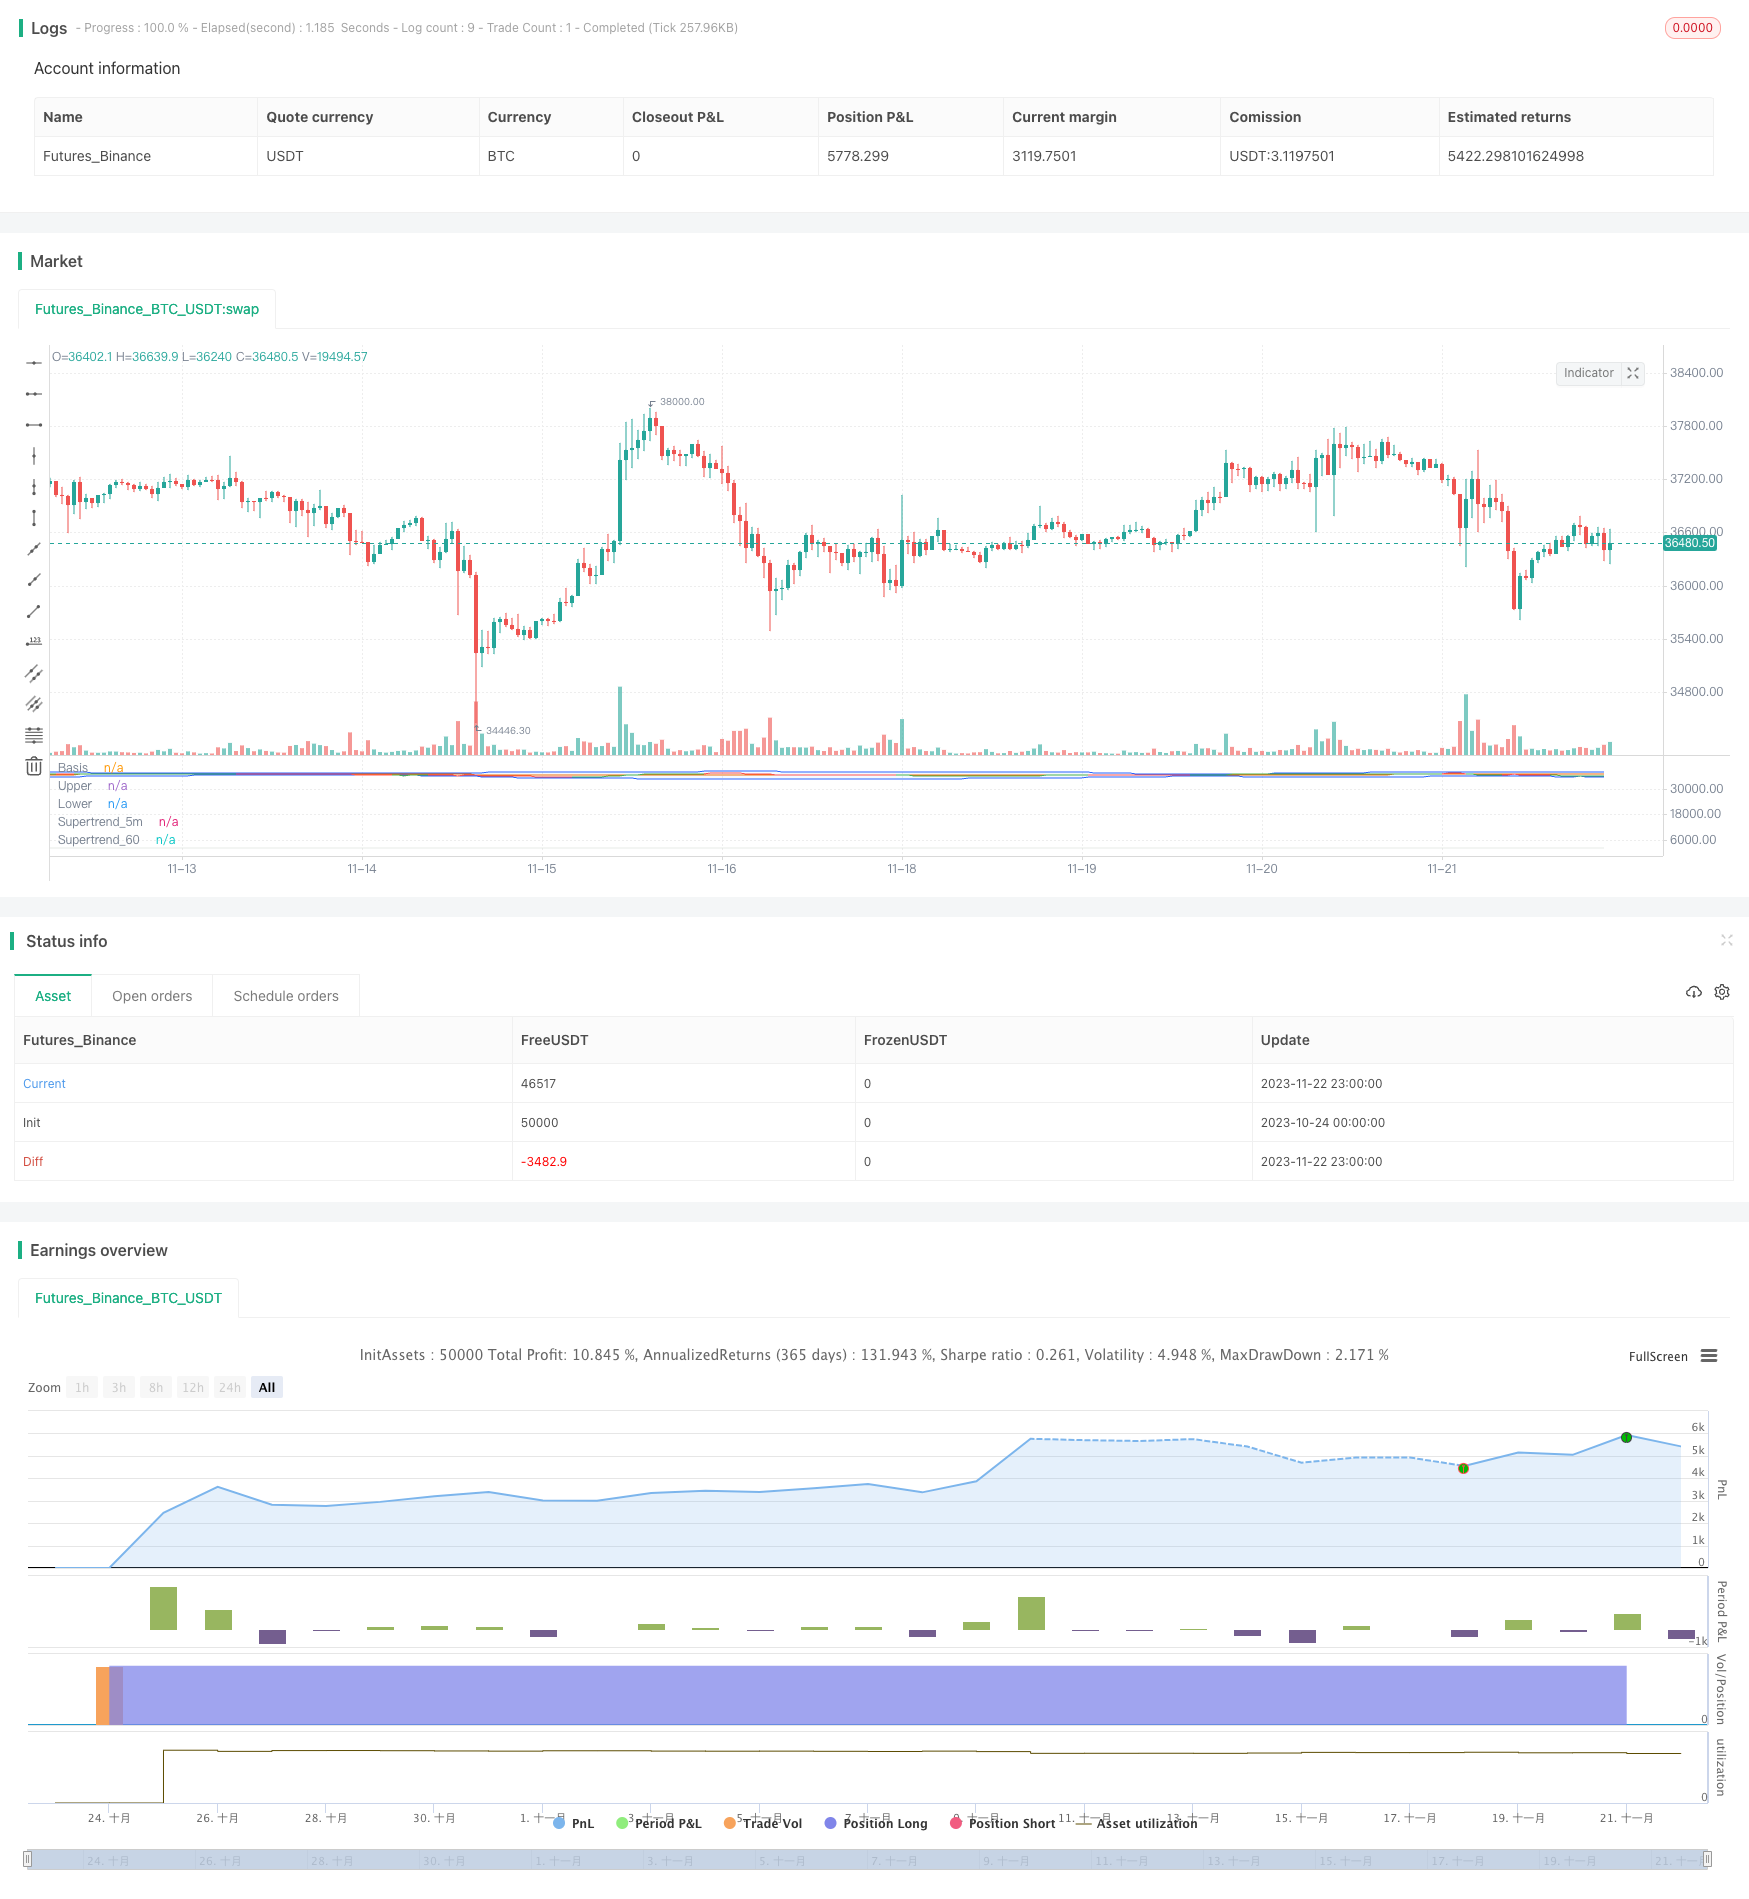
/*backtest
start: 2023-10-24 00:00:00
end: 2023-11-23 00:00:00
period: 1h
basePeriod: 15m
exchanges: [{"eid":"Futures_Binance","currency":"BTC_USDT"}]
*/

// This source code is subject to the terms of the Mozilla Public License 2.0 at https://mozilla.org/MPL/2.0/
// © ambreshc95

//@version=5
strategy("Comodity_SPL_Strategy_01", overlay=false)

// function of st
// [supertrend, direction] = ta.supertrend(3, 10)
// plot(direction < 0 ? supertrend : na, "Up direction", color = color.green, style=plot.style_linebr)
// plot(direction > 0 ? supertrend : na, "Down direction", color = color.red, style=plot.style_linebr)

// VWAP
// src_vwap = input(title = "Source", defval = hlc3, group="VWAP Settings")
// [_Vwap,stdv,_] = ta.vwap(src_vwap,false,1)
// plot(_Vwap, title="VWAP", color = color.rgb(0, 0, 0))


// The same on Pine Script®
pine_supertrend(factor, atrPeriod,len_ma) =>

    h= ta.sma(high,len_ma)
    l= ta.sma(low,len_ma)
    hlc_3 = (h+l)/2
    src = hlc_3
    atr = ta.atr(atrPeriod)
    upperBand = src + factor * atr
    lowerBand = src - factor * atr
    prevLowerBand = nz(lowerBand[1])
    prevUpperBand = nz(upperBand[1])

    lowerBand := lowerBand > prevLowerBand or close[1] < prevLowerBand ? lowerBand : prevLowerBand
    upperBand := upperBand < prevUpperBand or close[1] > prevUpperBand ? upperBand : prevUpperBand
    int direction = na
    float superTrend = na
    prevSuperTrend = superTrend[1]
    if na(atr[1])
        direction := 1
    else if prevSuperTrend == prevUpperBand
        direction := close > upperBand ? -1 : 1
    else
        direction := close < lowerBand ? 1 : -1
    superTrend := direction == -1 ? lowerBand : upperBand
    [superTrend, direction]
len_ma_given = input(75, title="MA_SMA_ST")
[Pine_Supertrend, pineDirection] = pine_supertrend(3, 10,len_ma_given)
// plot(pineDirection < 0 ? Pine_Supertrend : na, "Up direction", color = color.green, style=plot.style_linebr)
// plot(pineDirection > 0 ? Pine_Supertrend : na, "Down direction", color = color.red, style=plot.style_linebr)
//
// Define Supertrend parameters
atrLength = input(10, title="ATR Length")
factor = input(3.0, title="Factor")

// // Calculate Supertrend
[supertrend, direction] = ta.supertrend(factor, atrLength)

st_color = supertrend > close ? color.red : color.green
// // Plot Supertrend
// plot(supertrend, "Supertrend", st_color)
//

// BB Ploting
length = input.int(75, minval=1)
maType = input.string("SMA", "Basis MA Type", options = ["SMA", "EMA", "SMMA (RMA)", "WMA", "VWMA"])
src = input(close, title="Source")
mult = input.float(2.5, minval=0.001, maxval=50, title="StdDev")

ma(source, length, _type) =>
    switch _type
        "SMA" => ta.sma(source, length)
        "EMA" => ta.ema(source, length)
        "SMMA (RMA)" => ta.rma(source, length)
        "WMA" => ta.wma(source, length)
        "VWMA" => ta.vwma(source, length)

basis = ma(src, length, maType)
dev = mult * ta.stdev(src, length)
upper = basis + dev
lower = basis - dev
offset = input.int(0, "Offset", minval = -500, maxval = 500)
plot(basis, "Basis", color=#FF6D00, offset = offset)
p1 = plot(upper, "Upper", color=#2962FF, offset = offset)
p2 = plot(lower, "Lower", color=#2962FF, offset = offset)
fill(p1, p2, title = "Background", color=color.rgb(33, 150, 243, 95))


// h= ta.sma(high,60)
// l= ta.sma(low,60)
// c= sma(close,60)
// hlc_3 = (h+l)/2
// supertrend60 = request.security(syminfo.tickerid,  supertrend)

// // Define timeframes for signals
tf1 = input(title="Timeframe 1", defval="1")
tf2 = input(title="Timeframe 2",defval="5")
// tf3 = input(title="Timeframe 3",defval="30")


// // // Calculate Supertrend on multiple timeframes
supertrend_60 = request.security(syminfo.tickerid, tf1, Pine_Supertrend)
supertrend_5m = request.security(syminfo.tickerid, tf2, supertrend)
// supertrend3 = request.security(syminfo.tickerid, tf3, supertrend)

// // Plot Supertrend_60
st_color_60 = supertrend_60 > close ? color.rgb(210, 202, 202, 69) : color.rgb(203, 211, 203, 52)
plot(supertrend_60, "Supertrend_60", st_color_60)

// // Plot Supertrend_5m
st_color_5m = supertrend_5m > close ? color.red : color.green
plot(supertrend_5m, "Supertrend_5m", st_color_5m)


ma21 = ta.sma(close,21)
// rsi = ta.rsi(close,14)
// rsima = ta.sma(rsi,14)

// Define the Indian Standard Time (IST) offset from GMT
ist_offset = 5.5 // IST is GMT+5:30

// Define the start and end times of the trading session in IST
// start_time = timestamp("GMT", year, month, dayofmonth, 10, 0) + ist_offset * 60 * 60
// end_time = timestamp("GMT", year, month, dayofmonth, 14, 0) + ist_offset * 60 * 60
// Check if the current time is within the trading session
// in_trading_session = timenow >= start_time and timenow <= end_time

in_trading_session = not na(time(timeframe.period, "0945-1430"))
// bgcolor(inSession ? color.silver : na)
out_trading_session = not na(time(timeframe.period, "1515-1530"))
// // // Define buy and sell signals
buySignal = close>upper and close > supertrend_5m and close > supertrend_60 and close > ma21  and in_trading_session //close > supertrend and
sellSignal = close<lower and close < supertrend_5m and close < supertrend_60 and close < ma21  and in_trading_session //close < supertrend and

var bool long_position = false
var bool long_exit = false
var float long_entry_price = 0
var float short_entry_price = 0

if buySignal and not long_position
    // label.new(bar_index, na, yloc = yloc.belowbar, style = label.style_label_up, color = color.green, size = size.small)
    long_position := true
    strategy.entry("Buy",strategy.long)

long_exit := (close < supertrend_5m)
if long_position and long_exit
    // label.new(bar_index, na, yloc = yloc.belowbar, style = label.style_xcross, color = color.green, size = size.tiny)
    long_position := false
    strategy.exit("Exit","Buy",stop = close)

var bool short_position = false
var bool short_exit = false
if sellSignal and not short_position
    // label.new(bar_index, na, yloc = yloc.abovebar, style = label.style_label_down, color = color.red, size = size.small)
    short_position := true
    strategy.entry("Sell",strategy.short)

short_exit := (close > supertrend_5m)
if short_position and short_exit
    // label.new(bar_index, na, yloc = yloc.belowbar, style = label.style_xcross, color = color.red, size = size.tiny)
    short_position := false
    strategy.exit("Exit","Sell", stop = close)

if out_trading_session
    long_position := false
    strategy.exit("Exit","Buy",stop = close)
    short_position := false
    strategy.exit("Exit","Sell", stop = close)

// if long_position
//     long_entry_price := close[1] + 50//bar_index

// if short_position
//     short_entry_price := close[1] - 50//bar_index

// if (long_position and high[1] > long_entry_price)
//     label.new(bar_index, na, yloc = yloc.abovebar, style = label.style_triangledown, color = color.yellow, size = size.tiny)

// if (short_position and low[1] < short_entry_price)
//     label.new(bar_index, na, yloc = yloc.belowbar, style = label.style_triangleup, color = color.yellow, size = size.tiny)