Estrategia de supertendencia basada en ATR y trailing stop


Fecha de creación: 2023-11-28 14:56:59 Última modificación: 2023-11-28 14:56:59
Copiar: 0 Número de Visitas: 939
1
Seguir
1617
Seguidores

Estrategia de supertendencia basada en ATR y trailing stop

Descripción general

Esta estrategia diseña una línea de parada móvil y una línea de reversión basada en el indicador de la amplitud de fluctuación real promedio (ATR). Se trata de una línea de parada móvil y una línea de reversión trailing stop loss, es decir, que se ajusta a la línea de parada trailing dependiendo de los cambios en el precio. En concreto, si el precio cambia más del 1%, la línea de parada se mueve en una proporción fija hacia la dirección de las ganancias.

Principio de estrategia

La estrategia utiliza el indicador ATR para calcular la línea de parada. La fórmula específica es la siguiente:

atr = multplierFactor * atr(barsBack)

longStop = hl2 - atr 
shortStop = hl2 + atr

El factor multiplicador es el coeficiente de amplificación de ATR, y el barback es el número de ciclos de ATR. Cuanto mayor es el valor de ATR, mayor es la volatilidad del mercado.

Se calcula una línea de parada larga (longStop) y una línea de parada corta (shortStop) en función del valor de ATR. Se emite una señal de negociación cuando el precio supera estas dos líneas.

Además, la estrategia introduce una variable de dirección para determinar la dirección de la tendencia:

direction = 1
direction := nz(direction[1], direction) 
direction := direction == -1 and close > shortStopPrev ? 1 : direction == 1 and close < longStopPrev ? -1 : direction

Si la dirección es 1 significa que está en una tendencia de más cabeza, si la dirección es -1 significa que está en una tendencia de cabeza en blanco.

La línea de pérdida se dibuja en diferentes colores según el valor de la variable de dirección:

if (direction == 1)
    valueToPlot := longStop
    colorToPlot := color.green 
else
    valueToPlot := shortStop
    colorToPlot := color.red

Esto permite ver claramente la dirección de la tendencia actual y la posición de la línea de parada.

Mecanismo de seguimiento de pérdidas

El punto clave de la estrategia es la introducción de un mecanismo de seguimiento de los estancamientos, que permite ajustar los estancamientos en tiempo real según el funcionamiento del precio.

La lógica es la siguiente:

strategyPercentege = (close - updatedEntryPrice) / updatedEntryPrice * 100.00
rideUpStopLoss = hasOpenTrade() and strategyPercentege > 1

if (rideUpStopLoss) 
    stopLossPercent := stopLossPercent + strategyPercentege - 1.0
    newStopLossPrice = updatedEntryPrice + (updatedEntryPrice * stopLossPercent) / 100
    stopLossPrice := max(stopLossPrice, newStopLossPrice)
    updatedEntryPrice := stopLossPrice

Si el precio sube más del 1% con respecto al precio de entrada, se rastrea hacia arriba para ajustar la línea de parada. La parte de la amplitud de ajuste es de más del 1%.

Esto permite asegurar más ganancias y reducir las pérdidas.

Análisis de las ventajas

La mayor ventaja de esta estrategia frente a la tradicional estrategia de stop loss móvil es que puede ajustar la línea de stop loss de forma dinámica según las condiciones del mercado. Las ventajas concretas son las siguientes:

  1. El objetivo de esta estrategia es lograr un mayor bloqueo de ganancias en situaciones de tendencia.

El mecanismo de seguimiento de la parada permite que la línea de parada se mueva constantemente hacia la dirección de las ganancias, lo que permite bloquear ganancias más altas si el mercado continúa siendo fuerte.

  1. El bloqueo puede reducir los saltos de liquidación.

Las líneas de pérdidas móviles fijas se saltan fácilmente cuando las tendencias del mercado cambian. La línea de pérdidas de esta estrategia se basa en la volatilidad del mercado y se puede seguir razonablemente los cambios en los precios para evitar que se salten las pérdidas en la liquidación.

  1. Se trata de una herramienta sencilla y fácil de automatizar.

La estrategia se basa completamente en el cálculo de indicadores, sin una lógica de juicio de tendencias compleja. Se puede automatizar el comercio de manera muy simple.

  1. Parámetros personalizables para diferentes variedades

Los parámetros como el ciclo ATR, el factor de amplificación y la amplitud de parada pueden ser personalizados y optimizados para diferentes variedades, lo que hace que la estrategia sea más universal.

Análisis de riesgos

A pesar de las ventajas de esta estrategia, hay que tener en cuenta los siguientes riesgos:

  1. No se puede determinar el punto de inflexión de la tendencia, existe el riesgo de perseguir el alza o la caída

La estrategia no determina si la tendencia terminará o no. En el final de un mercado alcista, es fácil que se produzca un seguimiento de las altas y bajas.

  1. Los parámetros mal configurados pueden aumentar las pérdidas

Si el parámetro de ATR es demasiado corto, la línea de parada puede ser demasiado sensible y puede ser activada por el uso frecuente de la oscilación.

  1. El riesgo de que el rebote de la transcripción se detenga

La estrategia no considera los puntos de clasificación como puntos de soporte de stop loss. Por lo tanto, los puntos de soporte de stop loss también pueden ser expulsados del mercado cuando la línea corta rebota.

En relación con los riesgos mencionados, se puede optimizar en los siguientes aspectos:

  1. El indicador de fluctuación de tendencia, combinado con el indicador de fluctuación de tendencia, puede determinar la reversión de la tendencia con anticipación.

  2. Pruebas de optimización de parámetros para seleccionar la combinación óptima de parámetros

  3. Ampliación de los límites de pérdidas cerca de ciertos niveles de soporte

Dirección de optimización

La estrategia tiene espacio para ser optimizada aún más:

  1. Juzgo de forma combinado con la línea K

La posibilidad de una reversión de la tendencia se puede juzgar mediante la identificación de algunas formas típicas de la línea K, como el dorso, la estrella de tiro, etc. Esto evita el riesgo de perseguir la caída de la caída.

  1. Optimización de los parámetros de seguimiento dinámico

Los parámetros como el ciclo de ATR y el factor de amplificación también pueden cambiar de forma dinámica, utilizando un ciclo de ATR más largo y un rango de pérdidas más amplio en mercados con gran volatilidad.

  1. Modelos de aprendizaje automático combinados

Los modelos de aprendizaje profundo, como lstm, rnn, etc., predicen el rango de precios posible en el mercado posterior y ajustan dinámicamente la distancia de parada.

Resumir

Esta estrategia general utiliza el indicador ATR para diseñar la línea de pérdidas móviles e introducir un mecanismo de seguimiento de las pérdidas, que puede ajustar el desplazamiento de las pérdidas en tiempo real en función de los cambios en el mercado. Esto permite un mayor bloqueo de ganancias y al mismo tiempo reduce el riesgo.
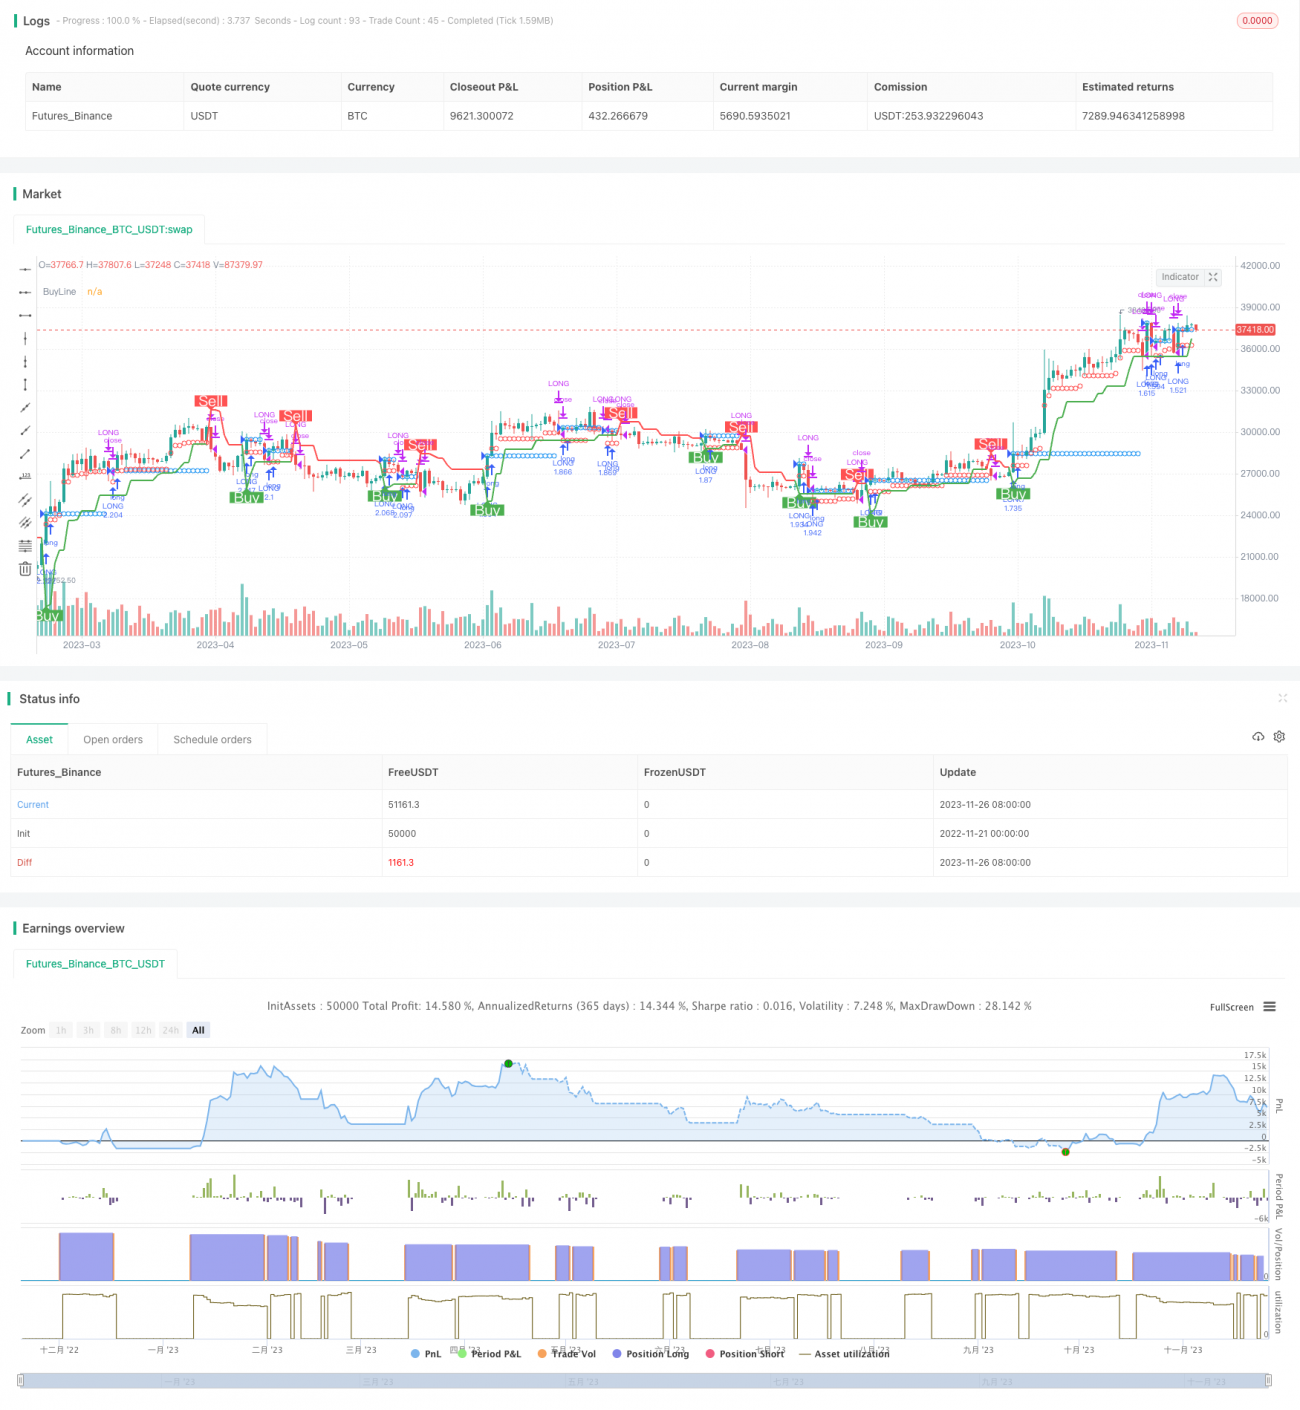
Código Fuente de la Estrategia
/*backtest
start: 2022-11-21 00:00:00
end: 2023-11-27 00:00:00
period: 1d
basePeriod: 1h
exchanges: [{"eid":"Futures_Binance","currency":"BTC_USDT"}]
*/

//@version=4
//
// ▒▒▒▒▒▒▒▒▒▒▒▒▒▒▒▒▒▒▒▒▒▒▒▒▒▒▒▒▒▒▒▒▒▒▒▒▒▒▒▒▒▒▒▒▒▒▒▒▒▒▒▒▒▒▒▒▒▒▒▒▒▒▒▒▒▒▒▒▒▒▒▒▒▒▒▒▒▒▒▒▒▒▒▒▒▒▒▒▒▒▒▒▒▒▒▒▒▒▒▒▒▒▒▒▒▒▒▒▒▒▒▒▒▒ 
//  -----------------------------------------------------------------------------
//  Copyright 2019 Mauricio Pimenta | exit490
//  SuperTrend with Trailing Stop Loss script may be freely distributed under the MIT license.
//
//  Permission is hereby granted, free of charge, 
//  to any person obtaining a copy of this software and associated documentation files (the "Software"), 
//  to deal in the Software without restriction, including without limitation the rights to use, copy, modify, merge, 
//  publish, distribute, sublicense, and/or sell copies of the Software, and to permit persons to whom the Software is furnished to do so, 
//  subject to the following conditions:
//
//  The above copyright notice and this permission notice shall be included in all copies or substantial portions of the Software.
//
//  THE SOFTWARE IS PROVIDED "AS IS", WITHOUT WARRANTY OF ANY KIND, 
//  EXPRESS OR IMPLIED, INCLUDING BUT NOT LIMITED TO THE WARRANTIES OF MERCHANTABILITY, 
//  FITNESS FOR A PARTICULAR PURPOSE AND NONINFRINGEMENT. IN NO EVENT SHALL THE AUTHORS OR COPYRIGHT HOLDERS BE LIABLE FOR ANY CLAIM, 
//  DAMAGES OR OTHER LIABILITY, WHETHER IN AN ACTION OF CONTRACT, TORT OR OTHERWISE, ARISING FROM, 
//  OUT OF OR IN CONNECTION WITH THE SOFTWARE OR THE USE OR OTHER DEALINGS IN THE SOFTWARE.
//
//  -----------------------------------------------------------------------------
//
//  Authors:  @exit490
//  Revision: v1.0.0
//  Date:     5-Aug-2019
//
//  Description
//  ===========
//  SuperTrend is a moving stop and reversal line based on the volatility (ATR).
//  The strategy will ride up your stop loss when price moviment 1%.
//  The strategy will close your operation when the market price crossed the stop loss.
//  The strategy will close operation when the line based on the volatility will crossed
//
//  The strategy has the following parameters:
//
//  INITIAL STOP LOSS - Where can isert the value to first stop.
//  POSITION TYPE - Where can to select trade position.
//  ATR PERIOD - To select number of bars back to execute calculation
//  ATR MULTPLIER - To add a multplier factor on volatility
//  BACKTEST PERIOD - To select range.
//  
//  -----------------------------------------------------------------------------
//  Disclaimer:
//    1. I am not licensed financial advisors or broker dealers. I do not tell you 
//       when or what to buy or sell. I developed this software which enables you 
//       execute manual or automated trades multplierFactoriplierFactoriple trades using TradingView. The 
//       software allows you to set the criteria you want for entering and exiting 
//       trades.
//    2. Do not trade with money you cannot afford to lose.
//    3. I do not guarantee consistent profits or that anyone can make money with no 
//       effort. And I am not selling the holy grail.
//    4. Every system can have winning and losing streaks.
//    5. Money management plays a large role in the results of your trading. For 
//       example: lot size, account size, broker leverage, and broker margin call 
//       rules all have an effect on results. Also, your Take Profit and Stop Loss 
//       settings for individual pair trades and for overall account equity have a 
//       major impact on results. If you are new to trading and do not understand 
//       these items, then I recommend you seek education materials to further your
//       knowledge.
//
//    YOU NEED TO FIND AND USE THE TRADING SYSTEM THAT WORKS BEST FOR YOU AND YOUR 
//    TRADING TOLERANCE.
//
//    I HAVE PROVIDED NOTHING MORE THAN A TOOL WITH OPTIONS FOR YOU TO TRADE WITH THIS PROGRAM ON TRADINGVIEW.
//    
//    I accept suggestions to improve the script.
//    If you encounter any problems I will be happy to share with me.
//  -----------------------------------------------------------------------------
//
// ▒▒▒▒▒▒▒▒▒▒▒▒▒▒▒▒▒▒▒▒▒▒▒▒▒▒▒▒▒▒▒▒▒▒▒▒▒▒▒▒▒▒▒▒▒▒▒▒▒▒▒▒▒▒▒▒▒▒▒▒▒▒▒▒▒▒▒▒▒▒▒▒▒▒▒▒▒▒▒▒▒▒▒▒▒▒▒▒▒▒▒▒▒▒▒▒▒▒▒▒▒▒▒▒▒▒▒▒▒▒▒▒▒▒ //

strategy(title = "SUPERTREND ATR WITH TRAILING STOP LOSS",
         shorttitle = "SUPERTREND ATR WITH TSL",
         overlay = true,
         precision = 8,
         calc_on_order_fills = true,
         calc_on_every_tick = true,
         backtest_fill_limits_assumption = 0,
         default_qty_type = strategy.percent_of_equity,
         default_qty_value = 100,
         initial_capital = 1000,
         currency = currency.USD,
         linktoseries = true)

//
// ▒▒▒▒▒▒▒▒▒▒▒▒▒▒▒▒▒▒▒▒▒▒▒▒▒▒▒▒▒▒▒▒▒▒▒▒▒▒▒▒▒▒▒▒▒▒▒▒▒▒▒▒▒▒▒▒▒▒▒▒▒▒▒▒▒▒▒▒▒▒▒▒▒▒▒▒▒▒▒▒▒▒▒▒▒▒▒▒▒▒▒▒▒▒▒▒▒▒▒▒▒▒▒▒▒▒▒▒▒▒▒▒▒▒ //

// === BACKTEST RANGE ===
backTestSectionFrom = input(title = "═══════════════ FROM ═══════════════", defval = true, type = input.bool)

FromMonth       = input(defval = 1, title = "Month", minval = 1)
FromDay         = input(defval = 1, title = "Day", minval = 1)
FromYear        = input(defval = 2019, title = "Year", minval = 2014)

backTestSectionTo = input(title = "════════════════ TO ════════════════", defval = true, type = input.bool)
ToMonth         = input(defval = 31, title = "Month", minval = 1)
ToDay           = input(defval = 12, title = "Day", minval = 1)
ToYear          = input(defval = 9999, title = "Year", minval = 2014)

backTestPeriod() => (time > timestamp(FromYear, FromMonth, FromDay, 00, 00)) and (time < timestamp(ToYear, ToMonth, ToDay, 23, 59))

//
// ▒▒▒▒▒▒▒▒▒▒▒▒▒▒▒▒▒▒▒▒▒▒▒▒▒▒▒▒▒▒▒▒▒▒▒▒▒▒▒▒▒▒▒▒▒▒▒▒▒▒▒▒▒▒▒▒▒▒▒▒▒▒▒▒▒▒▒▒▒▒▒▒▒▒▒▒▒▒▒▒▒▒▒▒▒▒▒▒▒▒▒▒▒▒▒▒▒▒▒▒▒▒▒▒▒▒▒▒▒▒▒▒▒▒ //

parameterSection = input(title = "═════════════ STRATEGY ═════════════", defval = true, type = input.bool)
// === INPUT TO SELECT POSITION ===
positionType = input(defval="LONG", title="Position Type", options=["LONG", "SHORT"])

// === INPUT TO SELECT INITIAL STOP LOSS
initialStopLossPercent = input(defval = 3.0, minval = 0.0, title="Initial Stop Loss")

// === INPUT TO SELECT BARS BACK
barsBack = input(title="ATR Period", defval=1)

// === INPUT TO SELECT MULTPLIER FACTOR 
multplierFactor = input(title="ATR multplierFactoriplier", step=0.1, defval=3.0)

//
// ▒▒▒▒▒▒▒▒▒▒▒▒▒▒▒▒▒▒▒▒▒▒▒▒▒▒▒▒▒▒▒▒▒▒▒▒▒▒▒▒▒▒▒▒▒▒▒▒▒▒▒▒▒▒▒▒▒▒▒▒▒▒▒▒▒▒▒▒▒▒▒▒▒▒▒▒▒▒▒▒▒▒▒▒▒▒▒▒▒▒▒▒▒▒▒▒▒▒▒▒▒▒▒▒▒▒▒▒▒▒▒▒▒▒ //

// LOGIC TO FIND DIRECTION WHEN THERE IS TREND CHANGE ACCORDING VOLATILITY
atr = multplierFactor * atr(barsBack)

longStop = hl2 - atr
longStopPrev = nz(longStop[1], longStop)
longStop := close[1] > longStopPrev ? max(longStop, longStopPrev) : longStop

shortStop = hl2 + atr
shortStopPrev = nz(shortStop[1], shortStop)
shortStop := close[1] < shortStopPrev ? min(shortStop, shortStopPrev) : shortStop

direction = 1
direction := nz(direction[1], direction)
direction := direction == -1 and close > shortStopPrev ? 1 : direction == 1 and close < longStopPrev ? -1 : direction

longColor = color.blue
shortColor = color.blue

var valueToPlot = 0.0
var colorToPlot = color.white

if (direction == 1)
    valueToPlot := longStop
    colorToPlot := color.green
else
    valueToPlot := shortStop
    colorToPlot := color.red

//
// ▒▒▒▒▒▒▒▒▒▒▒▒▒▒▒▒▒▒▒▒▒▒▒▒▒▒▒▒▒▒▒▒▒▒▒▒▒▒▒▒▒▒▒▒▒▒▒▒▒▒▒▒▒▒▒▒▒▒▒▒▒▒▒▒▒▒▒▒▒▒▒▒▒▒▒▒▒▒▒▒▒▒▒▒▒▒▒▒▒▒▒▒▒▒▒▒▒▒▒▒▒▒▒▒▒▒▒▒▒▒▒▒▒▒ //
//
// === GLOBAL VARIABLES AND FUNCTIONS TO STORE IMPORTANT CONDITIONALS TO TRAILING STOP
hasEntryLongConditional() => direction == 1
hasCloseLongConditional() => direction == -1

hasEntryShortConditional() => direction == -1
hasCloseShortConditional() => direction == 1

stopLossPercent = positionType == "LONG" ? initialStopLossPercent * -1 : initialStopLossPercent

var entryPrice = 0.0
var updatedEntryPrice = 0.0
var stopLossPrice = 0.0

hasOpenTrade() => strategy.opentrades != 0
notHasOpenTrade() => strategy.opentrades == 0

strategyClose() =>
    if positionType == "LONG"
        strategy.close("LONG", when=true)
    else 
        strategy.close("SHORT", when=true)

strategyOpen() =>
    if positionType == "LONG"
        strategy.entry("LONG", strategy.long, when=true)
    else 
        strategy.entry("SHORT", strategy.short, when=true)

isLong() => positionType == "LONG" ? true : false
isShort() => positionType == "SHORT" ? true : false


//
// ▒▒▒▒▒▒▒▒▒▒▒▒▒▒▒▒▒▒▒▒▒▒▒▒▒▒▒▒▒▒▒▒▒▒▒▒▒▒▒▒▒▒▒▒▒▒▒▒▒▒▒▒▒▒▒▒▒▒▒▒▒▒▒▒▒▒▒▒▒▒▒▒▒▒▒▒▒▒▒▒▒▒▒▒▒▒▒▒▒▒▒▒▒▒▒▒▒▒▒▒▒▒▒▒▒▒▒▒▒▒▒▒▒▒ //
//
// === LOGIC TO TRAILING STOP IN LONG POSITION

if (isLong() and backTestPeriod())

    crossedStopLoss = close <= stopLossPrice
    terminateOperation = hasOpenTrade() and (crossedStopLoss or hasCloseLongConditional())

    if (terminateOperation)
        entryPrice := 0.0
        updatedEntryPrice := entryPrice
        stopLossPrice := 0.0
        strategyClose()
    
    startOperation = notHasOpenTrade() and hasEntryLongConditional()

    if(startOperation)
        entryPrice := close
        updatedEntryPrice := entryPrice
        stopLossPrice := entryPrice + (entryPrice * stopLossPercent) / 100
        strategyOpen()
        
    strategyPercentege = (close - updatedEntryPrice) / updatedEntryPrice * 100.00
    rideUpStopLoss = hasOpenTrade() and strategyPercentege > 1

    if (isLong() and rideUpStopLoss)
        stopLossPercent := stopLossPercent + strategyPercentege - 1.0
        newStopLossPrice = updatedEntryPrice + (updatedEntryPrice * stopLossPercent) / 100  
        stopLossPrice := max(stopLossPrice, newStopLossPrice)
        updatedEntryPrice := stopLossPrice

//
// ▒▒▒▒▒▒▒▒▒▒▒▒▒▒▒▒▒▒▒▒▒▒▒▒▒▒▒▒▒▒▒▒▒▒▒▒▒▒▒▒▒▒▒▒▒▒▒▒▒▒▒▒▒▒▒▒▒▒▒▒▒▒▒▒▒▒▒▒▒▒▒▒▒▒▒▒▒▒▒▒▒▒▒▒▒▒▒▒▒▒▒▒▒▒▒▒▒▒▒▒▒▒▒▒▒▒▒▒▒▒▒▒▒▒ //
//
// === LOGIC TO TRAILING STOP IN SHORT POSITION

if (isShort() and backTestPeriod())

    crossedStopLoss = close >= stopLossPrice
    terminateOperation = hasOpenTrade() and (crossedStopLoss or hasCloseShortConditional())

    if (terminateOperation)
        entryPrice := 0.0
        updatedEntryPrice := entryPrice
        stopLossPrice := 0.0
        strategyClose()
    
    startOperation = notHasOpenTrade() and hasEntryShortConditional()

    if(startOperation)
        entryPrice := close
        updatedEntryPrice := entryPrice
        stopLossPrice := entryPrice + (entryPrice * stopLossPercent) / 100
        strategyOpen()
        
    strategyPercentege = (close - updatedEntryPrice) / updatedEntryPrice * 100.00
    rideDownStopLoss = hasOpenTrade() and strategyPercentege < -1

    if (rideDownStopLoss)
        stopLossPercent := stopLossPercent + strategyPercentege + 1.0
        newStopLossPrice = updatedEntryPrice + (updatedEntryPrice * stopLossPercent) / 100  
        stopLossPrice := min(stopLossPrice, newStopLossPrice)
        updatedEntryPrice := stopLossPrice

//
// ▒▒▒▒▒▒▒▒▒▒▒▒▒▒▒▒▒▒▒▒▒▒▒▒▒▒▒▒▒▒▒▒▒▒▒▒▒▒▒▒▒▒▒▒▒▒▒▒▒▒▒▒▒▒▒▒▒▒▒▒▒▒▒▒▒▒▒▒▒▒▒▒▒▒▒▒▒▒▒▒▒▒▒▒▒▒▒▒▒▒▒▒▒▒▒▒▒▒▒▒▒▒▒▒▒▒▒▒▒▒▒▒▒▒ 
//
// === DRAWING SHAPES     

entryPricePlotConditinal = entryPrice == 0.0 ? na : entryPrice
trailingStopLossPlotConditional = stopLossPrice == 0.0  ? na : stopLossPrice

plotshape(entryPricePlotConditinal, title= "Entry Price", color=color.blue, style=shape.circle, location=location.absolute, size=size.tiny)
plotshape(trailingStopLossPlotConditional, title= "Stop Loss", color=color.red, style=shape.circle, location=location.absolute, size=size.tiny)

plot(valueToPlot == 0.0 ? na : valueToPlot, title="BuyLine", linewidth=2, color=colorToPlot)
plotshape(direction == 1 and direction[1] == -1 ? longStop : na, title="Buy", style=shape.labelup, location=location.absolute, size=size.normal, text="Buy", transp=0, textcolor = color.white, color=color.green, transp=0)
plotshape(direction == -1 and direction[1] == 1 ? shortStop : na, title="Sell", style=shape.labeldown, location=location.absolute, size=size.normal, text="Sell", transp=0, textcolor = color.white, color=color.red, transp=0)

alertcondition(direction == 1 and direction[1] == -1 ? longStop : na, title="Buy", message="Buy!")
alertcondition(direction == -1 and direction[1] == 1 ? shortStop : na, title="Sell", message="Sell!")