
La estrategia de seguimiento de la dinámica de adaptación múltiple permite la automatización de la negociación de activos altamente volátiles como las criptomonedas mediante la integración de varios indicadores técnicos para identificar tendencias de mercado y resistencias de soporte clave. La estrategia utiliza indicadores como RSI, MACD y Stochastic para determinar el momento de compra y venta, mientras que combina el porcentaje de cambio de precio para lograr una identificación de tendencias más precisa.
El núcleo de la estrategia de seguimiento de la dinámica de adaptación multifactorial está en el uso integrado de varios indicadores técnicos. La estrategia utiliza principalmente los siguientes componentes:
El indicador RSI determina sobrecompra y sobreventa. La combinación de diferentes parámetros puede identificar la señal RSI normal o la versión mejorada de la señal RSI de Conner para determinar si existe una oportunidad de reversión.
El indicador MACD ayuda a determinar la dirección de la tendencia. Cuando el MACD cruza o baja la línea de señal, genera señales de compra y venta.
El indicador estocástico identifica las zonas de sobreventa y sobrecompra. La línea K y la línea D de la combinación de la señal de la horca dorada y la horca muerta determinan si se invierte.
El porcentaje de cambio de precio prueba si es una verdadera ruptura. Calcula el porcentaje de cambio en el precio más alto, el precio más bajo y el precio de cierre en un período determinado para determinar si constituye una verdadera ruptura.
El EMA determina el exceso de volatilidad en el nivel más alto. El cruce de la línea lenta en la línea rápida es una señal de alza, y el cruce de la línea baja es una señal de baja.
La estrategia consiste en tomar más posiciones en el mercado en función de la situación de vacío, y después de entrar en una posición, establecer un stop loss para controlar el riesgo de manera efectiva. Cuando aparece una señal de reversión, elegir la salida de la posición en blanco. Todo el proceso de decisión combina plenamente varios factores de juicio, lo que permite un juicio más preciso.
La estrategia tiene las siguientes ventajas:
La conducción de múltiples factores tiene una ventaja de juicio. En comparación con un solo indicador, la combinación de varios indicadores puede verificarse entre sí, lo que hace que los resultados sean más precisos y confiables, lo que ahorra costos de transacción innecesarios.
Las condiciones son estrictas para evitar transacciones erróneas. La estrategia establece requisitos estrictos para las condiciones de compra y venta, que requieren que varios indicadores liberen señales al mismo tiempo, lo que permite filtrar una gran cantidad de ruido y evitar que se produzcan transacciones erróneas.
La capacidad de la estrategia para calcular dinámicamente los parámetros indicadores, evitando la subjetividad de la selección manual de los parámetros, lo que hace que los parámetros de la estrategia sean más científicos.
La estrategia calcula y traza la posición de la parada de pérdidas en tiempo real después de la apertura de la posición, lo que permite controlar eficazmente las pérdidas individuales y evitar la ruptura de la posición.
La estrategia también presenta algunos riesgos que deben evitarse:
La probabilidad de que se libere una señal errónea de un indicador. Aunque la verificación de múltiples indicadores puede reducir considerablemente la tasa de señales erróneas, aún existe la posibilidad de que ocurra. Esto puede causar pérdidas innecesarias.
Riesgo de que se rompa el stop loss. En casos extremos, el precio puede caer de manera abrupta, lo que hace que el stop loss original se rompa fácilmente y cause una mayor pérdida.
Optimización de los parámetros de la optimización de exceso. Los parámetros dinámicos, aunque evitan la subjetividad de la selección artificial, también pueden causar una optimización excesiva de los parámetros y perder la capacidad de generalización.
Resolución de las mismas:
La estrategia de seguimiento de la dinámica de adaptación multifactorial también tiene varias dimensiones que se pueden optimizar:
Aumentar el número de factores de juicio. Junto con más diferentes tipos de señales de indicadores de juicio, como la tasa de volatilidad, el volumen de transacciones y otros juicios auxiliares.
Optimización de los algoritmos de los mecanismos de parada. Se pueden introducir algoritmos de parada más avanzados, como la parada de seguimiento y la parada de vibración, para reducir aún más la probabilidad de que se supere el límite.
Introducción de modelos de aprendizaje automático. Modelos como RNN, LSTM y otros para modelar datos históricos que ayuden a tomar decisiones de compra y venta.
Integración de estrategias. La adopción de varias subestrategias y su integración mediante el método de aprendizaje integrado permite obtener un rendimiento integral más estable.
La integración de la estrategia de seguimiento de la dinámica de adaptación multifactorial utiliza varios indicadores técnicos para identificar el momento de la compra y la venta. En comparación con un solo indicador, el juicio de la estrategia es más preciso, mientras que los parámetros incorporados se adaptan y el mecanismo de parada controla el riesgo. El siguiente paso es la introducción de más factores de decisión auxiliares, algoritmos avanzados de parada y métodos de aprendizaje automático para mejorar aún más la eficacia de la estrategia.
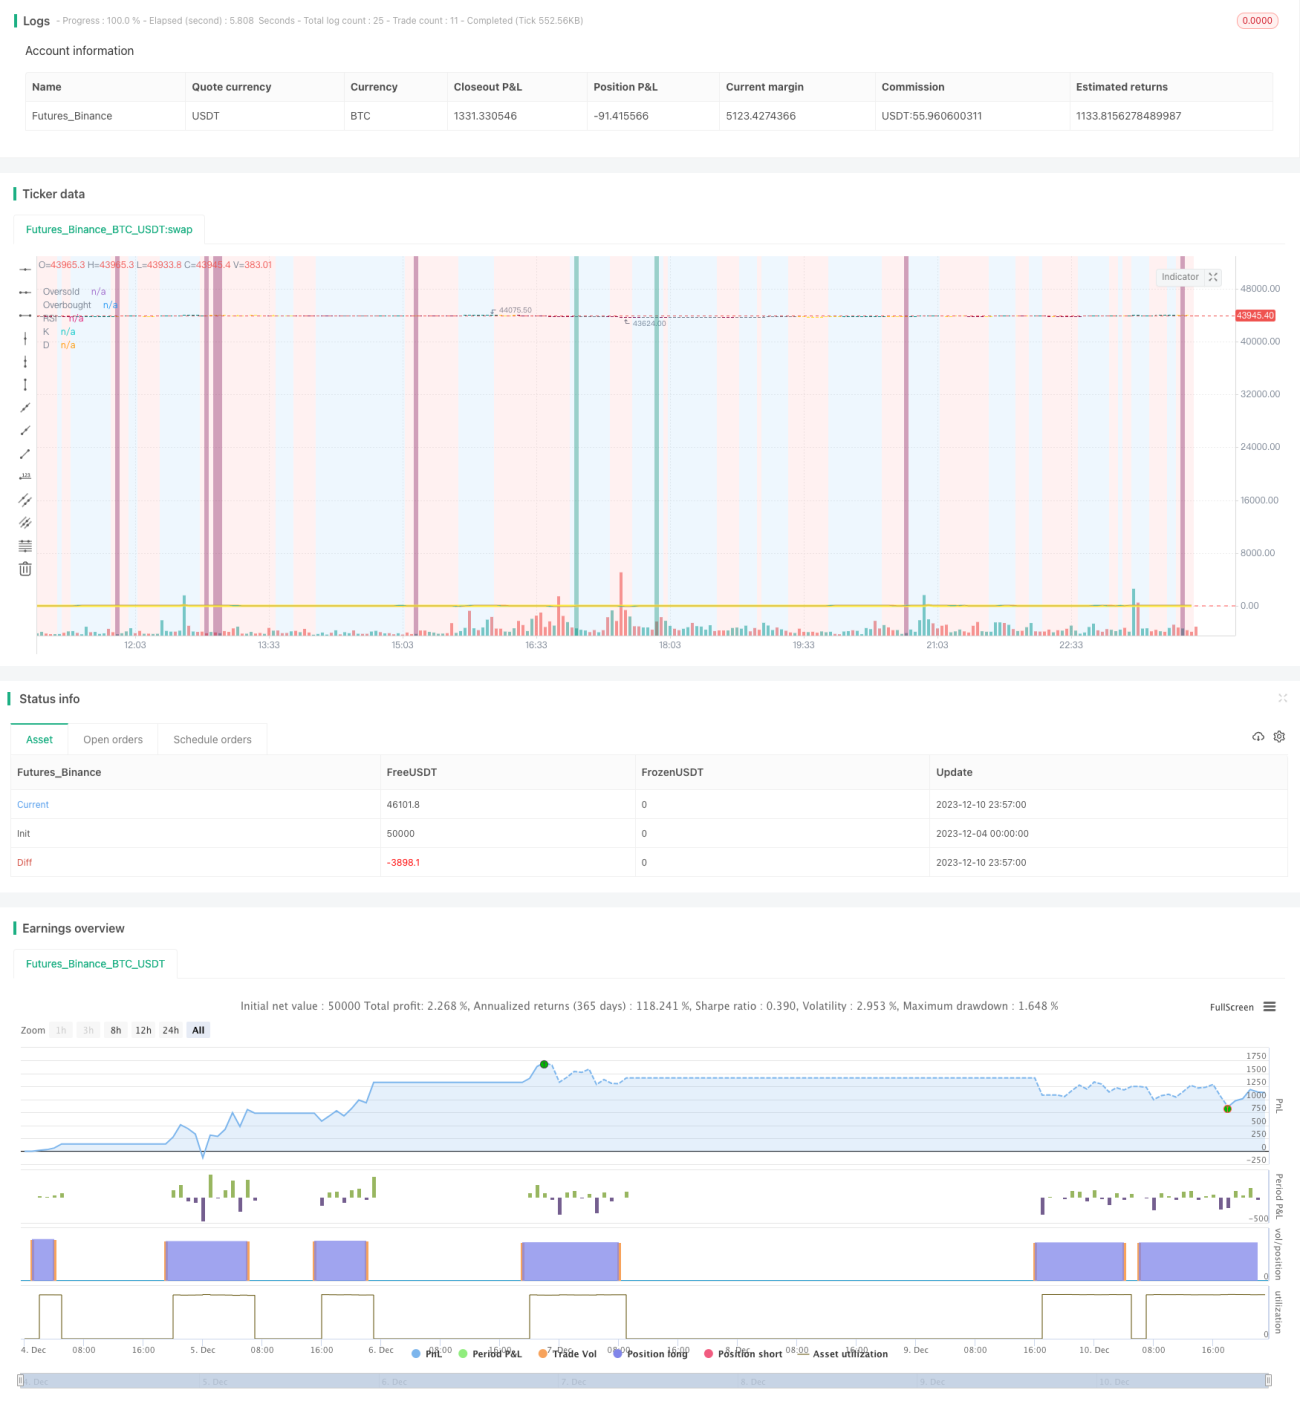
/*backtest
start: 2023-12-04 00:00:00
end: 2023-12-11 00:00:00
period: 3m
basePeriod: 1m
exchanges: [{"eid":"Futures_Binance","currency":"BTC_USDT"}]
*/
// This source code is subject to the terms of the Mozilla Public License 2.0 at https://mozilla.org/MPL/2.0/
//@version=4
// ██████╗██████╗ ███████╗ █████╗ ████████╗███████╗██████╗ ██████╗ ██╗ ██╗
//██╔════╝██╔══██╗██╔════╝██╔══██╗╚══██╔══╝██╔════╝██╔══██╗ ██╔══██╗╚██╗ ██╔╝
//██║ ██████╔╝█████╗ ███████║ ██║ █████╗ ██║ ██║ ██████╔╝ ╚████╔╝
//██║ ██╔══██╗██╔══╝ ██╔══██║ ██║ ██╔══╝ ██║ ██║ ██╔══██╗ ╚██╔╝
//╚██████╗██║ ██║███████╗██║ ██║ ██║ ███████╗██████╔╝ ██████╔╝ ██║
// ╚═════╝╚═╝ ╚═╝╚══════╝╚═╝ ╚═╝ ╚═╝ ╚══════╝╚═════╝ ╚═════╝ ╚═╝
//███████╗ ██████╗ ██╗ ██╗ ██╗████████╗██╗ ██████╗ ███╗ ██╗███████╗ ██╗ █████╗ ███████╗ █████╗
//██╔════╝██╔═══██╗██║ ██║ ██║╚══██╔══╝██║██╔═══██╗████╗ ██║██╔════╝███║██╔══██╗╚════██║██╔══██╗
//███████╗██║ ██║██║ ██║ ██║ ██║ ██║██║ ██║██╔██╗ ██║███████╗╚██║╚██████║ ██╔╝╚█████╔╝
//╚════██║██║ ██║██║ ██║ ██║ ██║ ██║██║ ██║██║╚██╗██║╚════██║ ██║ ╚═══██║ ██╔╝ ██╔══██╗
//███████║╚██████╔╝███████╗╚██████╔╝ ██║ ██║╚██████╔╝██║ ╚████║███████║ ██║ █████╔╝ ██║ ╚█████╔╝
//╚══════╝ ╚═════╝ ╚══════╝ ╚═════╝ ╚═╝ ╚═╝ ╚═════╝ ╚═╝ ╚═══╝╚══════╝ ╚═╝ ╚════╝ ╚═╝ ╚════╝
strategy(shorttitle='Ain1 No Label',title='All in One Strategy no RSI Label', overlay=true, scale=scale.left, initial_capital = 1000, process_orders_on_close=true, default_qty_type = strategy.percent_of_equity, default_qty_value = 100, commission_type=strategy.commission.percent, commission_value=0.18, calc_on_every_tick=true)
kcolor = color.new(#0094FF, 60)
dcolor = color.new(#FF6A00, 60)
// ----------------- Strategy Inputs -------------------------------------------------------------
//Backtest dates with auto finish date of today
start = input(defval = timestamp("01 April 2021 00:00 -0500"), title = "Start Time", type = input.time)
finish = input(defval = timestamp("31 December 2021 00:00 -0600"), title = "End Time", type = input.time)
window() => true // create function "within window of time"
// Strategy Selection - Long, Short, or Both
stratinfo = input(true, "Long/Short for Mixed Market, Long for Bull, Short for Bear")
strat = input(title="Trade Types", defval="Long/Short", options=["Long Only", "Long/Short", "Short Only"])
strat_val = strat == "Long Only" ? 1 : strat == "Long/Short" ? 0 : -1
// Risk Management Inputs
sl= input(10.0, "Stop Loss %", minval = 0, maxval = 100, step = 0.01)
stoploss = sl/100
tp = input(20.0, "Target Profit %", minval = 0, maxval = 100, step = 0.01)
TargetProfit = tp/100
useXRSI = input(false, "Use RSI crossing back, select only one strategy")
useCRSI = input(false, "Use Tweaked Connors RSI, select only one")
RSIInfo = input(true, "These are the RSI Strategy Inputs, RSI Length applies to MACD, set OB and OS to 45 for using Stoch and EMA strategies.")
length = input(14, "RSI Length", minval=1)
overbought= input(62, "Overbought")
oversold= input(35, "Oversold")
cl1 = input(3, "Connor's MA Length 1", minval=1, step=1)
cl2 = input(20, "Connor's MA Lenght 2", minval=1, step=1)
cl3 = input(50, "Connor's MA Lenght 3", minval=1, step=1)
// MACD and EMA Inputs
useMACD = input(false, "Use MACD Only, select only one strategy")
useEMA = input(false, "Use EMA Only, select only one strategy (EMA uses Stochastic inputs too)")
MACDInfo=input(true, "These are the MACD strategy variables")
fastLength = input(5, minval=1, title="EMA Fast Length")
slowLength = input(10, minval=1, title="EMA Slow Length")
ob_min = input(52, "Overbought Lookback Minimum Value", minval=0, maxval=200)
ob_lb = input(25, "Overbought Lookback Bars", minval=0, maxval=100)
os_min = input(50, "Oversold Lookback Minimum Value", minval=0, maxval=200)
os_lb = input(35, "Oversold Lookback Bars", minval=0, maxval=100)
source = input(title="Source", type=input.source, defval=close)
RSI = rsi(source, length)
// Price Movement Inputs
PriceInfo = input(true, "Price Change Percentage Cross Check Inputs for all Strategies, added logic to avoid early sell")
lkbk = input(5,"Max Lookback Period")
// EMA and SMA Background Inputs
useStoch = input(false, "Use Stochastic Strategy, choose only one")
StochInfo = input(true, "Stochastic Strategy Inputs")
smoothK = input(3, "K", minval=1)
smoothD = input(3, "D", minval=1)
k_mode = input("SMA", "K Mode", options=["SMA", "EMA", "WMA"])
high_source = input(high,"High Source")
low_source= input(low,"Low Source")
HTF = input("","Curernt or Higher time frame only", type=input.resolution)
// Selections to show or hide the overlays
showZones = input(true, title="Show Bullish/Bearish Zones")
showStoch = input(true, title="Show Stochastic Overlays")
showRSIBS = input(true, title="Show RSI Buy Sell Zones")
showMACD = input(true, title="Show MACD")
color_bars=input(true, "Color Bars")
// ------------------ Dynamic RSI Calculation ----------------------------------------
AvgHigh(src,cnt,val) =>
total = 0.0
count = 0
for i = 0 to cnt
if src[i] > val
count := count + 1
total := total + src[i]
round(total / count)
RSI_high = AvgHigh(RSI, ob_lb, ob_min)
AvgLow(src,cnt,val) =>
total = 0.0
count = 0
for i = 0 to cnt
if src[i] < val
count := count + 1
total := total + src[i]
round(total / count)
RSI_low = AvgLow(RSI, os_lb, os_min)
// ------------------ Price Percentage Change Calculation -----------------------------------------
perc_change(lkbk) =>
overall_change = ((close[0] - open[lkbk]) / open[lkbk]) * 100
highest_high = 0.0
lowest_low = 0.0
for i = lkbk to 0
highest_high := i == lkbk ? high : high[i] > high[(i + 1)] ? high[i] : highest_high[1]
lowest_low := i == lkbk ? low : low[i] < low[(i + 1)] ? low[i] : lowest_low[1]
start_to_high = ((highest_high - open[lkbk]) / open[lkbk]) * 100
start_to_low = ((lowest_low - open[lkbk]) / open[lkbk]) * 100
previous_to_high = ((highest_high - open[1])/open[1])*100
previous_to_low = ((lowest_low-open[1])/open[1])*100
previous_bar = ((close[1]-open[1])/open[1])*100
[overall_change, start_to_high, start_to_low, previous_to_high, previous_to_low, previous_bar]
// Call the function
[overall, to_high, to_low, last_high, last_low, last_bar] = perc_change(lkbk)
// Plot the function
//plot(overall*50, color=color.white, title='Overall Percentage Change', linewidth=3)
//plot(to_high*50, color=color.green,title='Percentage Change from Start to High', linewidth=2)
//plot(to_low*50, color=color.red, title='Percentage Change from Start to Low', linewidth=2)
//plot(last_high*100, color=color.teal, title="Previous to High", linewidth=2)
//plot(last_low*100, color=color.maroon, title="Previous to Close", linewidth=2)
//plot(last_bar*100, color=color.orange, title="Previous Bar", linewidth=2)
//hline(0, title='Center Line', color=color.orange, linewidth=2)
true_dip = overall < 0 and to_high > 0 and to_low < 0 and last_high > 0 and last_low < 0 and last_bar < 0
true_peak = overall > 0 and to_high > 0 and to_low > 0 and last_high > 0 and last_low < 0 and last_bar > 0
alertcondition(true_dip, title='True Dip', message='Dip')
alertcondition(true_peak, title='True Peak', message='Peak')
// ------------------ Background Colors based on EMA Indicators -----------------------------------
// Uses standard lengths of 9 and 21, if you want control delete the constant definition and uncomment the inputs
haClose(gap) => (open[gap] + high[gap] + low[gap] + close[gap]) / 4
rsi_ema = rsi(haClose(0), length)
v2 = ema(rsi_ema, length)
v3 = 2 * v2 - ema(v2, length)
emaA = ema(rsi_ema, fastLength)
emaFast = 2 * emaA - ema(emaA, fastLength)
emaB = ema(rsi_ema, slowLength)
emaSlow = 2 * emaB - ema(emaB, slowLength)
//plot(rsi_ema, color=color.white, title='RSI EMA', linewidth=3)
//plot(v2, color=color.green,title='v2', linewidth=2)
//plot(v3, color=color.red, title='v3', linewidth=2)
//plot(emaFast, color=color.teal, title="EMA Fast", linewidth=2)
//plot(emaSlow, color=color.maroon, title="EMA Slow", linewidth=2)
EMABuy = crossunder(emaFast, v2) and window()
EMASell = crossover(emaFast, emaSlow) and window()
alertcondition(EMABuy, title='EMA Buy', message='EMA Buy Condition')
alertcondition(EMASell, title='EMA Sell', message='EMA Sell Condition')
// bullish signal rule:
bullishRule =emaFast > emaSlow
// bearish signal rule:
bearishRule =emaFast < emaSlow
// current trading State
ruleState = 0
ruleState := bullishRule ? 1 : bearishRule ? -1 : nz(ruleState[1])
ruleColor = ruleState==1 ? color.new(color.blue, 90) : ruleState == -1 ? color.new(color.red, 90) : ruleState == 0 ? color.new(color.gray, 90) : na
bgcolor(showZones ? ruleColor : na, title="Bullish/Bearish Zones")
// ------------------ Stochastic Indicator Overlay -----------------------------------------------
// Calculation
// Use highest highs and lowest lows
h_high = highest(high_source ,lkbk)
l_low = lowest(low_source ,lkbk)
stoch = stoch(RSI, RSI_high, RSI_low, length)
k =
k_mode=="EMA" ? ema(stoch, smoothK) :
k_mode=="WMA" ? wma(stoch, smoothK) :
sma(stoch, smoothK)
d = sma(k, smoothD)
k_c = change(k)
d_c = change(d)
kd = k - d
// Plot
signalColor = k>oversold and d<overbought and k>d and k_c>0 and d_c>0 ? kcolor :
k<overbought and d>oversold and k<d and k_c<0 and d_c<0 ? dcolor : na
kp = plot(showStoch ? k : na, "K", color=kcolor)
dp = plot(showStoch ? d : na, "D", color=dcolor)
fill(kp, dp, color = signalColor, title="K-D")
signalUp = showStoch ? not na(signalColor) and kd>0 : na
signalDown = showStoch ? not na(signalColor) and kd<0 : na
//plot(signalUp ? kd : na, "Signal Up", color=kcolor, transp=90, style=plot.style_columns)
//plot(signalDown ? (kd+100) : na , "Signal Down", color=dcolor, transp=90, style=plot.style_columns, histbase=100)
//StochBuy = crossover(k, d) and kd>0 and to_low<0 and window()
//StochSell = crossunder(k,d) and kd<0 and to_high>0 and window()
StochBuy = crossover(k, d) and window()
StochSell = crossunder(k, d) and window()
alertcondition(StochBuy, title='Stoch Buy', message='K Crossing D')
alertcondition(StochSell, title='Stoch Sell', message='D Crossing K')
// -------------- Add Price Movement -------------------------
// Calculations
h1 = vwma(high, length)
l1 = vwma(low, length)
hp = h_high[1]
lp = l_low[1]
// Plot
var plot_color=#353535
var sig = 0
if (h1 >hp)
sig:=1
plot_color:=color.lime
else if (l1 <lp)
sig:=-1
plot_color:=color.maroon
//plot(1,title = "Price Movement Bars", style=plot.style_columns,color=plot_color)
//plot(sig,title="Signal 1 or -1",display=display.none)
// --------------------------------------- RSI Plot ----------------------------------------------
// Plot Oversold and Overbought Lines
over = hline(oversold, title="Oversold", color=color.green)
under = hline(overbought, title="Overbought", color=color.red)
fillcolor = color.new(#9915FF, 90)
fill(over, under, fillcolor, title="Band Background")
// Show RSI and EMA crosses with arrows and RSI Color (tweaked Connors RSI)
// Improves strategy setting ease by showing where EMA 5 crosses EMA 10 from above to confirm overbought conditions or trend reversals
// This shows where you should enter shorts or exit longs
// Tweaked Connors RSI Calculation
connor_ob = overbought
connor_os = oversold
ma1 = sma(close,cl1)
ma2 = sma(close, cl2)
ma3 = sma(close, cl3)
// Buy Sell Zones using tweaked Connors RSI (RSI values of 80 and 20 for Crypto as well as ma3, ma20, and ma50 are the tweaks)
RSI_SELL = ma1 > ma2 and open > ma3 and RSI >= connor_ob and true_peak and window()
RSI_BUY = ma2 < ma3 and ma3 > close and RSI <= connor_os and true_dip and window()
alertcondition(RSI_BUY, title='Connors Buy', message='Connors RSI Buy')
alertcondition(RSI_SELL, title='Connors Sell', message='Connors RSI Sell')
// Color Definition
col = useCRSI ? (close > ma2 and close < ma3 and RSI <= connor_os ? color.lime : close < ma2 and close > ma3 and RSI <= connor_ob ? color.red : color.yellow ) : color.yellow
// Plot colored RSI Line
plot(RSI, title="RSI", linewidth=3, color=col)
//------------------- MACD Strategy -------------------------------------------------
[macdLine, signalLine, _] = macd(close, fastLength, slowLength, length)
bartrendcolor = macdLine > signalLine and k > 50 and RSI > 50 ? color.teal : macdLine < signalLine and k < 50 and RSI < 50 ? color.maroon : macdLine < signalLine ? color.yellow : color.gray
barcolor(color = color_bars ? bartrendcolor : na)
MACDBuy = macdLine>signalLine and RSI<RSI_low and overall<0 and window()
MACDSell = macdLine<signalLine and RSI>RSI_high and overall>0 and window()
//plotshape(showMACD ? MACDBuy: na, title = "MACD Buy", style = shape.arrowup, text = "MACD Buy", color=color.green, textcolor=color.green, size=size.small)
//plotshape(showMACD ? MACDSell: na, title = "MACD Sell", style = shape.arrowdown, text = "MACD Sell", color=color.red, textcolor=color.red, size=size.small)
MACColor = MACDBuy ? color.new(color.teal, 50) : MACDSell ? color.new(color.maroon, 50) : na
bgcolor(showMACD ? MACColor : na, title ="MACD Signals")
// -------------------------------- Entry and Exit Logic ------------------------------------
// Entry Logic
XRSI_OB = crossunder(RSI, overbought) and overall<0 and window()
RSI_OB = RSI>overbought and true_peak and window()
XRSI_OS = crossover(RSI, oversold) and overall>0 and window()
RSI_OS = RSI<oversold and true_dip and window()
alertcondition(XRSI_OB, title='Reverse RSI Sell', message='RSI Crossing back under OB')
alertcondition(XRSI_OS, title='Reverse RSI Buy', message='RSI Crossing back over OS')
alertcondition(RSI_OS, title='RSI Buy', message='RSI Crossover OS')
alertcondition(RSI_SELL, title='RSI Sell', message='RSI Crossunder OB')
// Strategy Entry and Exit with built in Risk Management
GoLong = strategy.position_size==0 and strat_val > -1 and rsi_ema > RSI and k < d ? (useXRSI ? XRSI_OS : useMACD ? MACDBuy : useCRSI ? RSI_BUY : useStoch ? StochBuy : RSI_OS) : false
GoShort = strategy.position_size==0 and strat_val < 1 and rsi_ema < RSI and d < k ? (useXRSI ? XRSI_OB : useMACD ? MACDSell : useCRSI ? RSI_SELL : useStoch ? StochSell : RSI_OB) : false
if (GoLong)
strategy.entry("LONG", strategy.long)
if (GoShort)
strategy.entry("SHORT", strategy.short)
longStopPrice = strategy.position_avg_price * (1 - stoploss)
longTakePrice = strategy.position_avg_price * (1 + TargetProfit)
shortStopPrice = strategy.position_avg_price * (1 + stoploss)
shortTakePrice = strategy.position_avg_price * (1 - TargetProfit)
//plot(series=(strategy.position_size > 0) ? longTakePrice : na, color=color.green, style=plot.style_circles, linewidth=3, title="Long Take Profit")
//plot(series=(strategy.position_size < 0) ? shortTakePrice : na, color=color.green, style=plot.style_circles, linewidth=3, title="Short Take Profit")
//plot(series=(strategy.position_size > 0) ? longStopPrice : na, color=color.red, style=plot.style_cross, linewidth=2, title="Long Stop Loss")
//plot(series=(strategy.position_size < 0) ? shortStopPrice : na, color=color.red, style=plot.style_cross, linewidth=2, title="Short Stop Loss")
if (strategy.position_size > 0)
strategy.exit(id="Exit Long", from_entry = "LONG", stop = longStopPrice, limit = longTakePrice)
if (strategy.position_size < 0)
strategy.exit(id="Exit Short", from_entry = "SHORT", stop = shortStopPrice, limit = shortTakePrice)
CloseLong = strat_val > -1 and strategy.position_size > 0 and rsi_ema > RSI and d > k ? (useXRSI ? XRSI_OB : useMACD ? MACDSell : useCRSI ? RSI_SELL : RSI_OB) : false
if(CloseLong)
strategy.close("LONG")
CloseShort = strat_val < 1 and strategy.position_size < 0 and rsi_ema < RSI and k > d ? (useXRSI ? XRSI_OS : useMACD ? MACDBuy : useCRSI ? RSI_BUY : RSI_OS) : false
if(CloseShort)
strategy.close("SHORT")