Estrategias cuantitativas basadas en la tasa de cambio


Fecha de creación: 2023-12-12 15:56:56 Última modificación: 2023-12-12 15:56:56
Copiar: 0 Número de Visitas: 655
1
Seguir
1621
Seguidores

Estrategias cuantitativas basadas en la tasa de cambio

Descripción general

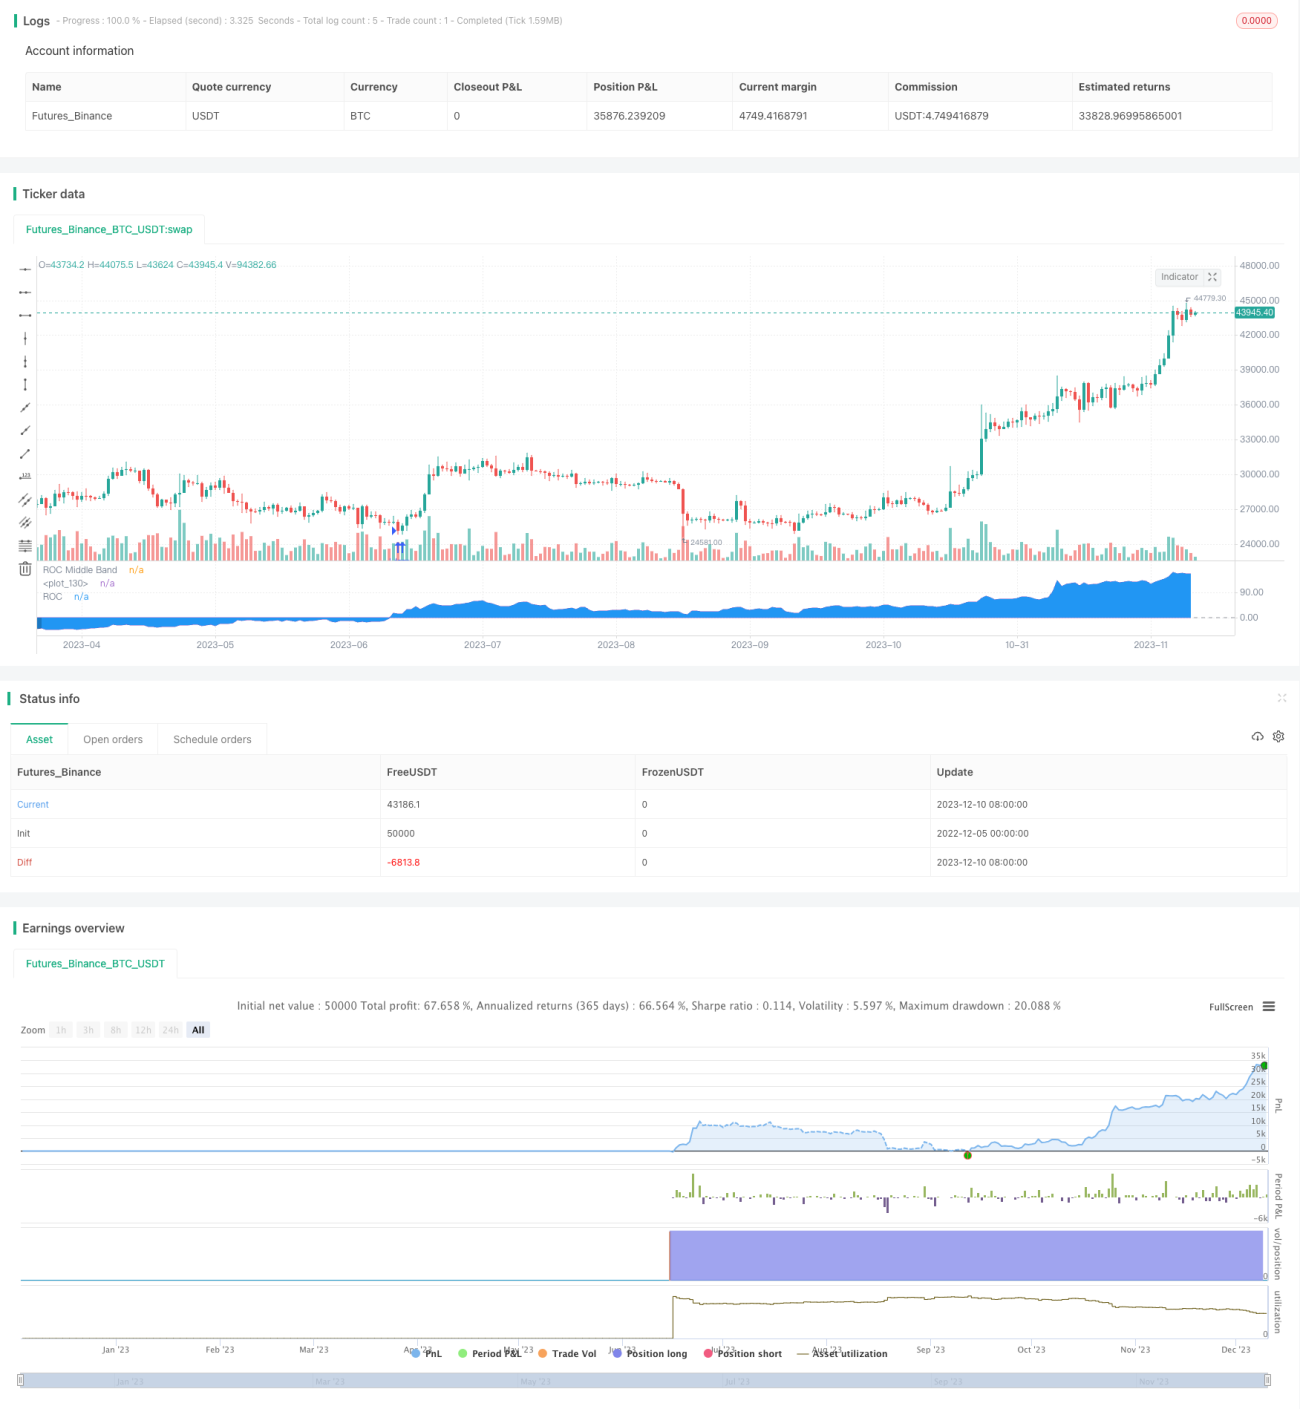
La estrategia se basa en el índice de cambio (ROC) para juzgar el movimiento del mercado y generar señales de negociación. La idea central de la estrategia es seguir la tendencia a largo plazo y obtener ganancias que superen al mercado asumiendo un mayor riesgo.

Principio de estrategia

Reglas de ingreso

  • Si el ROC es mayor que 0, haga más; si el ROC es menor que 0, haga vacío. Utilice el índice de ROC positivo-negativo para determinar la dirección de la situación.
  • Para filtrar la oscilación, la señal de negociación se emite solo si el ROC permanece en el mismo lado dos días consecutivos.

Las reglas de stop loss

Se ha establecido un stop loss del 6%; cuando se activa el stop loss, se cambia la dirección de la posición; esto significa que podríamos estar en el lado equivocado de la situación y que se requiere una operación de reversión de stop loss a tiempo.

Mecanismo de protección contra las burbujas

Si el ROC supera los 200, se considera una burbuja. Cuando el ROC cae por debajo de la burbuja, se genera una señal de vacío. Además, se requiere que la burbuja dure al menos una semana.

Administración de fondos

Utiliza la estrategia de posición fija + incremental. Cada vez que sube o baja 400 dólares, aumenta o disminuye la posición de 200 dólares. De esta manera, se puede utilizar la ganancia para aumentar la posición para obtener mayores ganancias, pero también aumenta la retirada.

Análisis de las ventajas

Se trata de una estrategia para seguir las tendencias a largo plazo, y sus ventajas son:

  1. Siguiendo la filosofía de la negociación de tendencias, es fácil obtener beneficios positivos a largo plazo.
  2. El uso de stop loss para controlar el riesgo puede mitigar el impacto de las fluctuaciones en el mercado a corto plazo.
  3. El mecanismo anti-burbuja puede evitar que los precios suban en la parte superior del mercado.
  4. La posición fija y la gestión de fondos crecientes le permiten obtener un crecimiento exponencial en un mercado ascendente.

Análisis de riesgos

La estrategia también tiene sus riesgos:

  1. Los indicadores ROC son susceptibles a las perturbaciones, lo que genera señales erróneas. Se puede considerar la posibilidad de agregar otros indicadores para un filtro combinado.
  2. Sin tener en cuenta los gastos de transacción, los beneficios en el uso real son menores que los de la medición.
  3. La configuración incorrecta de los parámetros anti-burbuja también es fácil de perder.
  4. La posición fija + el incremento aumentan la retirada de pérdidas.

Dirección de optimización

La estrategia puede ser optimizada en los siguientes aspectos:

  1. Añadir otros indicadores para juzgar, formar un sistema de negociación para filtrar las señales erróneas. Por ejemplo, agregar indicadores como la línea media, la tasa de volatilidad.
  2. Optimización de los parámetros de protección contra las burbujas para establecer un mecanismo de identificación de burbujas más preciso.
  3. Ajustar las posiciones fijas y los parámetros crecientes para obtener un mejor equilibrio de riesgos y beneficios.
  4. Se añade un mecanismo de suspensión automática de pérdidas.
  5. Tener en cuenta el impacto de las tarifas de transacción y establecer criterios de entrada más realistas.

Resumir

En general, es una estrategia de seguimiento de líneas largas con el indicador de ROC como núcleo. Es una estrategia de inversión positiva que obtiene ganancias adicionales por encima del margen de mercado asumiendo un mayor riesgo. Necesitamos optimizar adecuadamente para que pueda usarse en la práctica. La clave es encontrar las preferencias de riesgo adecuadas para nosotros.

Código Fuente de la Estrategia
/*backtest
start: 2022-12-05 00:00:00
end: 2023-12-11 00:00:00
period: 1d
basePeriod: 1h
exchanges: [{"eid":"Futures_Binance","currency":"BTC_USDT"}]
*/

// This source code is subject to the terms of the Mozilla Public License 2.0 at https://mozilla.org/MPL/2.0/
// © gsanson66


//This strategy use the Rate of Change (ROC) of the closing price to send enter signal. 
//@version=5
strategy("RATE OF CHANGE BACKTESTING", shorttitle="ROC BACKTESTING", overlay=false, precision=3, initial_capital=1000, default_qty_type=strategy.cash, default_qty_value=950, commission_type=strategy.commission.percent, commission_value=0.18)


//--------------------------------FUNCTIONS-----------------------------------//

//@function Displays text passed to `txt` when called.
debugLabel(txt, color, loc) =>
    label.new(bar_index, loc, text = txt, color=color, style = label.style_label_lower_right, textcolor = color.black, size = size.small)

//@function which looks if the close date of the current bar falls inside the date range
inBacktestPeriod(start, end) => (time >= start) and (time <= end)


//----------------------------------USER INPUTS----------------------------------//

//Technical parameters
rocLength = input.int(defval=365, minval=0, title='ROC Length', group="Technical parameters")
bubbleValue = input.int(defval=200, minval=0, title="ROC Bubble signal", group="Technical parameters")
//Risk management
stopLossInput = input.float(defval=10, minval=0, title="Stop Loss (in %)", group="Risk Management")
//Money management
fixedRatio = input.int(defval=400, minval=1, title="Fixed Ratio Value ($)", group="Money Management")
increasingOrderAmount = input.int(defval=200, minval=1, title="Increasing Order Amount ($)", group="Money Management")
//Backtesting period
startDate = input(title="Start Date", defval=timestamp("1 Jan 2017 00:00:00"), group="Backtesting Period")
endDate = input(title="End Date", defval=timestamp("1 July 2024 00:00:00"), group="Backtesting Period")


//-------------------------------------VARIABLES INITIALISATION-----------------------------//

roc = (close/close[rocLength] - 1)*100
midlineConst = 0
var bool inBubble = na
bool shortBubbleCondition = na
equity = strategy.equity - strategy.openprofit
strategy.initial_capital = 50000
var float capital_ref = strategy.initial_capital
var float cashOrder = strategy.initial_capital * 0.95
bool inRange = na


//------------------------------CHECKING SOME CONDITIONS ON EACH SCRIPT EXECUTION-------------------------------//

//Checking if the date belong to the range
inRange := true

//Checking if we are in a bubble
if roc > bubbleValue and not inBubble
    inBubble := true

//Checking if the bubble is over
if roc < 0 and inBubble
    inBubble := false

//Checking the condition to short the bubble : The ROC must be above the bubblevalue for at least 1 week
if roc[1]>bubbleValue and roc[2]>bubbleValue and roc[3]>bubbleValue and roc[4]>bubbleValue and roc[5]>bubbleValue and roc[6]>bubbleValue and roc[7]>bubbleValue
    shortBubbleCondition := true

//Checking performances of the strategy
if equity > capital_ref + fixedRatio
    spread = (equity - capital_ref)/fixedRatio
    nb_level = int(spread)
    increasingOrder = nb_level * increasingOrderAmount
    cashOrder := cashOrder + increasingOrder
    capital_ref := capital_ref + nb_level*fixedRatio
if equity < capital_ref - fixedRatio
    spread = (capital_ref - equity)/fixedRatio
    nb_level = int(spread)
    decreasingOrder = nb_level * increasingOrderAmount
    cashOrder := cashOrder - decreasingOrder
    capital_ref := capital_ref - nb_level*fixedRatio

//Checking if we close all trades in case where we exit the backtesting period
if strategy.position_size!=0 and not inRange
    debugLabel("END OF BACKTESTING PERIOD : we close the trade", color=color.rgb(116, 116, 116), loc=roc)
    strategy.close_all()


//-------------------------------LONG/SHORT CONDITION-------------------------------//

//Long condition
//We reduce noise by taking signal only if the last roc value is in the same side as the current one
if (strategy.position_size<=0 and ta.crossover(roc, midlineConst)[1] and roc>0 and inRange)
    //If we were in a short position, we pass to a long position
    qty = cashOrder/close
    strategy.entry("Long", strategy.long, qty)
    stopLoss = close * (1-stopLossInput/100)
    strategy.exit("Long Risk Managment", "Long", stop=stopLoss)

//Short condition
//We take a short position if we are in a bubble and roc is decreasing
if (strategy.position_size>=0 and ta.crossunder(roc, midlineConst)[1] and roc<0 and inRange) or 
     (strategy.position_size>=0 and inBubble and ta.crossunder(roc, bubbleValue) and shortBubbleCondition and inRange)
    //If we were in a long position, we pass to a short position
    qty = cashOrder/close
    strategy.entry("Short", strategy.short, qty)
    stopLoss = close * (1+stopLossInput/100)
    strategy.exit("Short Risk Managment", "Short", stop=stopLoss)


//--------------------------------RISK MANAGEMENT--------------------------------------//

//We manage our risk and change the sense of position after SL is hitten
if strategy.position_size == 0 and inRange
    //We find the direction of the last trade
    id = strategy.closedtrades.entry_id(strategy.closedtrades-1)
    if id == "Short"
        qty = cashOrder/close
        strategy.entry("Long", strategy.long, qty)
        stopLoss = close * (1-stopLossInput/100)
        strategy.exit("Long Risk Managment", "Long", stop=stopLoss)
    else if id =="Long"
        qty = cashOrder/close
        strategy.entry("Short", strategy.short, qty)
        stopLoss = close * (1+stopLossInput/100)
        strategy.exit("Short Risk Managment", "Short", stop=stopLoss)


//---------------------------------PLOTTING ELEMENTS---------------------------------------//

//Plotting of ROC
rocPlot = plot(roc, "ROC", color=#7E57C2)
midline = hline(0, "ROC Middle Band", color=color.new(#787B86, 25))
midLinePlot = plot(0, color = na, editable = false, display = display.none)
fill(rocPlot, midLinePlot, 40, 0, top_color = strategy.position_size>0 ? color.new(color.green, 0) : strategy.position_size<0 ? color.new(color.red, 0) : na, bottom_color = strategy.position_size>0 ? color.new(color.green, 100) : strategy.position_size<0 ? color.new(color.red, 100) : na,  title = "Positive area")
fill(rocPlot, midLinePlot, 0,  -40,  top_color = strategy.position_size<0 ? color.new(color.red, 100) : strategy.position_size>0 ? color.new(color.green, 100) : na, bottom_color = strategy.position_size<0 ? color.new(color.red, 0) : strategy.position_size>0 ? color.new(color.green, 0) : na, title = "Negative area")