Estrategia de trading de ETF con seguimiento de tendencia del RSI de vector de reversión
Descripción general
Esta estrategia es una estrategia de negociación de ETFs que sigue una tendencia inversa basada en un índice relativamente débil (el RSI). Utiliza el RSI para determinar sobrecompras y sobreventas a corto plazo, y realiza entradas y salidas invertidas. Al mismo tiempo, combina una media móvil de 200 días para determinar la dirección de la tendencia general.
Principio de estrategia
La lógica central de esta estrategia se basa en el principio de reversión del indicador RSI. El indicador RSI determina si la variedad de comercio está sobrecomprada o sobrevendida mediante el cálculo de la media de subidas y bajadas durante un período de tiempo. Cuando el RSI es superior a 70 significa sobrecompra y el RSI es inferior a 30 significa sobreventa.
Esta estrategia utiliza este principio para establecer que el RSI del día es inferior al parámetro ajustableTodaysMinRSIY hace 3 días el RSI estaba por debajo de los parámetros ajustables.Day3RSIMaxEsto significa que el precio puede estar en una zona de sobreventa a corto plazo, con la posibilidad de un rebote. Al mismo tiempo, se requiere que el RSI presente una tendencia descendente dentro de los 3 días, es decir, que el RSI siga bajando para comprar, para evitar un falso rebote.
El mecanismo de salida de la estrategia es cuando el indicador RSI supera nuevamente el parámetro ajustableExit RSICuando el valor de la bolsa baja, se considera que el rebote ha terminado y se realiza la salida de la posición.
La estrategia también introdujo una media móvil de 200 días como criterio de tendencia general. La operación de compra solo se puede realizar cuando el precio está por encima de la línea de 200 días. Esto ayuda a garantizar que se compre solo en la fase de tendencia ascendente y evita el riesgo que conlleva la negociación de contratiempos.
Análisis de las ventajas estratégicas
- El indicador RSI se utiliza para determinar las zonas de sobreventa y sobrecompra, con una alta probabilidad de bellion.
- La combinación de la línea de 200 días para determinar la dirección de la tendencia general ayuda a evitar el comercio en contra.
- El principio de inversión RSI es clásico y confiable, con una alta tasa de éxito.
- Los parámetros ajustables ofrecen flexibilidad y se pueden optimizar para diferentes variedades.
Riesgos y soluciones
- El indicador RSI tiene la posibilidad de una falsa ruptura, no se puede evitar por completo la pérdida de una sola carta. Se puede establecer un stop loss para controlar la pérdida de una sola carta.
- El fracaso de la inversión puede causar una expansión de las pérdidas. Se puede acortar el tiempo de tenencia de la posición y detener la salida de pérdidas a tiempo.
- La configuración inadecuada de los parámetros puede conducir a ser demasiado radical o demasiado conservador y perder oportunidades de comercio. Se deben realizar pruebas de optimización de parámetros para la variedad.
Dirección de optimización
- Añadir combinaciones de otros indicadores, como KDJ, Brinband, etc., para formar una combinación de indicadores y mejorar la precisión de la señal.
- Aumentar las estrategias móviles de stop loss para que el nivel de stop loss sea variable y reducir las pérdidas.
- Aumentar el volumen de transacciones o el módulo de gestión de fondos para controlar el riesgo de cada transacción.
- Optimización y retroalimentación de los parámetros de las diferentes variedades para desarrollar una combinación de parámetros adecuada para las variedades.
Resumir
Esta estrategia utiliza el clásico principio de punto de compra y venta del indicador RSI para realizar entradas y salidas de reversión al determinar las zonas de sobreventa y sobreventa. Al mismo tiempo, toma en cuenta el juicio de las grandes tendencias y el espacio de optimización de los parámetros. Es una estrategia de ETF de reversión a corto plazo de alta fiabilidad.
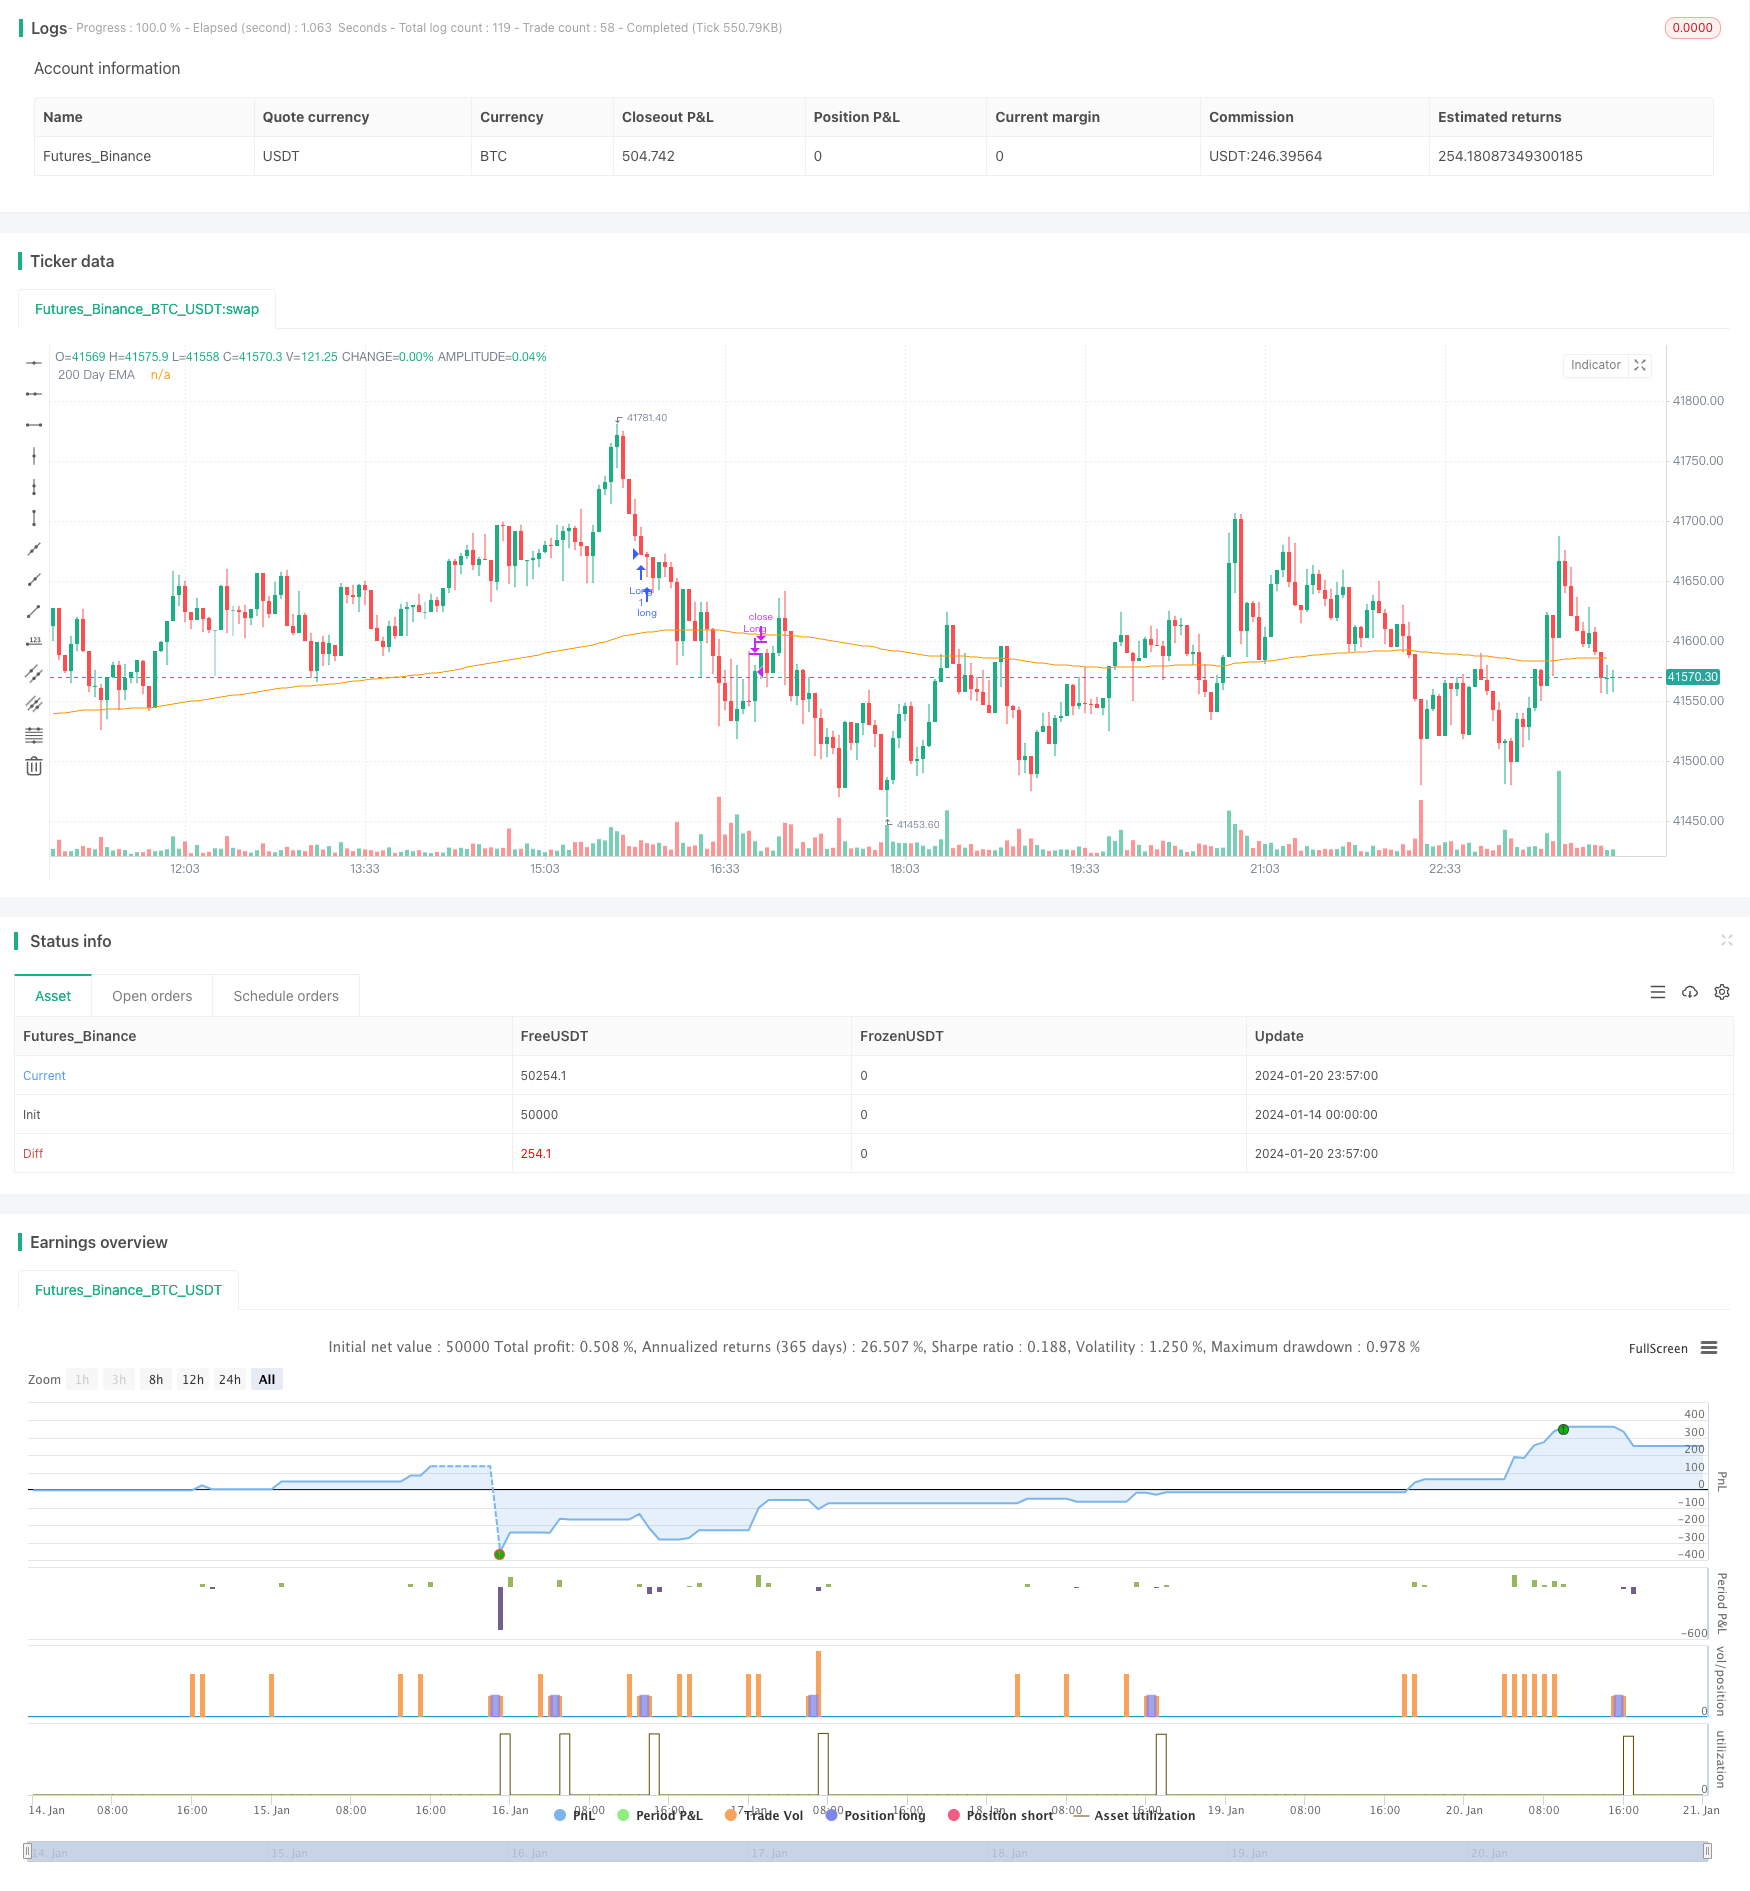
/*backtest
start: 2024-01-14 00:00:00
end: 2024-01-21 00:00:00
period: 3m
basePeriod: 1m
exchanges: [{"eid":"Futures_Binance","currency":"BTC_USDT"}]
*/

// This source code is subject to the terms of the Mozilla Public License 2.0 at https://mozilla.org/MPL/2.0/
// @version = 5
// Author = TradeAutomation


strategy(title="R3 ETF Strategy", shorttitle="R3 ETF Strategy", overlay=true)


// Backtest Date Range Inputs //
StartTime = input(defval=timestamp('01 Jan 2012 05:00 +0000'), title='Start Time')
EndTime = input(defval=timestamp('01 Jan 2099 00:00 +0000'), title='End Time')
InDateRange = true

// Calculations and Inputs //
RSILen = input.int(2, "RSI Length")
RSI = ta.rsi(close, RSILen)
TodaysMinRSI = input.int(10, "Today's Min RSI for Entry", tooltip = "The RSI must be below this number today to qualify for trade entry")
Day3RSIMax = input.int(60, "Max RSI 3 Days Ago for Entry", tooltip = "The RSI must be below this number 3 days ago to qualify for trade entry")
EMA = ta.ema(close, 200)

// Strategy Rules //
Rule1 = close>ta.ema(close, 200)
Rule2 = RSI[3]<Day3RSIMax and RSI<TodaysMinRSI
Rule3 = RSI<RSI[1] and RSI[1]<RSI[2] and RSI[2]<RSI[3]
Exit = ta.crossover(RSI, input.int(70, "Exit RSI", tooltip = "The strategy will sell when the RSI crosses over this number"))

// Plot //
plot(EMA, "200 Day EMA")

// Entry & Exit Functions //
if (InDateRange)
    strategy.entry("Long", strategy.long, when = Rule1 and Rule2 and Rule3)
//    strategy.close("Long", when = ta.crossunder(close, ATRTrailingStop))
    strategy.close("Long", when = Exit)
if (not InDateRange)
    strategy.close_all()