Estrategia de seguimiento de tendencia de cruce de medias móviles
Descripción general
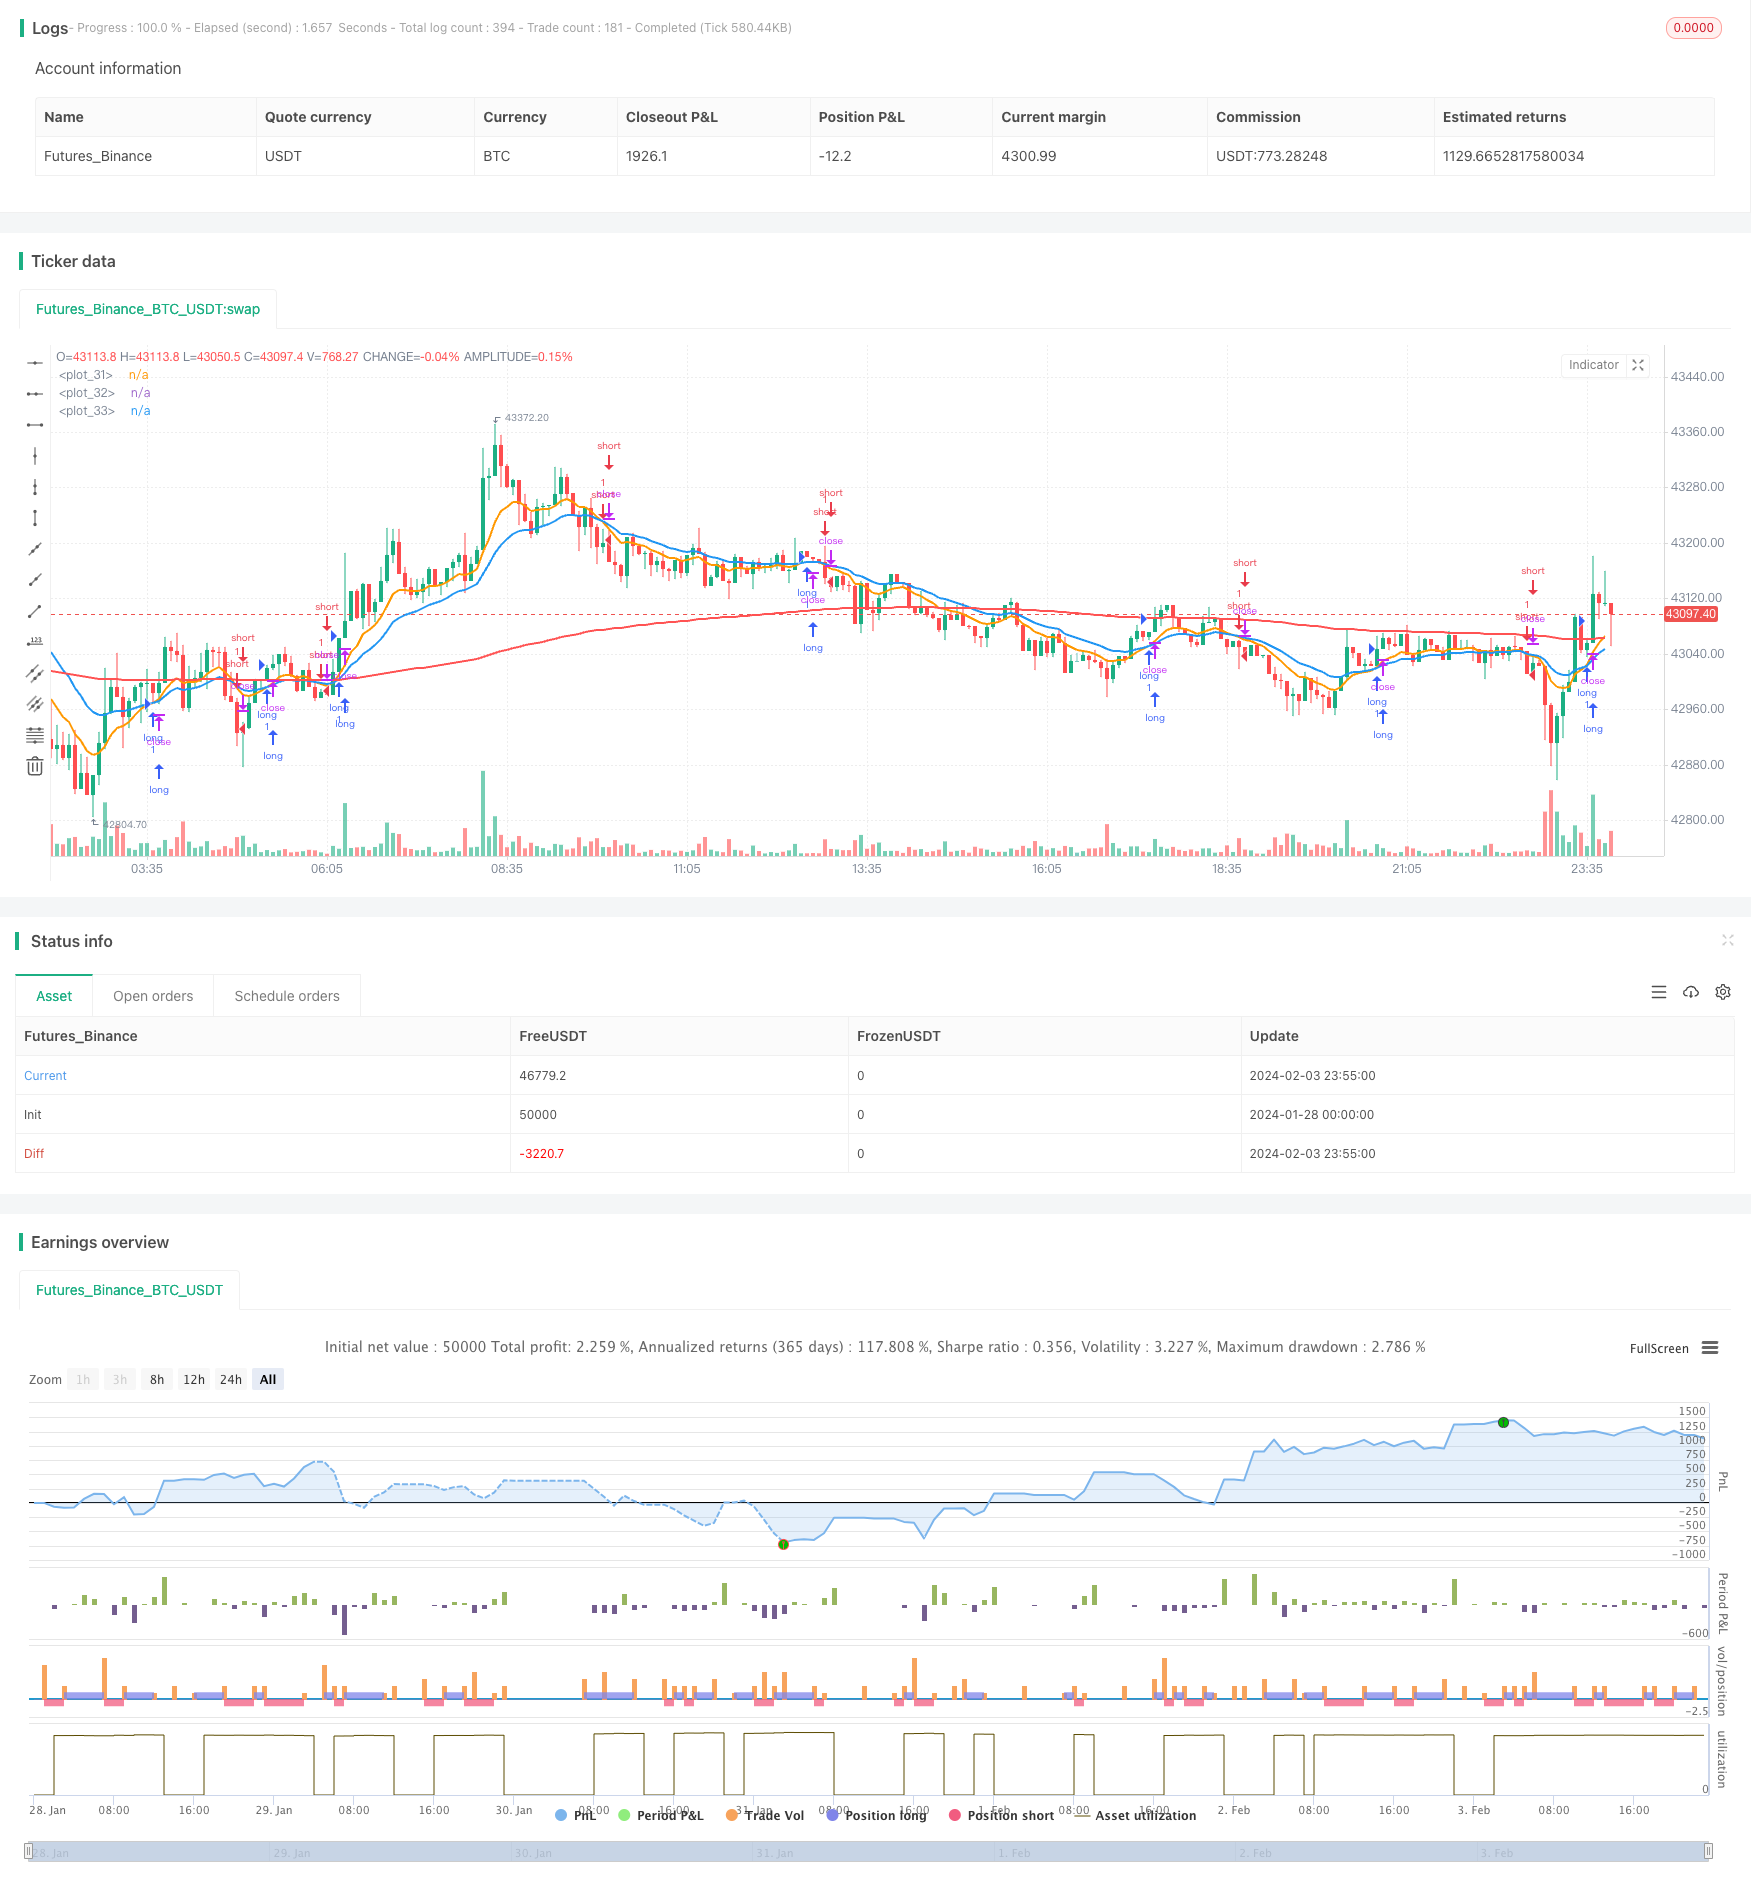
La estrategia de seguimiento de tendencias de cruce de líneas de movimiento es una estrategia de negociación cuantitativa que sigue las tendencias del mercado. La estrategia se basa en calcular las líneas de movimiento rápido y las líneas de movimiento lento, y en generar señales de negociación cuando se cruzan, para capturar los puntos de inflexión de las tendencias del mercado.
Principio de estrategia
El principio central de la estrategia es el uso de diferentes parámetros para juzgar la tendencia del mercado. La estrategia define un EMA rápido y un EMA lento. Cuando el EMA rápido atraviesa el EMA lento desde abajo, el mercado se vuelve bull; cuando el EMA rápido atraviesa el EMA lento desde arriba hasta abajo, el mercado se vuelve bear.
La estrategia abrirá una carta más cuando se ponga arriba y una carta vacía cuando se ponga abajo. La estrategia mantendrá la posición hasta que se active el stop loss o se produzca una nueva señal de reversión cruzada.
Análisis de las ventajas
La estrategia tiene las siguientes ventajas:
- La lógica de las estrategias es simple, clara, fácil de entender y adecuada para el aprendizaje de los principiantes.
- El uso de EMAs para suavizar los precios puede filtrar el ruido del mercado y identificar tendencias.
- La flexibilidad de ajustar los parámetros para adaptarse a mercados de diferentes ciclos;
- La estrategia se puede extender a versiones de varios períodos de tiempo para mejorar la estabilidad.
Análisis de riesgos
La estrategia también tiene sus riesgos:
- En situaciones de crisis, puede haber múltiples paradas de pérdidas que afecten a las ganancias.
- No se puede identificar eficazmente el tipo de tendencia (bull o bear), lo que puede suponer grandes pérdidas.
- La configuración incorrecta de los parámetros EMA puede causar una frecuencia de negociación excesiva o un retraso en la identificación.
Para reducir el riesgo, se puede considerar la combinación de otros indicadores para determinar el tipo de tendencia, o establecer un Stop Loss Ratio más flexible.
Dirección de optimización
La estrategia también puede ser optimizada en los siguientes aspectos:
- El análisis de las tendencias de los tipos de mercado, para evitar inversiones.
- El objetivo de este proyecto es mejorar la calidad de las señales mediante el aumento de la capacidad de discernimiento en múltiples períodos de tiempo.
- El objetivo de este proyecto es mejorar la calidad de vida de las personas que viven en el extranjero.
- En combinación con otros indicadores, las señales de filtración reducen el error de transacción.
Resumir
La estrategia de seguimiento de tendencias de cruce de línea media móvil es una estrategia de comercio de tendencias sencilla y práctica en general. La idea central de la estrategia es clara y fácil de practicar, pero también hay cierto espacio para la optimización. A través de ajustes de parámetros, juicios de varios períodos y paradas dinámicas, se puede mejorar continuamente la estabilidad y el nivel de rentabilidad de la estrategia.
/*backtest
start: 2024-01-28 00:00:00
end: 2024-02-04 00:00:00
period: 5m
basePeriod: 1m
exchanges: [{"eid":"Futures_Binance","currency":"BTC_USDT"}]
*/

//@version=5
strategy('Zhukov trade', overlay=true, calc_on_every_tick=true, currency=currency.USD)

// INPUT:

// Options to enter fast and slow Exponential Moving Average (EMA) values
emaFast = input.int(title='Fast EMA', defval=10, minval=1, maxval=9999)
emaSlow = input.int(title='Slow EMA', defval=20, minval=1, maxval=9999)

// Option to select trade directions
tradeDirection = input.string(title='Trade Direction', options=['Long', 'Short', 'Both'], defval='Both')

// Options that configure the backtest date range
startDate = input(title='Start Date', defval=timestamp('01 Jan 2023 00:00'))
endDate = input(title='End Date', defval=timestamp('31 Dec 2030 23:59'))

// Set take profit and stop loss percentages
take_profit_percent = input(1.0, title ="Take Profit Percent") / 100.0
stop_loss_percent = input(1.0, title ="Stop Loss Percent") / 100.0

// CALCULATIONS:

// Use the built-in function to calculate two EMA lines
fastEMA = ta.ema(close, emaFast)
slowEMA = ta.ema(close, emaSlow)
emapos = ta.ema(close, 200)

// PLOT:

// Draw the EMA lines on the chart
plot(series=fastEMA, color=color.new(color.orange, 0), linewidth=2)
plot(series=slowEMA, color=color.new(color.blue, 0), linewidth=2)
plot(series=emapos, color=color.new(color.red, 0), linewidth=2)

// CONDITIONS:

// Check if the close time of the current bar falls inside the date range
inDateRange = true

// Translate input into trading conditions
longOK = tradeDirection == 'Long' or tradeDirection == 'Both'
shortOK = tradeDirection == 'Short' or tradeDirection == 'Both'

// Decide if we should go long or short using the built-in functions
longCondition = ta.crossover(fastEMA, slowEMA) and inDateRange
shortCondition = ta.crossunder(fastEMA, slowEMA) and inDateRange

// ORDERS:

// Submit entry (or reverse) orders
if longCondition and longOK
    strategy.entry(id='long', direction=strategy.long)

if shortCondition and shortOK
    strategy.entry(id='short', direction=strategy.short)

// Exit orders
if strategy.position_size > 0 and longOK
    strategy.exit(id='exit long', from_entry='long', limit=strategy.position_avg_price * (1 + take_profit_percent), stop=strategy.position_avg_price * (1 - stop_loss_percent))

if strategy.position_size < 0 and shortOK
    strategy.exit(id='exit short', from_entry='short', limit=strategy.position_avg_price * (1 - take_profit_percent), stop=strategy.position_avg_price * (1 + stop_loss_percent))