Estrategia de trading de línea de tendencia de pendiente dinámica
Descripción general
La idea central de esta estrategia es utilizar la pendiente dinámica para determinar la dirección de la tendencia de los precios, combinada con la determinación de las rupturas para generar señales de negociación. En concreto, rastrea en tiempo real los nuevos máximos y mínimos de los precios, calcula la pendiente dinámica en función de la variación de los precios en diferentes períodos de tiempo, y luego combina la ruptura de los precios con la línea de tendencia para determinar la señal de los huecos.
Principio de estrategia
La estrategia se divide en los siguientes pasos:
Determinar precios máximos y mínimos: rastrear precios máximos y mínimos dentro de un período determinado (por ejemplo, 20 líneas K) para determinar si se trata de un alto o un bajo innovador
Calcular la pendiente dinámica: el número de líneas K que registran los altos o bajos de la innovación, calcular la pendiente dinámica de los altos y bajos después de un período determinado (por ejemplo, 9 líneas K) desde el punto más alto o más bajo de la innovación
Trazar líneas de tendencia: trazar líneas de tendencia ascendentes y descendentes según la inclinación dinámica
Extensión y actualización de la línea de tendencia: cuando el precio supera la línea de tendencia, se extiende y actualiza la línea de tendencia
Señales de negociación: combinación de la ruptura de la línea de tendencia del precio con señales de sobreventa y baja
Ventajas estratégicas
La estrategia tiene las siguientes ventajas:
Dinámica para determinar la dirección de la tendencia y flexibilidad para responder a los cambios en el mercado
La capacidad de controlar razonablemente el stop loss y el retiro de los pequeños.
Las señales de ruptura son claras y fáciles de implementar
Parámetros personalizables y adaptabilidad
La estructura del código es clara, fácil de entender y rediseñar
Riesgos y soluciones
La estrategia también tiene sus riesgos:
En el caso de las fluctuaciones de tendencias, se recomienda la inclusión de condiciones de filtrado.
Es probable que haya más señales falsas de ruptura, se pueden ajustar los parámetros o agregar condiciones de filtrado adecuadamente
El riesgo de pérdidas en caso de cambios drásticos en la situación puede aumentar la magnitud de las pérdidas
El espacio de optimización es limitado y la rentabilidad limitada, adecuada para operaciones de corta línea.
Dirección de optimización
Algunas de las áreas en las que se puede optimizar esta estrategia son:
Añadir más indicadores técnicos para juzgar las señales de filtración
Optimización de la combinación de parámetros para encontrar el mejor
El objetivo es mejorar las estrategias de stop loss y reducir el riesgo.
Añadir la función de ajuste automático de la amplitud de entrada
Intentar encontrar más oportunidades en combinación con otras estrategias
Resumir
La estrategia en su conjunto es una estrategia de línea corta altamente eficiente basada en la inclinación dinámica para juzgar la tendencia y romper la operación. Es una estrategia de línea corta precisa, de riesgo controlado y adecuada para capturar oportunidades de línea corta en el mercado. Al optimizar aún más los parámetros y agregar condiciones de filtración, se puede mejorar la tasa de victoria de la estrategia y los niveles de ganancias.
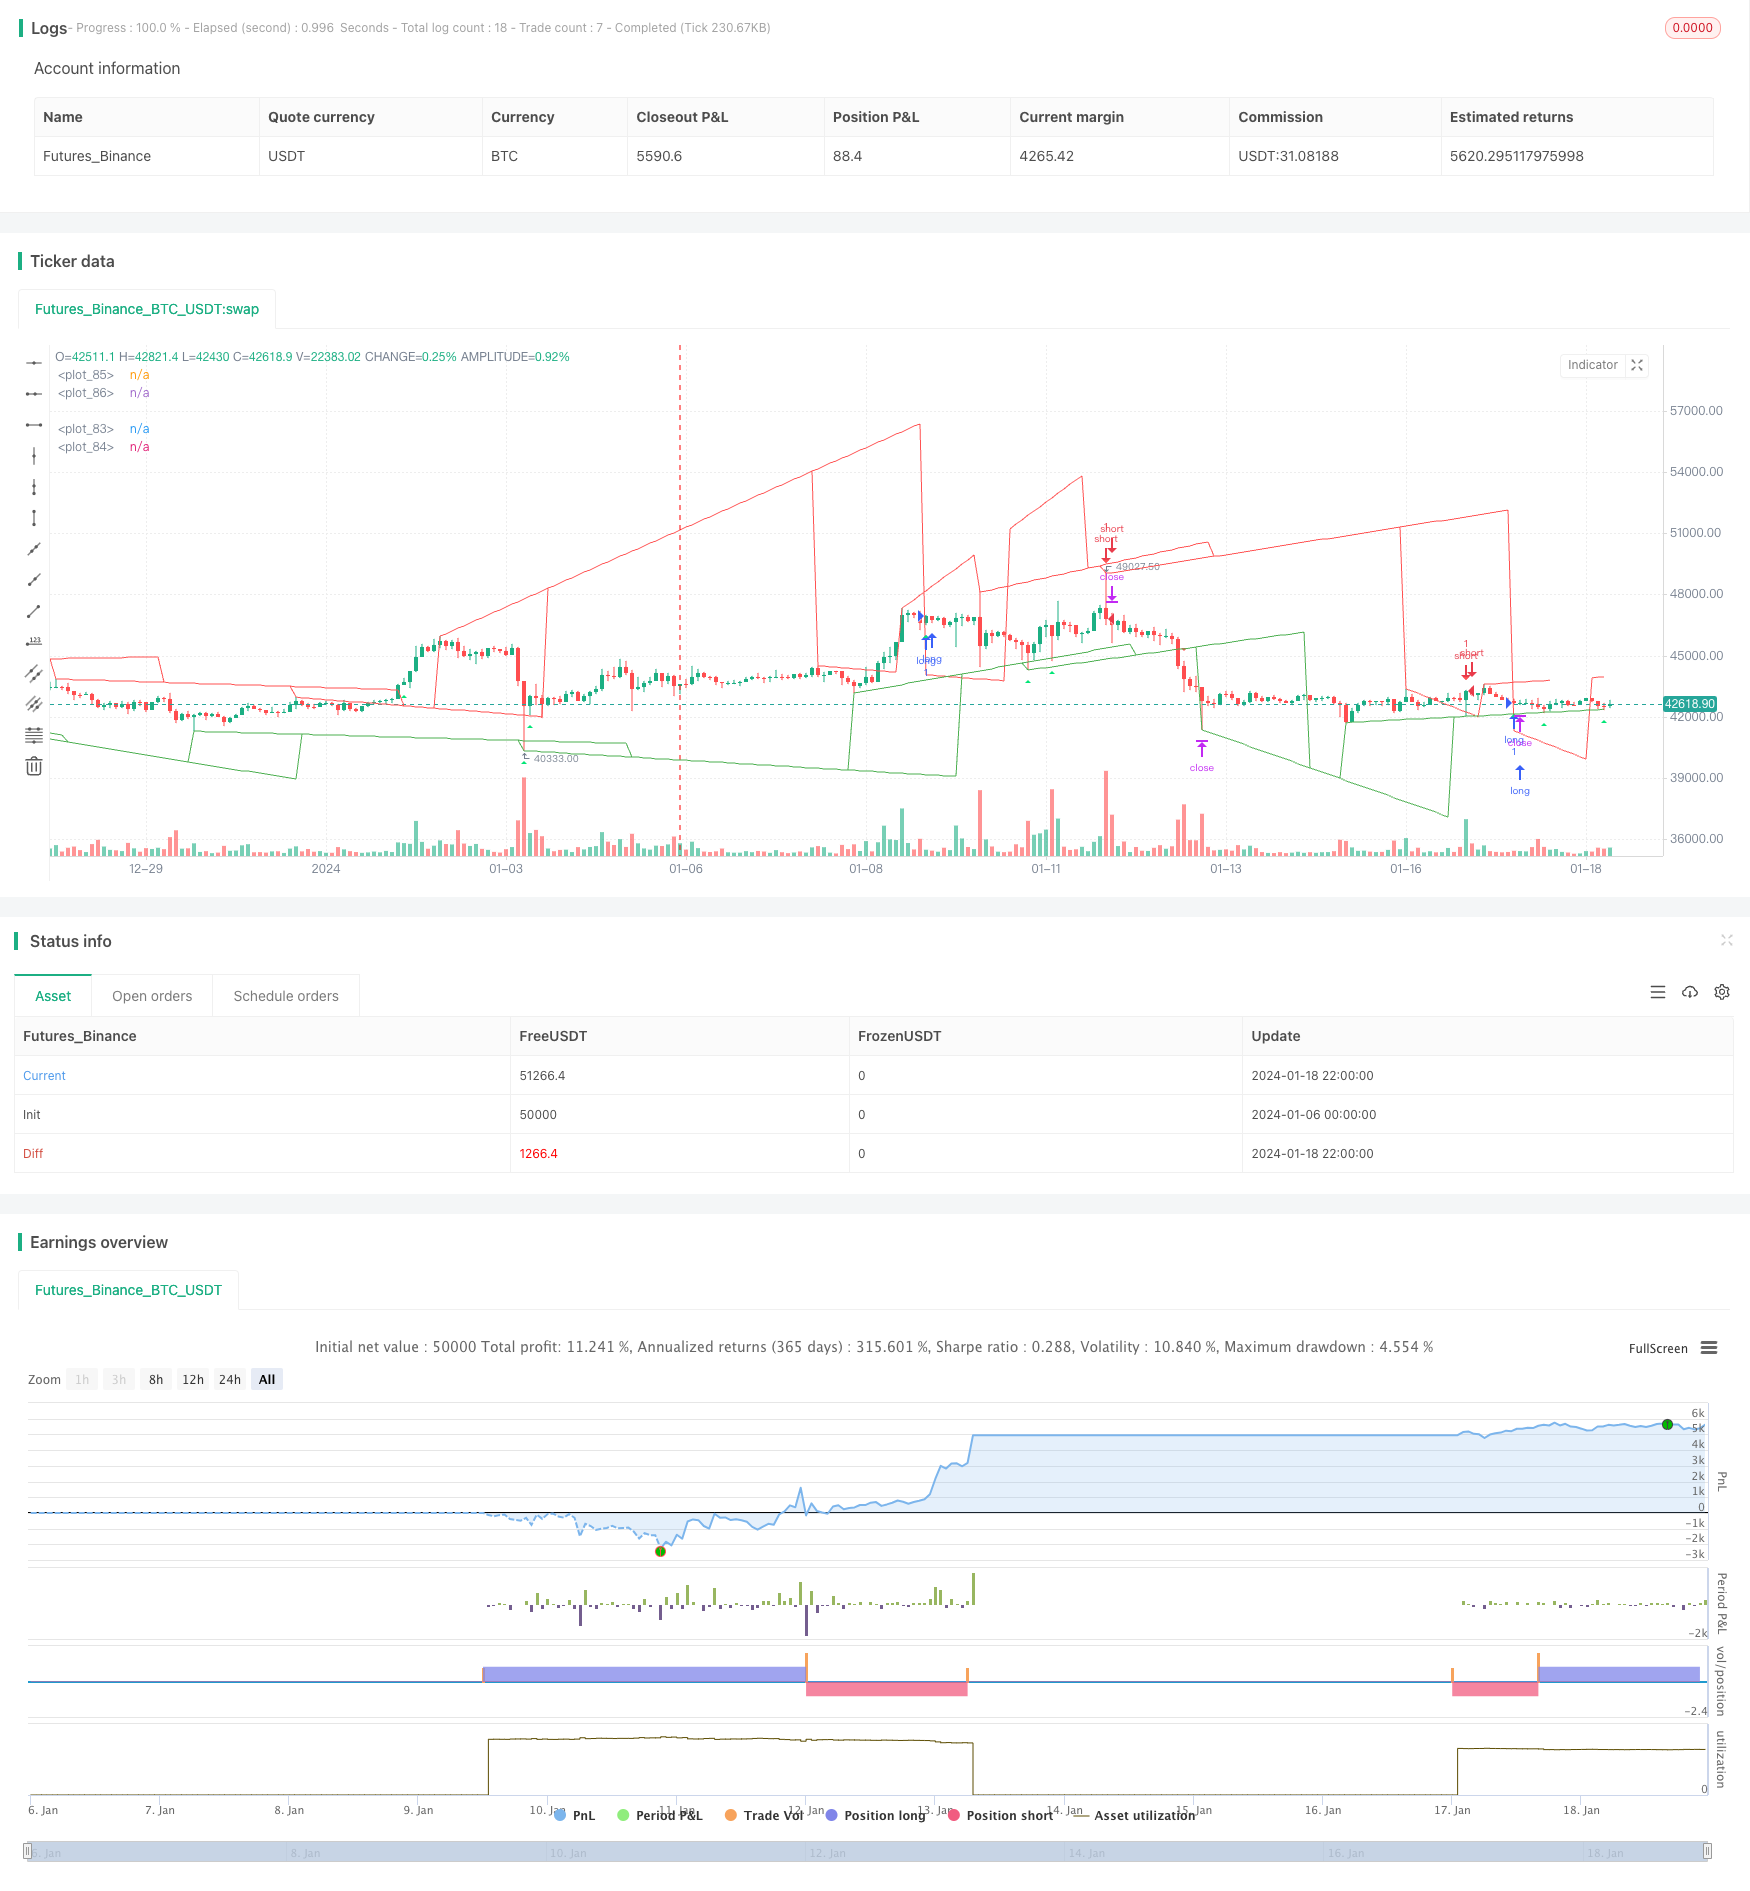
/*backtest
start: 2024-01-06 00:00:00
end: 2024-01-19 00:00:00
period: 2h
basePeriod: 15m
exchanges: [{"eid":"Futures_Binance","currency":"BTC_USDT"}]
*/

// This source code is subject to the terms of the Mozilla Public License 2.0 at https://mozilla.org/MPL/2.0/
// © pune3tghai

//Originally posted by matsu_bitmex

//tried adding alerts on plots and cleared the chart for a cleaner view.
//Publishing the script in hope of getting it improved by someone else.

//Added strategy code for easier calculations

//Needs work on TP and SL part.

//P.S - THE ORIGINAL CODE IS MUCH BETTER BUT I have tried to be more usable and understandable.

//@version=4
strategy("TrendLines with Alerts", overlay=true)     //study("TrendLines with Alerts", overlay=true)
//update

length1 = input(20)
check = input(9)
//length2 = input(200)


u=0.0
u := u[1]

l=0.0
l := l[1]

y=0.0
y := y[1]

yl=0.0
yl := yl[1]

angle = 0.0
angle := angle[1]

anglel = 0.0
anglel := anglel[1]

if (highest(length1) == high[check] and highest(length1) == highest(length1)[check] and barssince(barstate.isfirst) > check)
    u := high[check]


if (lowest(length1) == low[check] and lowest(length1) == lowest(length1)[check] and barssince(barstate.isfirst) > check)
    l := low[check]


p = round(barssince(u == high[check]))

pl = round(barssince(l == low[check]))

if p == 0 and barssince(barstate.isfirst) > check
    y := high[abs(p[1]+1+check)]

if pl == 0 and barssince(barstate.isfirst) > check
    yl := low[abs(pl[1]+1+check)]


if p == 0
    angle := (u-y)/p[1]

if pl == 0
    anglel := (l-yl)/pl[1]

uppertrend = u+ (p * angle)

lowertrend = l+ (pl * anglel)

extendup = if barssince(barstate.isfirst) > check
    uppertrend[check] + angle[check] * check*2

extenddown = if barssince(barstate.isfirst) > check
    lowertrend[check] + anglel[check] * check*2


//plot(l[offset]-u,color=red)
//plot(u[offset]-l,color = green )
plot(lowertrend, color = color.green, transp=30,offset = -check)
plot(extenddown, color = color.green, transp=100)
plot(uppertrend, color = color.red, transp=30, offset = -check)
plot(extendup, color = color.red, transp=100)
//plot(l[offset], color = red)

l1 = lowertrend
l2 = extenddown
u1 = uppertrend
u2 = extendup


l2sell = crossunder(high, l2)
u2buy = crossover(low, u2)
buy1 = (low<=lowertrend) and open>lowertrend and high>lowertrend and close>lowertrend
buy2 = (low<=extenddown) and open>extenddown and high>extenddown and close>extenddown
buy = buy1 or buy2 or u2buy
plotshape(series=buy, title="Buy", style=shape.triangleup, size=size.tiny, color=color.lime, location=location.belowbar)
sell1 = (high>=uppertrend) and open<uppertrend and low<uppertrend and close<uppertrend
sell2 = (high>=extendup) and open<extendup and low<extendup and close<extendup
sell = sell1 or sell2 or l2sell
plotshape(series=sell, title="Sell", style=shape.triangledown, size=size.tiny, color=color.red, location=location.abovebar)

longCond = buy
shortCond = sell

tp = input(0.2, title="Take Profit")

tpbuyval = valuewhen(buy, close, 1) + (tp/100)*(valuewhen(buy, close, 1))
tpsellval = valuewhen(sell, close, 1) - (tp/100)*(valuewhen(sell, close, 1))


sl = input(0.2, title="Stop Loss")
slbuyval = valuewhen(buy, close, 0) - (sl/100)*(valuewhen(buy, close, 0))
slsellval = valuewhen(sell, close, 0) + (sl/100)*(valuewhen(sell, close, 0))
// === STRATEGY ===
tradeType = input("BOTH", title="What trades should be taken : ", options=["LONG", "SHORT", "BOTH", "NONE"])

// stop loss
slPoints = input(defval=0, title="Initial Stop Loss Points (zero to disable)", minval=0)
tpPoints = input(defval=0, title="Initial Target Profit Points (zero for disable)", minval=0)

//>>>>>>>>>>>>>>>>>>>>>>>>>>>>>>>>>>>>>>>>>>>>>>>>>>>>>>>>>>>>>>>>>>>>>>>>>>>>>//

testStartYear = input(2019, "Backtest Start Year", minval=1980)
testStartMonth = input(1, "Backtest Start Month", minval=1, maxval=12)
testStartDay = input(1, "Backtest Start Day", minval=1, maxval=31)
testPeriodStart = timestamp(testStartYear, testStartMonth, testStartDay, 0, 0)

testStopYear = input(9999, "Backtest Stop Year", minval=1980)
testStopMonth = input(12, "Backtest Stop Month", minval=1, maxval=12)
testStopDay = input(31, "Backtest Stop Day", minval=1, maxval=31)
testPeriodStop = timestamp(testStopYear, testStopMonth, testStopDay, 0, 0)

testPeriod() =>
    time >= testPeriodStart and time <= testPeriodStop ? true : false

//<<<<<<<<<<<<<<<<<<<<<<<<<<<<<<<<<<<<<<<<<<<<<<<<<<<<<<<<<<<<<<<<<<<<<<<<<<<<<//

//
//set up exit parameters
TP = tpPoints > 0 ? tpPoints : na
SL = slPoints > 0 ? slPoints : na

// Make sure we are within the bar range, Set up entries and exit conditions
if testPeriod() and tradeType != "NONE"
    strategy.entry("long", strategy.long, when=longCond == true and tradeType != "SHORT")
    strategy.entry("short", strategy.short, when=shortCond == true and tradeType != "LONG")
    strategy.close("long", when=shortCond == true and tradeType == "LONG")
    strategy.close("short", when=longCond == true and tradeType == "SHORT")
    strategy.exit("XL", from_entry="long", profit=tpbuyval, loss=slbuyval)
    strategy.exit("XS", from_entry="short", profit=tpsellval, loss=slsellval)

// === /STRATEGY ===
//EOF


////ALERT SYNTEX
//alertcondition(longCond, title="Long", message="Killer Market")
//alertcondition(shortCond, title="Short", message="Poopy Market")