Estrategia sólida como una roca para la tortuga
Descripción general
La estrategia de la playa de la roca es una estrategia de comercio cuantitativa que sigue las reglas de negociación de la playa de Brady. Utiliza el método de entrada de ruptura de precios, trazado de la salida de la parada de pérdidas, calcula el tamaño de la posición en función de la amplitud real de la onda, y controla estrictamente la pérdida individual. La estrategia funciona de manera estable a largo plazo y es resistente a las caídas y retrocesos, como la roca dura.
Principio de estrategia
Reglas de ingreso
La estrategia de pirata de piedra dura en la entrada de ruptura. Específicamente, calcula el precio más alto y el precio más bajo en un período determinado según los parámetros del ciclo de ruptura de la entrada.
Por ejemplo, si el parámetro de ciclo de entrada es de 20 líneas K, la estrategia extraerá los precios más altos y más bajos de las 20 líneas K más recientes. Si el precio de cierre de la línea K actual es superior al precio más alto de las últimas 20 líneas K, la estrategia emitirá una orden de parada adicional en la posición de cierre de la línea, esperando que el precio de entrada supere el precio más alto.
Reglas de juego
La estrategia de piragüismo sólido como la roca sigue la salida de la parada de pérdidas. Se calcula dinámicamente el precio más alto y el precio más bajo en un período determinado en función de los parámetros del ciclo de salida de entrada. Esto se convierte en la salida de la estrategia.
Cuando se mantiene una posición de más de una posición, se cancela la posición si el precio cae por encima del precio más bajo de la salida de la vía. Por el contrario, cuando se mantiene una posición de más de una posición, se cancela la posición si el precio cae por encima del precio más alto de la salida de la vía.
Además, la estrategia también calcula el stop loss en función de la amplitud real, como la última línea de parada. Siempre que el precio no rompa el canal de salida, el stop loss seguirá la corrección para garantizar que el stop loss sea lo suficientemente bueno, que no sea demasiado radical para causar pérdidas innecesarias, ni demasiado lejos para controlar eficazmente las pérdidas.
El tamaño de la posición
La estrategia de piragüismo sólido como la roca calcula el tamaño de una sola posición en función de la amplitud real. En concreto, primero calcula el porcentaje de pérdidas potenciales cerca del precio de entrada y luego retrotrae el tamaño de la posición en función de los parámetros de riesgo esperados.
Análisis de las ventajas
Funcionamiento estable
Las estrategias de piras de piedra siguen las reglas de negociación de las piras de Brady, aplicando estrictamente las reglas de entrada y salida, y no cambian a la ligera. Esto permite que las estrategias funcionen de manera estable a largo plazo, sin que el sistema falle debido a errores de juicio temporales.
Resistencia a las recaídas
La estrategia utiliza el método de entrada de ruptura de precios, que puede evitar el riesgo de entrada de alto nivel de fallo, lo que reduce la posibilidad de pérdidas sistemáticas. Al mismo tiempo, la adopción de un método de seguimiento de pérdidas para asegurar el control de las pérdidas individuales y limitar al máximo la reversión causada por pérdidas continuas.
El riesgo está bajo control
La estrategia de calcular la posición a través de la amplitud real de la onda, controlar estrictamente la pérdida máxima de cada operación dentro de los límites permitidos, evitar el exceso de riesgo causado por una sola pérdida de gran tamaño. Al mismo tiempo, la adopción de un método de seguimiento de la parada de pérdidas para garantizar la distancia de parada adecuada, puede detener los pérdidas a tiempo y controlar el riesgo de manera efectiva.
Análisis de riesgos
El riesgo de fracaso
Si la ruptura de la conmoción no es conducida por el mercado, es fácil que se formen señales falsas que causan pérdidas de entrada errónea del sistema. En este caso, es necesario ajustar los parámetros, aumentar las condiciones de confirmación de entrada y evitar la interferencia de ruido de la ruptura no efectiva.
Riesgos de la optimización de parámetros
Los parámetros de la estrategia, como el ciclo de entrada, el ciclo de salida, etc., están configurados de forma estática. Si el entorno del mercado cambia mucho, estos parámetros pueden no funcionar. En este caso, es necesario volver a evaluar los parámetros establecidos y optimizarlos para adaptarse a las nuevas condiciones del mercado.
Riesgo de fallo en los indicadores técnicos
La estrategia utiliza indicadores técnicos como las banderas para determinar la ruptura del precio. Estos indicadores técnicos pueden no ser válidos cuando las tendencias del mercado y los patrones de fluctuación cambian significativamente.
Dirección de optimización
Aumentar el juicio de tendencias
Se pueden agregar indicadores de tendencia de uso común en la estrategia, como MA, MACD, etc. Cuando se hace más, se determina una tendencia alcista, cuando se hace menos, se determina una tendencia bajista, se puede reducir la pérdida de operaciones invertidas.
El juicio de los marcos de tiempo múltiples
Se pueden introducir indicadores técnicos de un marco de tiempo de nivel superior para un juicio integral. Por ejemplo, la posición de la línea MA en el nivel 86400 puede determinar la dirección general del movimiento y confirmar aún más las señales de operación en el gráfico de tiempo.
Optimización de parámetros dinámicos
Se pueden utilizar métodos como el aprendizaje automático de la máquina para optimizar los parámetros en función de los datos históricos y ajustarlos en tiempo real para adaptarse a los cambios en el entorno del mercado. Esto puede hacer que las estrategias sean más adaptables y estables.
Resumir
Las estrategias de piragüismo sólidas como la roca siguen las reglas clásicas de las estrategias de piragüismo, controlan estrictamente el riesgo, pueden operar de manera estable a largo plazo y tienen una excelente capacidad de resistencia a la caída. Si bien aún se necesitan precauciones contra algunos riesgos, como el fracaso de la ruptura y el fracaso de los parámetros, se pueden reducir eficazmente estos riesgos mediante la introducción de métodos de juicio de tendencia, juicio de marco de tiempo y optimización de parámetros dinámicos.
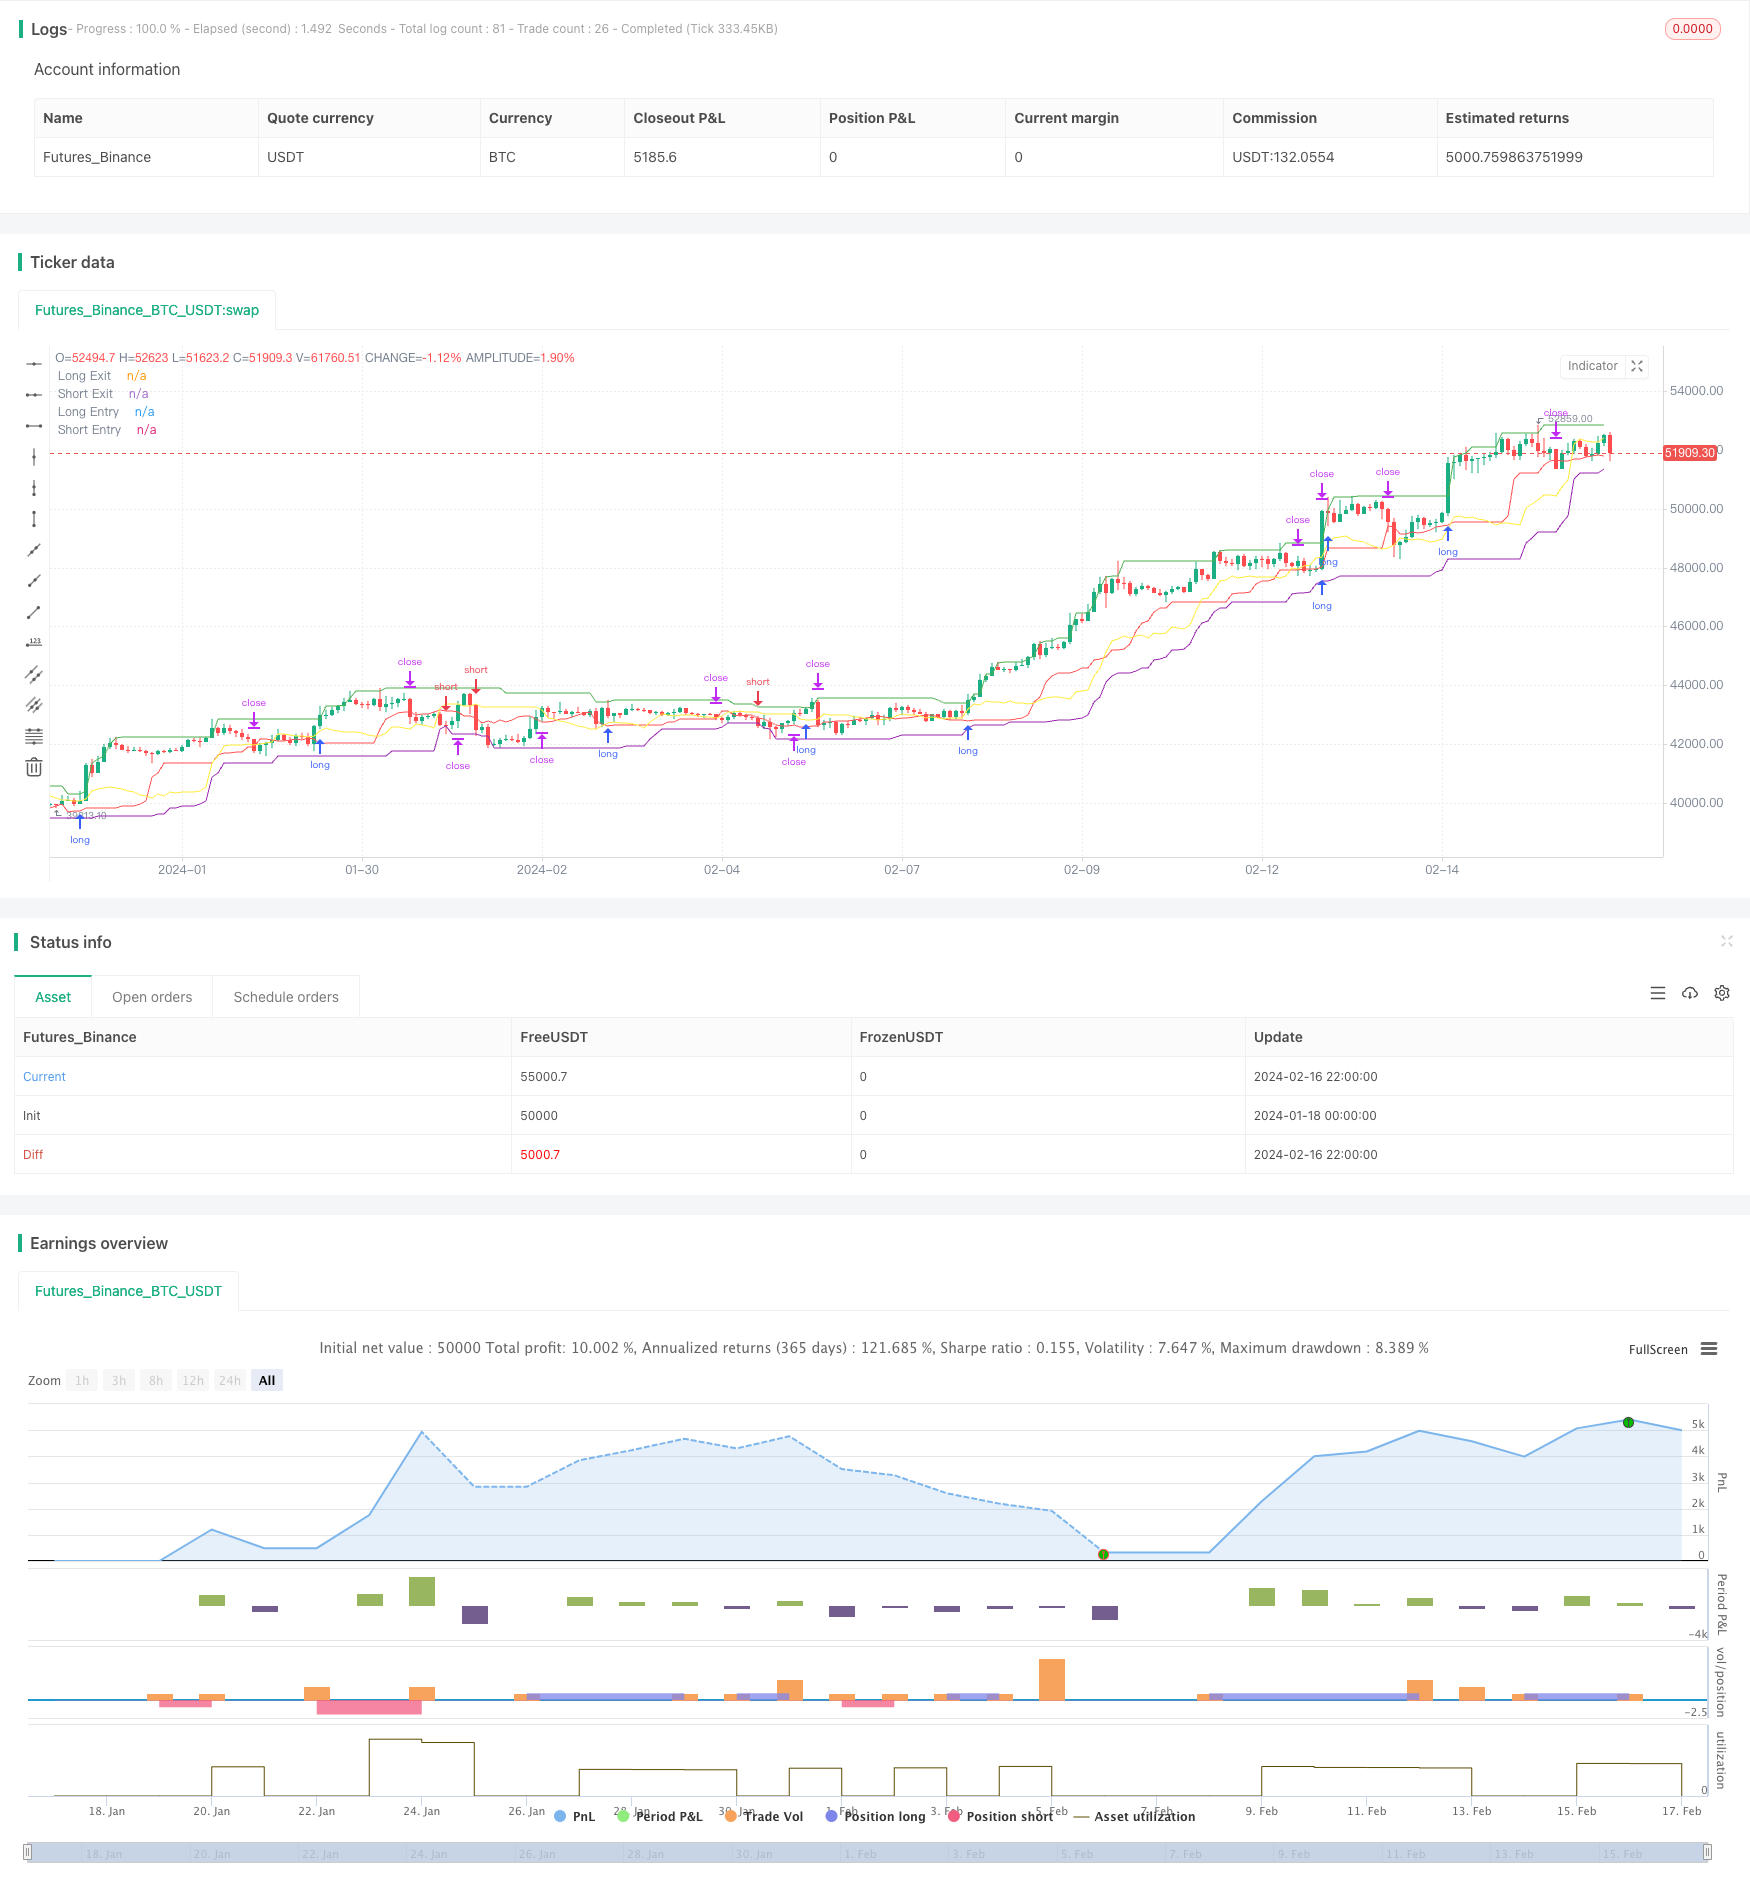
/*backtest
start: 2024-01-18 00:00:00
end: 2024-02-17 00:00:00
period: 2h
basePeriod: 15m
exchanges: [{"eid":"Futures_Binance","currency":"BTC_USDT"}]
*/

//@version=3
strategy("Real Turtle", shorttitle = "Real Turtle", overlay=true, pyramiding=1, default_qty_type= strategy.percent_of_equity,calc_on_order_fills=false, slippage=25,commission_type=strategy.commission.percent,commission_value=0.075)
//////////////////////////////////////////////////////////////////////
// Testing Start dates
testStartYear = input(2016, "Backtest Start Year")
testStartMonth = input(1, "Backtest Start Month")
testStartDay = input(1, "Backtest Start Day")
testPeriodStart = timestamp(testStartYear,testStartMonth,testStartDay,0,0)
//Stop date if you want to use a specific range of dates
testStopYear = input(2030, "Backtest Stop Year")
testStopMonth = input(12, "Backtest Stop Month")
testStopDay = input(30, "Backtest Stop Day")
testPeriodStop = timestamp(testStopYear,testStopMonth,testStopDay,0,0)

// A switch to control background coloring of the test period
// Use if using a specific date range
testPeriodBackground = input(title="Color Background?", type=bool, defval=false)
testPeriodBackgroundColor = testPeriodBackground and (time >= testPeriodStart) and (time <= testPeriodStop) ? #00FF00 : na
bgcolor(testPeriodBackgroundColor, transp=97)

testPeriod() => true
// Component Code Stop
//////////////////////////////////////////////////////////////////////

//How many candles we want to determine our position entry
enterTrade = input(20, minval=1, title="Entry Channel Length")
//How many candles we want ot determine our position exit
exitTrade = input(10, minval=1, title="Exit Channel Length")

//True Range EMA Length
trLength = input(13, minval=1, title="True Range Length")
//Go all in on every trade
allIn = input(false, title="Use whole position on every trade")
dRisk = input(2, "Use Desired Risk %")
//How much of emaTR to use for TS offset
multiEmaTR = input(2, "Desired multiple of ema Tr (N)")
//absolute value (highest high of of this many candles - lowest high of this many candles) . This is used if we want to change our timeframe to a higher timeframe otherwise just works like grabbing high o r low of a candle
//True range is calculated as just high - low. Technically this should be a little more complicated but with 24/7 nature of crypto markets high-low is fine.
trueRange = max(high - low, max(high - close[1], close[1] - low))
//Creates an EMA of the true range by our custom length
emaTR = ema(trueRange, trLength)
//Highest high of how many candles back we want to look as specified in entry channel for long
longEntry = highest(enterTrade)
//loweest low of how many candles back we want to look as specified in exit channel for long
exitLong = lowest(exitTrade)
//lowest low of how many candles back want to look as specified in entry channel for short
shortEntry = lowest(enterTrade)
//lowest low of how many candles back want to look as specified in exit channel for short
exitShort = highest(exitTrade)
//plots the longEntry as a green line
plot(longEntry[1], title="Long Entry",color=green)
//plots the short entry as a purple line
plot(shortEntry[1], title="Short Entry",color=purple)

howFar = barssince(strategy.position_size == 0)
actualLExit = strategy.position_size > 0 ? strategy.position_avg_price - (emaTR[howFar] * multiEmaTR) : longEntry - (emaTR * multiEmaTR)
actualLExit2 = actualLExit > exitLong ? actualLExit : exitLong
actualSExit = strategy.position_size < 0 ? strategy.position_avg_price + (emaTR[howFar] * multiEmaTR) : shortEntry + (emaTR * multiEmaTR)
actualSExit2 = actualSExit < exitShort ? actualSExit : exitShort

//plots the long exit as a red line
plot(actualLExit2[1], title="Long Exit",color=red)
//plots the short exit as a blue line
plot(actualSExit2[1], title="Short Exit",color=yellow)


//Stop loss in ticks
SLLong =(emaTR * multiEmaTR)/ syminfo.mintick
SLShort = (emaTR * multiEmaTR)/ syminfo.mintick


//Calculate our potential loss as a whole percentage number. Example 1 instead of 0.01 for 1% loss. We have to convert back from ticks to whole value, then divided by close
PLLong = ((SLLong * syminfo.mintick) * 100) / longEntry
PLShort = ((SLShort * syminfo.mintick) * 100) / shortEntry
//Calculate our risk by taking our desired risk / potential loss. Then multiple by our equity to get position size. we divide by close because we are using percentage size of equity for quantity in this script as not actual size.
//we then floor the value. which is just to say we round down so instead of say 201.54 we would just input 201 as TV only supports whole integers for quantity.
qtyLong = floor(((dRisk / PLLong) * strategy.equity) /longEntry )
qtyShort = floor(((dRisk / PLShort) * strategy.equity) /shortEntry )
qtyLong2 = allIn ? 100 : qtyLong
qtyShort2 = allIn ? 100 : qtyShort
//Only open long or short positions if we are inside the test period specified earlier
if testPeriod()
    //Open a stop market order at our long entry price and keep it there at the quantity specified. This order is updated/changed on each new candlestick until a position is opened
    strategy.entry("long", strategy.long, stop = longEntry, qty = qtyLong2)
    //sets up or stop loss order by price specified in our actualLExit2 variable
    strategy.exit("Stoploss-Long", "long", stop=actualLExit2)

     //Open a stop market order at our short entry price and keep it there at the quantity specified. This order is updated/changed on each new candlestick until a position is opened
    strategy.entry("short", strategy.short, stop = shortEntry, qty = qtyShort2)
    //sets up or stop loss order by price specified in our actualLExit2 variable
    strategy.exit("Stoploss-Short", "short", stop=actualSExit2)