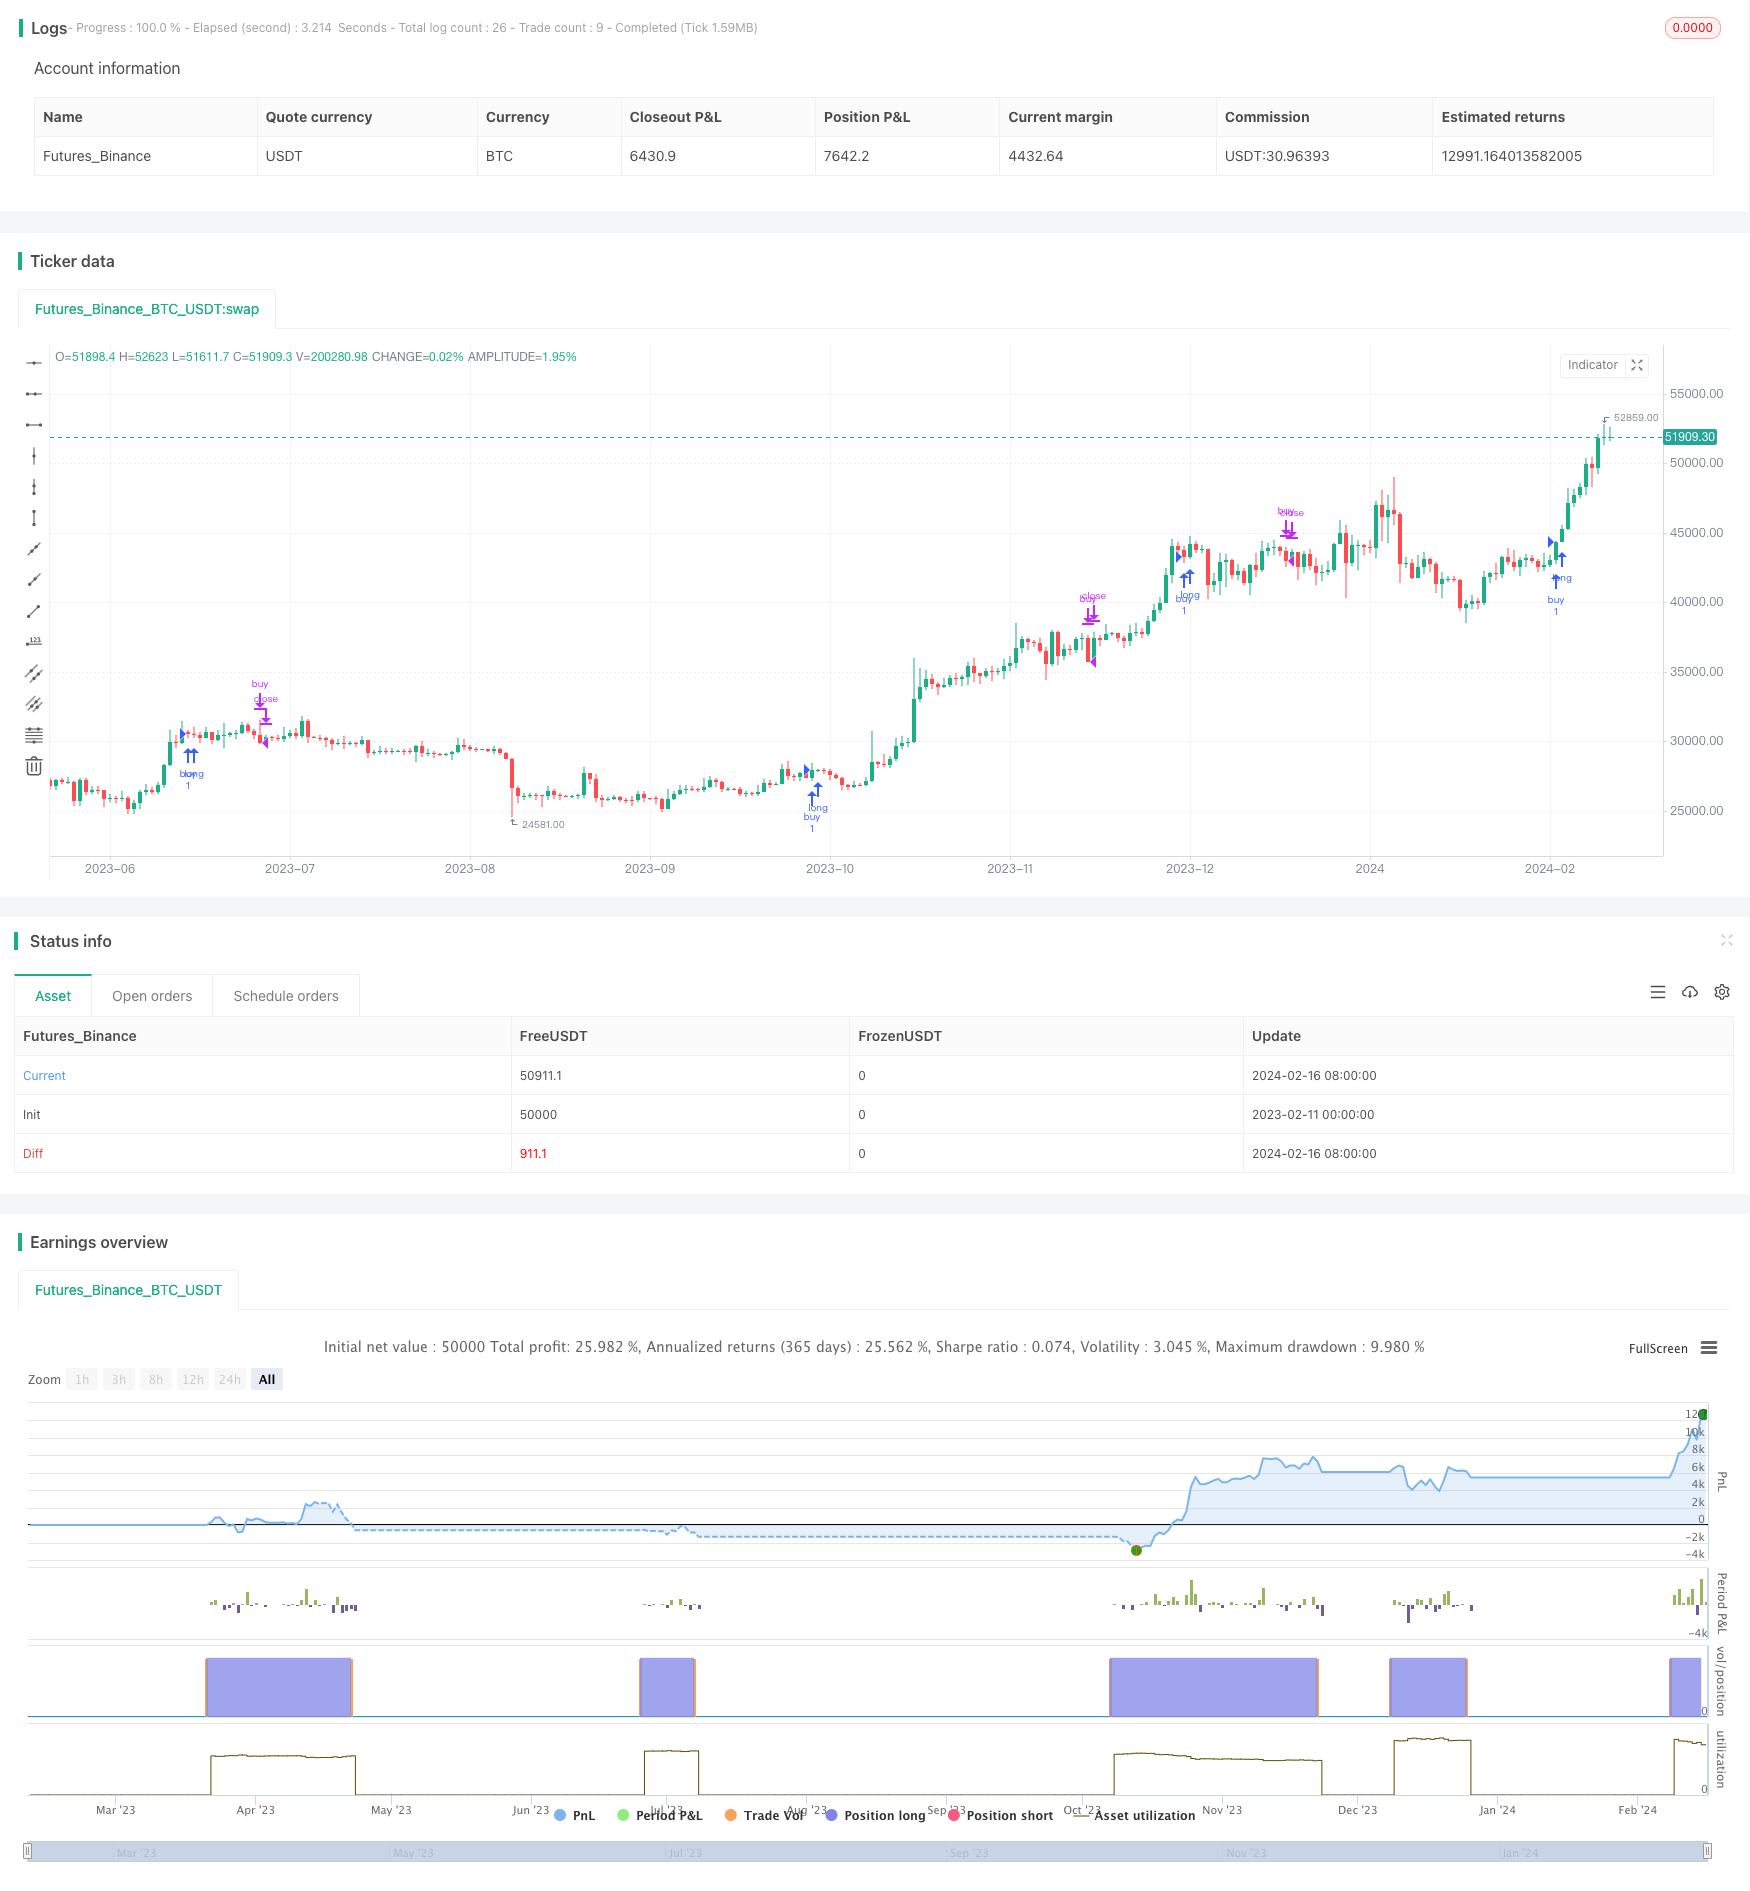
Estrategias comerciales basadas en RSI y RSI estocástico

Descripción general
Esta estrategia de negociación combina el uso de dos indicadores técnicos, el indicador relativamente débil (RSI) y el indicador relativamente débil aleatorio (RSI estocástico) para generar una señal de negociación. La estrategia utiliza adicionalmente el movimiento del precio de la criptomoneda en un marco de tiempo más alto para confirmar la tendencia y aumentar la fiabilidad de la señal.
Nombre de la estrategia
Estrategia de comercio RSI-SRSI en el marco de tiempo múltiple
Principio de estrategia
Esta estrategia determina el exceso de compra y venta en función de los valores del indicador RSI. Cuando el RSI es inferior a 30 es una señal de sobreventa, y cuando es superior a 70 es una señal de sobreventa. El indicador RSI estocástico observa la fluctuación del indicador RSI en sí.
La estrategia se combina con el movimiento del precio de la criptomoneda en un marco de tiempo más alto (por ejemplo, la línea de circunvalación). La estrategia genera una señal de compra y venta solo cuando el RSI en el marco de tiempo más alto es superior a la desvalorización (por ejemplo, 45). Esta configuración filtra las señales de venta excesiva no persistentes que aparecen cuando el conjunto está en una tendencia bajista.
Las señales de compra y venta deben ser confirmadas en un ciclo determinado (por ejemplo, 8 líneas K) después de la activación, para evitar la generación de señales engañosas.
Ventajas estratégicas
- El método clásico de análisis técnico que utiliza el indicador RSI para determinar sobrecompra y sobreventa
- Combinado con el indicador RSI estocástico para identificar la señal de reversión del RSI en sí
- Aplicación de tecnología de filtro de múltiples marcos de tiempo para mejorar la calidad de la señal
Riesgos estratégicos y soluciones
- El RSI es propenso a generar falsas señales
- En combinación con otros indicadores de filtración de señales engañosas
- Aplicaciones de las tecnologías de reconocimiento de tendencias
- La configuración incorrecta de los parámetros de umbral puede generar demasiadas señales de negociación
- Optimización de la combinación de parámetros para encontrar el parámetro óptimo
- Las señales de compra y venta requieren un tiempo de confirmación.
- Encuentre un ciclo de confirmación equilibrado, filtre las señales engañosas y no pierda la oportunidad
Dirección de optimización de la estrategia
- Prueba más combinaciones de indicadores en busca de señales más fuertes
- Por ejemplo, incorporar el indicador MACD a la estrategia
- Intentar el aprendizaje automático para encontrar los parámetros óptimos
- Optimización automática con algoritmos genéticos y evolutivos
- Aumentar las estrategias de control de pérdidas para controlar el riesgo de una sola transacción
- Detenerse cuando el precio cae por debajo del soporte
Resumir
La estrategia se basa principalmente en RSI y RSI estocástico para generar señales comerciales. Al mismo tiempo, la introducción de un marco de tiempo más alto para la confirmación de tendencias puede filtrar eficazmente las señales engañosas y mejorar la calidad de la señal.
/*backtest
start: 2023-02-11 00:00:00
end: 2024-02-17 00:00:00
period: 1d
basePeriod: 1h
exchanges: [{"eid":"Futures_Binance","currency":"BTC_USDT"}]
*/

//@version=5
strategy("RSI and Stochatic Strategy", overlay=true, use_bar_magnifier = false)


/////// Inputs ///////////////

// RSI and SRSI
rsiLength = input(14, title="RSI Length")
stochLength = input(14, title="Stochastic Length")
kSmooth = input(3, title="K Smooth")
dSmooth = input(3, title="D Smooth")


//////// thresholds ///////////////
st_low = input(5, title="Low SRSI") // stochastic RSI low -- prepare to sell
st_hi = input(50, title="High SRSI") // stochastic RSI high -- prepare to buy
diff = input(5, title="difference") // minimum change in RSI
// inval_diff = input(12, title="difference") // invalidation difference: change in the oposite direction that invalidates rsi falling/rising
rsi_low = input(30, title="Low RSI") // RSI considered low
rsi_hi = input(60, title="High RSI") // RSI considered high
rsi_ht_hi = input(45, title="High higher time frame RSI") // RSI in higher time frame considered high


/// buy trigger duration
tr_dur = input(8, title="Trigger duration")
low_dur = input(20, title="Monitoring last low")


///////////////// Higher time frame trend ///////////////////
// higher time frame resolution
res2 = input.timeframe("W", title="Higher time-frame")
// Input for the ticker symbol, default is an empty string
// For instance we could monitor BTC higher time frame trend
symbol = input("BTC_USDT:swap", "Input Ticker (leave empty for current)")

// Determine the symbol to use
inputSymbol = symbol == "" ? syminfo.tickerid : symbol
//////////////////////////////////////////////////////////

// Calculate RSI //
rsi = ta.rsi(close, rsiLength)

// Calculate Stochastic RSI //
rsiLowest = ta.lowest(rsi, stochLength)
rsiHighest = ta.highest(rsi, stochLength)
stochRsi = 100 * (rsi - rsiLowest) / (rsiHighest - rsiLowest)

// Apply smoothing
K = ta.sma(stochRsi, kSmooth)
D = ta.sma(K, dSmooth)

// Higher time Frame RSI
cl2 = request.security(inputSymbol, res2, close)
rsi2 = ta.rsi(cl2, 14)

// SRSI BUY/SELL signals
sell_stoch = (ta.lowest(K, tr_dur) < st_low) or (ta.highest(rsi, tr_dur) < rsi_low)
buy_stoch = ((ta.lowest(K, tr_dur) > st_hi) or (ta.lowest(rsi, tr_dur) > rsi_hi)) and (rsi2 > rsi_ht_hi)

 // valitation / invalidation sell signal
ll = ta.barssince(not sell_stoch)+1
sell_validation = (ta.highest(rsi, ll)>rsi[ll]+diff and rsi < rsi[ll]) or (rsi < rsi[ll]-diff)

// valitation / invalidation buy signal
llb = ta.barssince(not buy_stoch)+1
buy_validation = (ta.lowest(rsi, llb)<rsi[llb]-diff and rsi > rsi[llb]) or (rsi > rsi_hi and rsi - rsi[tr_dur] > 0)

sell_signal = sell_stoch and sell_validation
buy_signal = buy_stoch and buy_validation

// Define the start date for the strategy
startYear = input(2019, "Start Year")
startMonth = input(1, "Start Month")
startDay = input(1, "Start Day")

// Convert the start date to Unix time
startTime = timestamp(startYear, startMonth, startDay, 00, 00)

// Define the end date for the strategy
endYear = input(2030, "End Year")
endMonth = input(1, "End Month")
endDay = input(1, "End Day")

// Convert the end date to Unix time
endTime = timestamp(endYear, endMonth, endDay, 00, 00)


if true
    if buy_signal
        strategy.entry("buy", strategy.long, comment = "Buy")
    if sell_signal
        strategy.close("buy", "Sell")