Bollinger + RSI, stratégie double v1.1
Auteur:ChaoZhang est là., Date: 2022-05-07 14:59:50Les étiquettes:Indice de résistance
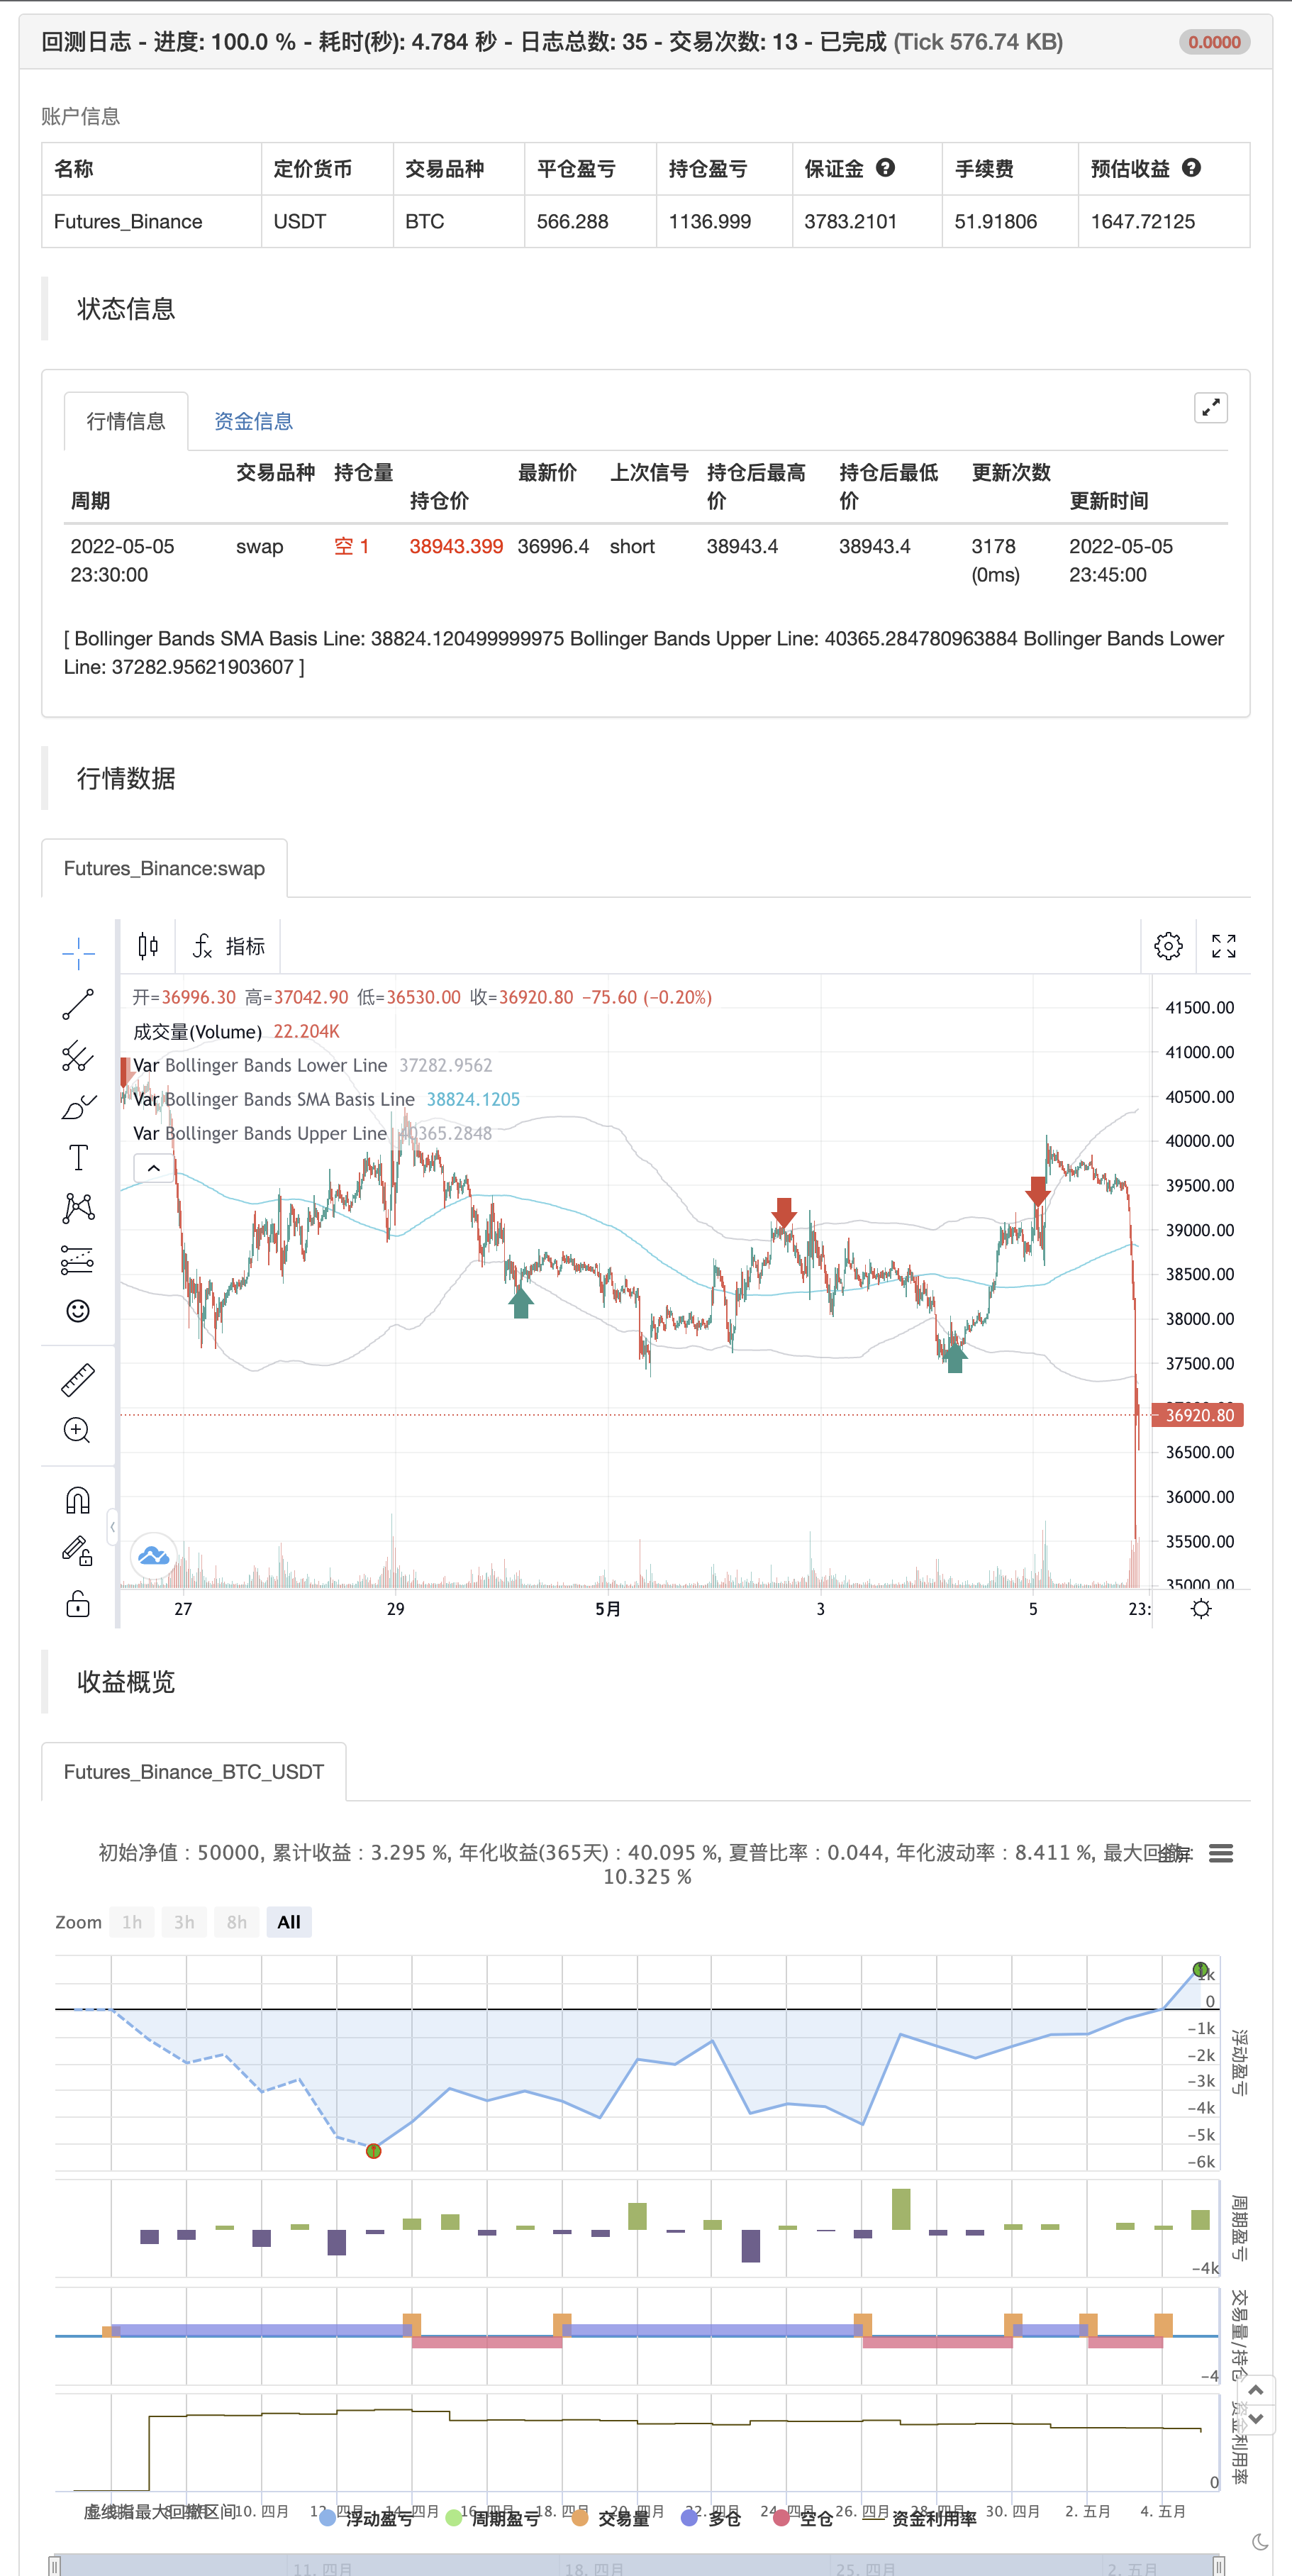
Cette stratégie utilise l'indicateur RSI avec les bandes de Bollinger pour vendre lorsque le prix est au-dessus de la bande de Bollinger supérieure (et pour acheter lorsque cette valeur est en dessous de la bande inférieure).
Mise à jourDans cette version mise à jour 1.1, la stratégie a été à la fois simplifiée pour l'utilisateur (moins d'entrées) et rendue plus efficace dans le backtesting en utilisant maintenant une période de 200 pour le SMA qui est la base de la bande de Bollinger.
Et tout comme la première version, cette stratégie n'utilise pas de prix de clôture à partir d'un délai plus long et ne devrait pas être repeinte après la fermeture de la bougie actuelle.
Toutes les transactions comportent un risque élevé; les performances passées ne sont pas nécessairement indicatives des résultats futurs. Les résultats hypothétiques ou simulés ont certaines limitations inhérentes. Contrairement à un enregistrement de performance réel, les résultats simulés ne représentent pas le trading réel.
P.S. Pour les utilisateurs avancés si vous voulez accéder à plus de fonctions de ce script de stratégie, alors s'il vous plaît utiliser la version 1.0:Réécriture
/*backtest
start: 2022-04-06 00:00:00
end: 2022-05-05 23:59:00
period: 15m
basePeriod: 5m
exchanges: [{"eid":"Futures_Binance","currency":"BTC_USDT"}]
*/

//@version=2
strategy("Bollinger + RSI, Double Strategy (by ChartArt) v1.1", shorttitle="CA_-_RSI_Bol_Strat_1.1", overlay=true)

// ChartArt's RSI + Bollinger Bands, Double Strategy - Update
//
// Version 1.1
// Idea by ChartArt on January 18, 2015.
//
// This strategy uses the RSI indicator
// together with the Bollinger Bands
// to sell when the price is above the
// upper Bollinger Band (and to buy when
// this value is below the lower band).
//
// This simple strategy only triggers when
// both the RSI and the Bollinger Bands
// indicators are at the same time in
// a overbought or oversold condition.
//
// In this version 1.1 the strategy was
// both simplified for the user and
// made more successful in backtesting.
//
// List of my work:
// https://www.tradingview.com/u/ChartArt/
//
//  __             __  ___       __  ___
// /  ` |__|  /\  |__)  |   /\  |__)  |
// \__, |  | /~~\ |  \  |  /~~\ |  \  |
//
//


///////////// RSI
RSIlength = input(6,title="RSI Period Length")
RSIoverSold = 50
RSIoverBought = 50
price = close
vrsi = rsi(price, RSIlength)


///////////// Bollinger Bands
BBlength = input(200, minval=1,title="Bollinger Period Length")
BBmult = 2 // input(2.0, minval=0.001, maxval=50,title="Bollinger Bands Standard Deviation")
BBbasis = sma(price, BBlength)
BBdev = BBmult * stdev(price, BBlength)
BBupper = BBbasis + BBdev
BBlower = BBbasis - BBdev
source = close
buyEntry = crossover(source, BBlower)
sellEntry = crossunder(source, BBupper)
plot(BBbasis, color=aqua,title="Bollinger Bands SMA Basis Line")
p1 = plot(BBupper, color=silver,title="Bollinger Bands Upper Line")
p2 = plot(BBlower, color=silver,title="Bollinger Bands Lower Line")
//fill(p1, p2)


///////////// Colors
switch1=input(true, title="Enable Bar Color?")
switch2=input(true, title="Enable Background Color?")
TrendColor = RSIoverBought and (price[1] > BBupper and price < BBupper) and BBbasis < BBbasis[1] ? red : RSIoverSold and (price[1] < BBlower and price > BBlower) and BBbasis > BBbasis[1] ? green : na
///barcolor(switch1?TrendColor:na)
//bgcolor(switch2?TrendColor:na,transp=50)


///////////// RSI + Bollinger Bands Strategy
if (not na(vrsi))

    if (crossover(vrsi, RSIoverSold) and crossover(source, BBlower))
        strategy.entry("RSI_BB_L", strategy.long, stop=BBlower,  comment="RSI_BB_L")

    if (crossunder(vrsi, RSIoverBought) and crossunder(source, BBupper))
        strategy.entry("RSI_BB_S", strategy.short, stop=BBupper,  comment="RSI_BB_S")

//plot(strategy.equity, title="equity", color=red, linewidth=2, style=areabr)
- Le MACD RSI Ichimoku est une tendance de dynamique à la suite d'une longue stratégie.
- RSI Stratégie de changement de direction
- Stratégie de négociation des bandes de Bollinger améliorées RSI
- Stratégie de pivot et de dynamique
- Stratégie de négociation complète des moyennes mobiles et du RSI
- Stratégie de redressement du mardi (filtre du week-end)
- La stratégie de croisement renforcée de l'EMA avec le RSI/MACD/ATR
- Stratégie de négociation à long terme combinée MACD et RSI
- RSI2 Stratégie Réversion intradienne Taux de victoire Test de retour
- Tendance multi-indicateurs à la suite de la stratégie
- Stratégie de négociation AlphaTradingBot
- Baguette à base de grains multiples
- La machine à meuler
- Indicateur d'inversion de K I
- Des bougies engloutissantes
- L' empereur est incapable de
- Points de retournement de Demark
- Modèles d'altitude et de baisse et de bougies
- TMA surchargée
- La stratégie MACD + SMA 200
- Système de tir à la fronde CM
- Stratégie des bandes de Bollinger
- Traqueur de tendance optimisé
- Retours mensuels dans les stratégies PineScript
- ADX et DI pour v4
- MacD Indicateur personnalisé - Cadre de temps multiples + Toutes les options disponibles!
- Indicateur: oscillateur de tendance d'onde
- Indicateur de momentum de compression
- AlphaTrend
- négociation sur plusieurs délais
- Oscillateur de sentiment