RSI - Signaux d'achat et de vente
Auteur:ChaoZhang est là., Date: 2022-05-09 14h35 et 23hLes étiquettes:Indice de résistance
Cet indicateur est principalement basé sur le surachat et le survente. La base principale de l'indicateur est la suivante: Pour acheter, l'indicateur attend que l'instrument soit survendu du point de vue du RSI. Ensuite, si le graphique traverse la ligne inférieure de l'indicateur Enveloppe de bas en haut, un signal d'achat est émis. Pour vendre, l'indicateur attend que l'instrument soit suracheté du point de vue du RSI. La base générale est la consonance entre le prix et l'indicateur RSI. Les meilleurs réglages que j' ai inventés moi-même: Temps: 15 minutes Suracheté: 80 Ventes excédentaires: RSI longueur: 8 Il peut être fait sur différents instruments, mais fixez toujours vos limites de profit et de perte. (Le ratio bénéfice/perte de cet indicateur peut être de 1:1.)
Avertissement: Ces informations et indicateurs de trading et outils fournis ne sont ni ne doivent être interprétés comme une offre, ou une sollicitation d'une offre, d'achat ou de vente de titres. Vous êtes entièrement responsable de toute décision d'investissement que vous prenez, et ces décisions seront basées uniquement sur votre évaluation de votre situation financière, vos objectifs d'investissement, votre tolérance au risque et vos besoins en liquidité. Je ne suis pas responsable des bénéfices, des améliorations financières, des pertes ou des dommages, monétaires ou autres, qui pourraient résulter de l'application des informations contenues dans cet indicateur. Les traders individuels doivent faire preuve de leur propre diligence raisonnable en analysant les indicateurs de trading, autres outils de trading, webinaires et autres matériels éducatifs pour déterminer s'ils représentent des fonctionnalités et des capacités appropriées et utilisables pour le trader individuel.
test de retour
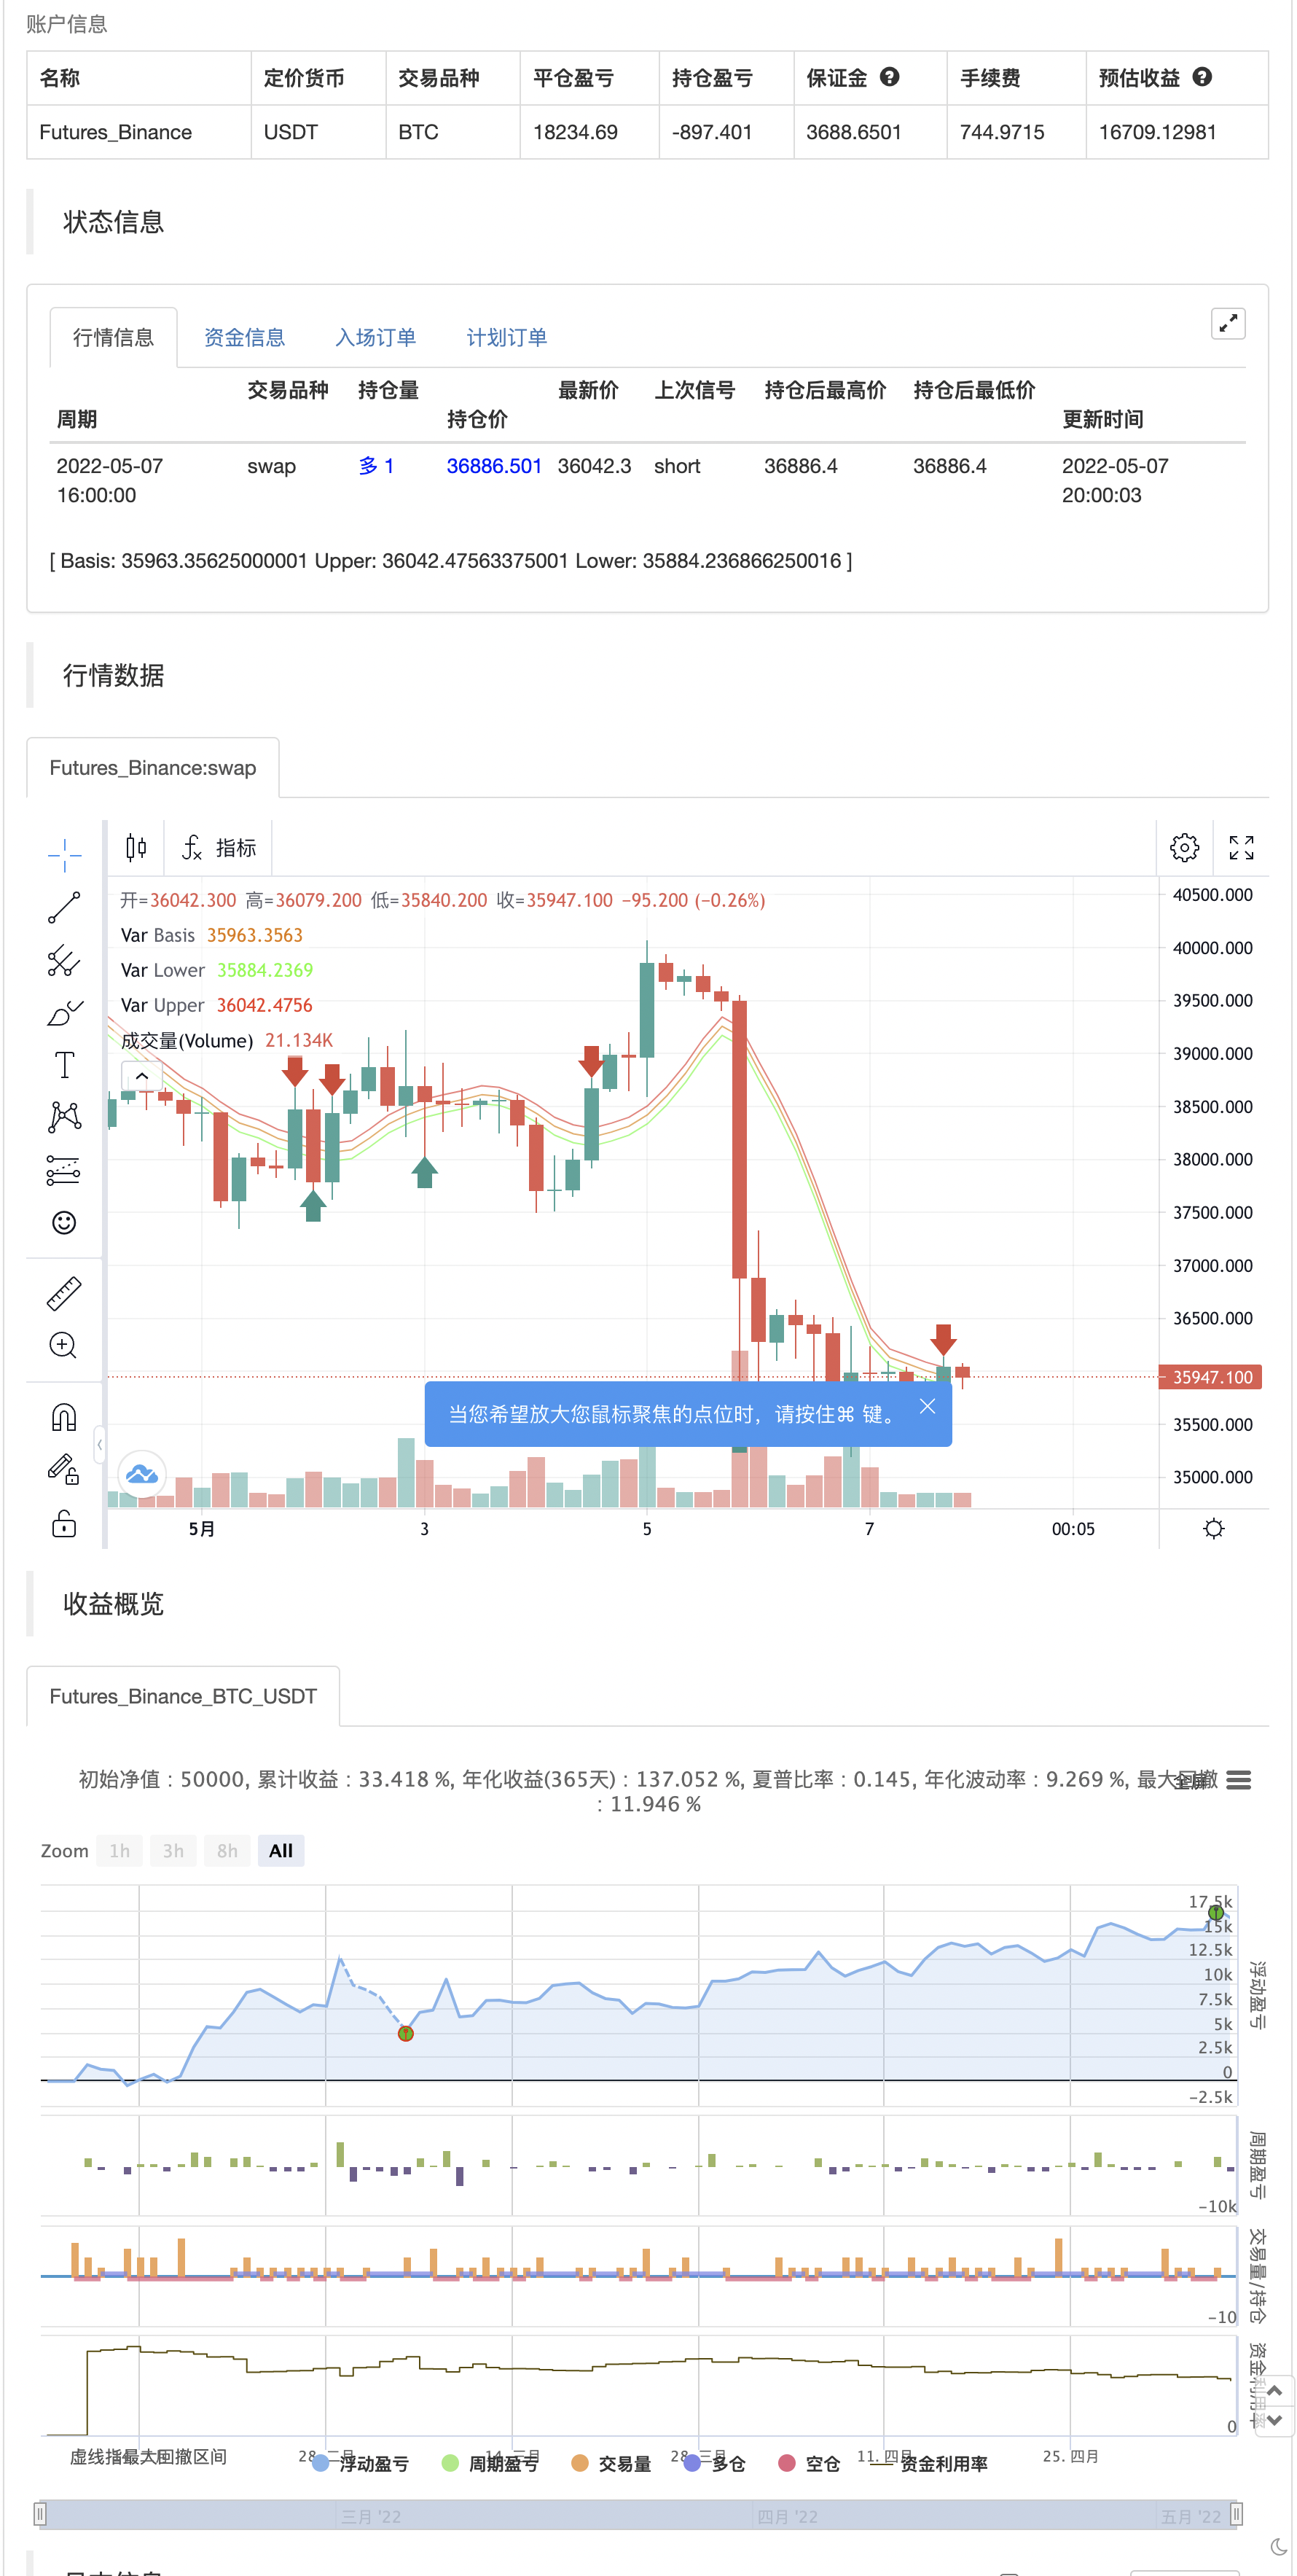
/*backtest
start: 2022-02-08 00:00:00
end: 2022-05-08 00:00:00
period: 4h
basePeriod: 15m
exchanges: [{"eid":"Futures_Binance","currency":"BTC_USDT"}]
*/

// This source code is subject to the terms of the Mozilla Public License 2.0 at https://mozilla.org/MPL/2.0/
// © Saleh_Toodarvari

//@version=5
indicator(title="ENVELOPE - RSI - Buy Sell Signals", shorttitle="ENVELOPE - RSI", overlay=true)
//_________________Envelope_________________
len = input.int(8, title="Envelope Length", minval=1, group="Envelope Settings")
percent = input(0.22,title="Envelope Percent", group="Envelope Settings")
src = input(hl2, title="Envelope Source", group="Envelope Settings")
exponential = input(false)
basis = exponential ? ta.ema(src, len) : ta.sma(src, len)
k = percent/100.0
upper = basis * (1 + k)
lower = basis * (1 - k)
plot(basis, "Basis", color=#ED7300)
u = plot(upper, "Upper", color=#FF2424)
l = plot(lower, "Lower", color=#24FF24)
//fill(u, l, color=color.rgb(33, 150, 243, 95), title="Background")
cross_buy=ta.crossover(close,lower)
cross_sell=ta.crossunder(close,upper)
// _________________RSI_________________
rsiLengthInput = input.int(8, minval=1, title="RSI Length", group="RSI Settings")
rsiSourceInput = input.source(hl2, "RSI Source", group="RSI Settings")
up = ta.rma(math.max(ta.change(rsiSourceInput), 0), rsiLengthInput)
down = ta.rma(-math.min(ta.change(rsiSourceInput), 0), rsiLengthInput)
rsi = down == 0 ? 100 : up == 0 ? 0 : 100 - (100 / (1 + up / down))
Overbought_RSI = input(title="RSI OverBought Limit(Recommended: 70-85)", defval=80, group="RSI Settings")
Oversold_RSI = input(title="RSI OverSold Limit(Recommended: 20-30)", defval=25, group="RSI Settings")
condition_buy= rsi<Oversold_RSI and (ta.cross(low,lower) or ta.cross(close,lower) or ta.cross(high,lower) or ta.cross(open,lower))
condition_sell= rsi>Overbought_RSI and (ta.cross(low,upper) or ta.cross(close,upper) or ta.cross(high,upper) or ta.cross(open,upper))
if cross_sell
    strategy.entry("Enter Long", strategy.long)
else if cross_buy
    strategy.entry("Enter Short", strategy.short)

// plotshape(cross_sell ? condition_sell:na, title="Sell Label", text="Sell", location=location.abovebar, style=shape.labeldown, size=size.tiny, color=color.red, textcolor=color.white)
// sell_sig=plot(cross_sell ? high:na,color=color.new(#000000,100))
// plotshape(cross_buy ? condition_buy:na, title="Buy Label", text="Buy", location=location.belowbar, style=shape.labelup, size=size.tiny, color=color.green, textcolor=color.white)
// buy_sig=plot(cross_buy ? ohlc4:na,color=color.new(#000000,100))
// tpColor = if(cross_sell[1] or cross_sell[2] or cross_buy[1] or cross_buy[2])
//     color.new(#1DBC60, 30)
// else
//     color.new(#000000,100)
// slColor = if(cross_sell[1] or cross_sell[2] or cross_buy[1] or cross_buy[2])
//     color.new(#F74A58, 30)
// else
//     color.new(#000000,100)
// //_________________TP&SL_________________
// TP_Percent = input.float(0.15, "TP %")
// SL_Percent = input.float(0.15, "SL %")
// tp= if condition_sell
//     ohlc4-ohlc4*(TP_Percent/100)
// else if condition_buy
//     ohlc4+ohlc4*(TP_Percent/100)
// sl= if condition_sell
//     ohlc4+ohlc4*(SL_Percent/100)
// else if condition_buy
//     ohlc4-ohlc4*(SL_Percent/100)
// tp_sig=plot(tp,color=color.new(#000000,100),title="tp")
// sl_sig=plot(sl,color=color.new(#000000,100),title="tp")
// lower_plot=plot(lower,color=color.new(#000000,100))
// fill(sell_sig,tp_sig, color=tpColor)
// fill(buy_sig,tp_sig, color=tpColor)
// fill(buy_sig,sl_sig, color=slColor)
// fill(sell_sig,sl_sig, color=slColor)
- Le MACD RSI Ichimoku est une tendance de dynamique à la suite d'une longue stratégie.
- RSI Stratégie de changement de direction
- Stratégie de négociation des bandes de Bollinger améliorées RSI
- Stratégie de pivot et de dynamique
- Stratégie de négociation complète des moyennes mobiles et du RSI
- Stratégie de redressement du mardi (filtre du week-end)
- La stratégie de croisement renforcée de l'EMA avec le RSI/MACD/ATR
- Stratégie de négociation à long terme combinée MACD et RSI
- RSI2 Stratégie Réversion intradienne Taux de victoire Test de retour
- Tendance multi-indicateurs à la suite de la stratégie
- Stratégie de négociation AlphaTradingBot
- Midas Mk. II - Le dernier Crypto Swing
- Le TMA-Legacy
- La stratégie de TV haut et bas
- Meilleure stratégie de tradingView
- Résultats de l'évaluation de la volatilité
- Chande Kroll Arrêtez
- CCI + EMA avec stratégie croisée RSI
- Stratégie de capture de tendance des bandes EMA + leledc + bandes Bollinger
- RSI MTF Ob+Os
- Stratégie MACD Willy
- La tendance de Heikin-Ashi
- HA Préjugés de marché
- L'oscillateur lisse du nuage Ichimoku
- Williams %R - Lissé
- QQE MOD + SSL hybride + Waddah Attar explosion
- Acheter ou vendre Strat
- Triple Supertrend avec EMA et ADX
- Tom DeMark Carte de chaleur séquentielle
- jma + dwma par grains multicolores
- Le MACD magique