
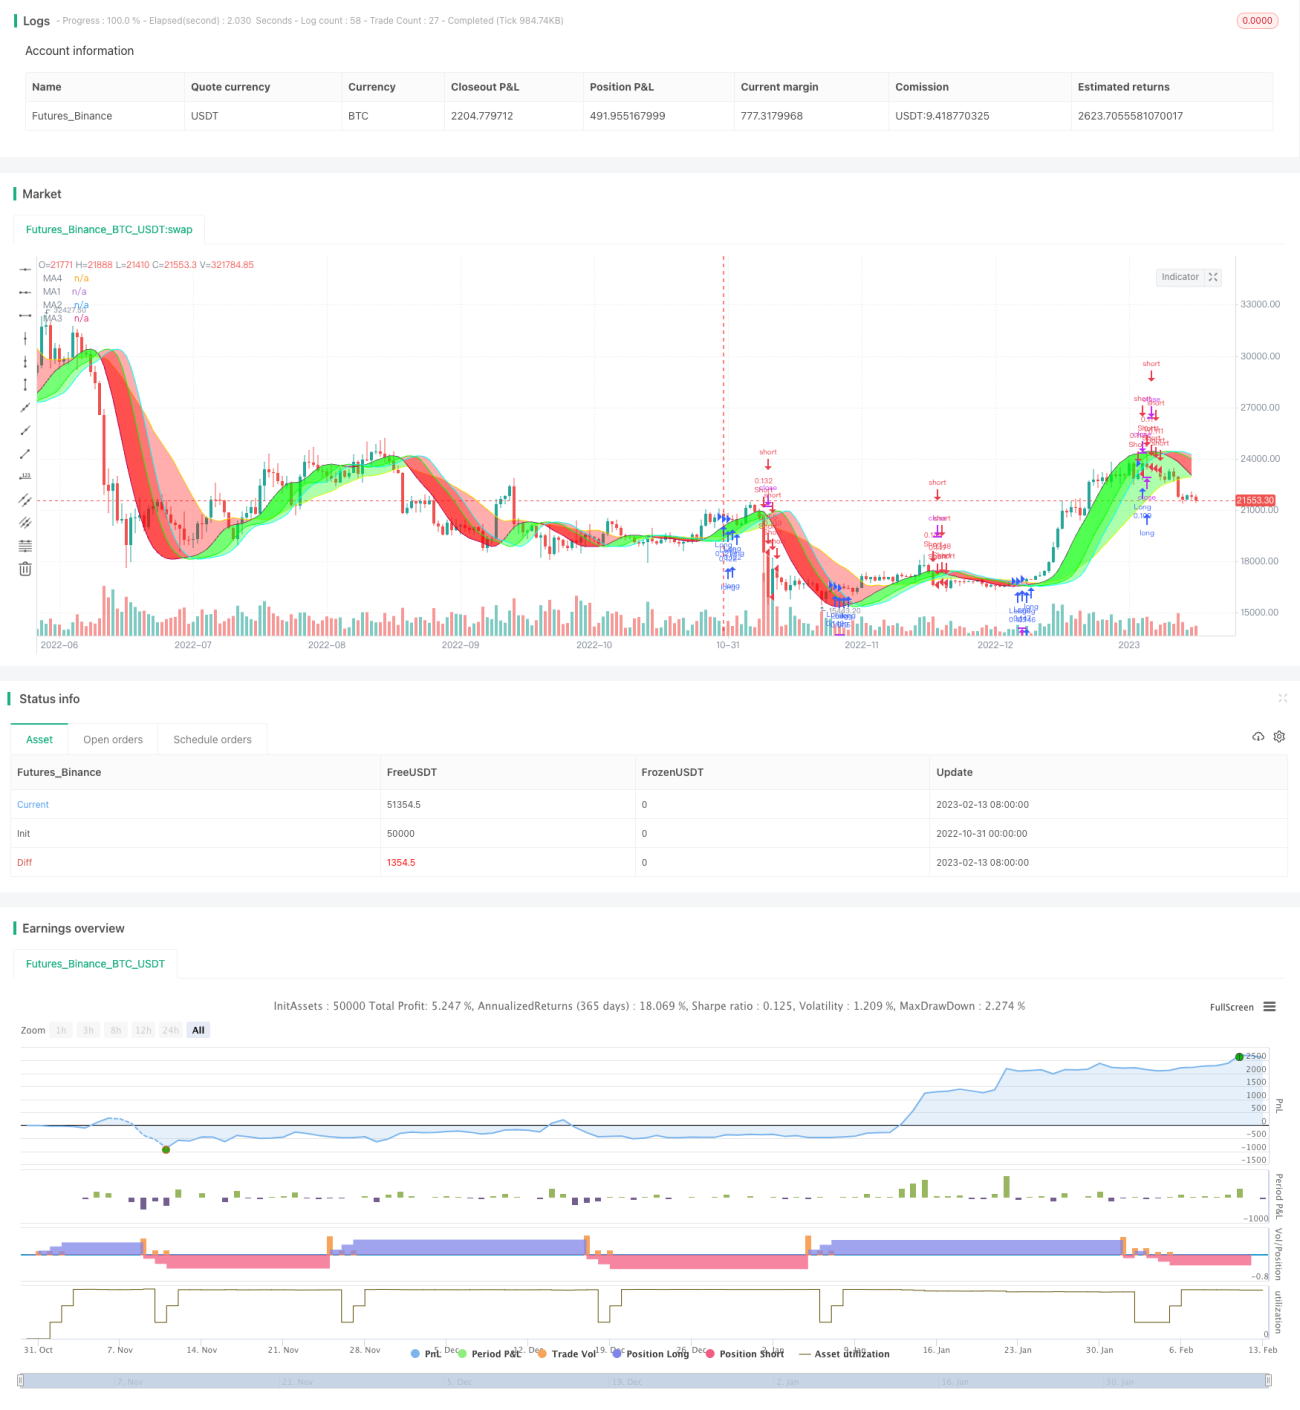
La stratégie de tendance des dragons permet de juger les tendances et de générer des signaux de négociation en ajustant le type, la longueur et le décalage des moyennes mobiles, en traçant des bandes de tendance de différentes couleurs. La stratégie permet de trouver la meilleure combinaison de paramètres pour différentes périodes de temps, en équilibrant l’exactitude des jugements de tendance et le risque de négociation.
La stratégie utilise deux moyennes mobiles pour tracer les bandes de tendance, numérotées MA1 et MA4. MA1 est une moyenne mobile rapide, MA4 est une moyenne mobile lente. Dans le même temps, MA1 définit 3 déviations (Offset1, Offset2, Offset3) qui forment MA2 et MA3.
Les utilisateurs peuvent choisir parmi 5 niveaux de risque, différents niveaux de risque, traversant différentes moyennes mobiles pour former un signal de négociation, le risque de haut en bas est: MA1 Offset1, MA2, MA3, MA4, toutes les bandes de tendance sont de la même couleur. La couleur de la bande de tendance indique la direction de la tendance actuelle, le vert est la tendance à la hausse, le rouge est la tendance à la baisse.
En outre, la stratégie permet l’utilisation de stop-loss et le choix de positions longues, courtes ou bilatérales.
Le risque peut être contrôlé et réduit en réduisant progressivement le niveau de risque, en augmentant les tests de combinaison de paramètres et en optimisant les paramètres pour les différentes variétés.
La stratégie de tendance de Fibonacci a conçu un système de trading de tendance visualisé par une combinaison habile de moyennes mobiles. Les paramètres de la stratégie sont très réglables et peuvent être minutieusement optimisés pour différentes variétés et conditions de marché, trouvant le meilleur équilibre entre la stabilité et la sensibilité.
/*backtest
start: 2022-10-31 00:00:00
end: 2023-02-14 00:00:00
period: 1d
basePeriod: 1h
exchanges: [{"eid":"Futures_Binance","currency":"BTC_USDT"}]
*/
// This source code is subject to the terms of the Mozilla Public License 2.0 at https://mozilla.org/MPL/2.0/
// © MarkoP010 2023
//@version=5
//The basic idea of the strategy is to select the best set of MAs, types, lenghts and offsets, which draws red trend bands for downtrend (and green for uptrend).
//Strategy executes by selected risk level either when there is MA crossover with price (MA1 Offset1 on Highest risk level, MA2 on Low risk level) or three bands with the same color on at the same time (on Lowest risk level).
//Strategy plots user selectable Moving Average lines and a colored trend band between the MA lines. The trend bands can be turned off individually if required.
//The Offset option shifts the selected MA with the set number of steps to the right. That is where the Magic happens and the Dragon roars!
//Strategy version 1.0
strategy("Flying Dragon Trend Strategy", shorttitle="FD Trend Strategy", overlay=true, pyramiding=3, initial_capital=100000, default_qty_type=strategy.percent_of_equity, default_qty_value=5, commission_type=strategy.commission.cash_per_order, commission_value=10, calc_on_order_fills=false, process_orders_on_close=true)
strDirection = input.string(defval="Both", title="Strategy Direction", options=["Both", "Long", "Short"], group="Strategy") //Strategy direction selector by DashTrader
strSelection = strDirection == "Long" ? strategy.direction.long : strDirection == "Short" ? strategy.direction.short : strategy.direction.all //Strategy direction selector by DashTrader
strategy.risk.allow_entry_in(strSelection)
riskLevel = input.string(defval="Medium", title="Risk Level", options=["Highest", "High", "Medium", "Low", "Lowest"], tooltip="Strategy execution criteria. When Highest then MA1 Offset1 crossover with price, when Low then MA2 Offset crossover, when Lowest then all the Bands are the same color.", group="Strategy")
useStop = input(defval=false, title="Use Stop Loss", inline="SL", group="Strategy")
stopPrct = input.int(defval=10, title=" %", minval=0, maxval=100, step=1, inline="SL", group="Strategy") / 100
//Moving Averages function
MA(source, length, type) =>
type == "EMA" ? ta.ema(source, length) :
type == "HMA" ? ta.hma(source, length) :
type == "RMA" ? ta.rma(source, length) :
type == "SMA" ? ta.sma(source, length) :
type == "SWMA" ? ta.swma(source) :
type == "VWMA" ? ta.vwma(source, length) :
type == "WMA" ? ta.wma(source, length) :
na
//Inputs
ma1Type = input.string(defval="HMA", title="", inline="MA1", options=["EMA", "HMA", "RMA", "SMA","SWMA", "VWMA", "WMA"], group="Leading Moving Average")
ma1Length = input.int(defval=35, title="",minval=1, inline="MA1", group="Leading Moving Average")
ma1Source = input(defval=close, title="", tooltip="For short timeframes, minutes to hours, instead of Default values try Lowest risk level and HMA75 with Offsets 0,1,4 and SMA12 with Offset 6.", inline="MA1", group="Leading Moving Average")
ma1Color = input(defval=color.purple, title="", inline="MA-1", group="Leading Moving Average")
//useMa1Offset = input(defval=false, title="Use offset to MA-1", inline="MA1", group="Leading Moving Average")
ma1Offset = input.int(defval=0, title="Offset1 Steps", minval=0, maxval=10, step=1, tooltip="The Magic happens here! The offset to move the line to the right.", inline="MA-1", group="Leading Moving Average")
ma1 = MA(ma1Source, ma1Length, ma1Type)[ma1Offset]
ma2Color = input(defval=color.lime, title="", inline="MA-2", group="Leading Moving Average")
//useMa2Offset = input(defval=true, title="Use offset to MA2", inline="MA-2", group="Leading Moving Average")
ma2Offset = input.int(defval=4, title="Offset2 Steps", minval=0, maxval=10, step=1, tooltip="The Magic happens here! The offset to move the line to the right.", inline="MA-2", group="Leading Moving Average")
ma2 = ma1[ma2Offset]
ma3Color = input(defval=color.aqua, title="", inline="MA-3", group="Leading Moving Average")
//useMa3Offset = input(defval=false, title="Use offset to MA3", inline="MA-3", group="Leading Moving Average")
ma3Offset = input.int(defval=6, title="Offset3 Steps", minval=0, maxval=10, step=1, tooltip="The Magic happens here! The offset to move the line to the right.", inline="MA-3", group="Leading Moving Average")
ma3 = ma1[ma3Offset]
ma4Type = input.string(defval="SMA", title="", inline="MA4", options=["EMA", "HMA", "RMA", "SMA","SWMA", "VWMA", "WMA"], group="Lagging Moving Average")
ma4Length = input.int(defval=22, title="",minval=1, inline="MA4", group="Lagging Moving Average")
ma4Source = input(defval=close, title="", inline="MA4", group="Lagging Moving Average")
ma4Color = input(defval=color.yellow, title="", inline="MA-4", group="Lagging Moving Average")
//useMa4Offset = input(defval=true, title="Use offset to MA4", inline="MA-4", group="Lagging Moving Average")
ma4Offset = input.int(defval=2, title="Offset Steps", minval=0, maxval=10, step=1, tooltip="The Magic happens here! The offset to move the line to the right.", inline="MA-4", group="Lagging Moving Average")
ma4 = MA(ma4Source, ma4Length, ma4Type)[ma4Offset]
bandTransp = input.int(defval=60, title="Band Transparency", minval=20, maxval=80, step=10, group="Banding")
useBand1 = input(defval=true, title="Band 1", inline="Band", group="Banding")
band1Transp = useBand1 ? bandTransp : 100
band1clr = ma1 > ma2 ? color.new(#00ff00, transp=band1Transp) : color.new(#ff0000, transp=band1Transp)
useBand2 = input(defval=true, title="Band 2", inline="Band", group="Banding")
band2Transp = useBand2 ? bandTransp : 100
band2clr = ma1 > ma3 ? color.new(#00ff00, transp=band2Transp) : color.new(#ff0000, transp=band2Transp)
useBand3 = input(defval=true, title="Band 3", tooltip="Up trend green, down trend red. Colors get reversed if MA1 lenght is greater than MA2 lenght, or they are different type and MA2 quicker. In that case, just reverse your selections for MA1 and MA2, or let it be as is.", inline="Band", group="Banding")
band3Transp = useBand3 ? bandTransp : 100
band3clr = ma1 > ma4 ? color.new(#00ff00, transp=band3Transp) : color.new(#ff0000, transp=band3Transp)
//Graphs
piirto1 = plot(ma1, color = ma1Color, title="MA1")
piirto2 = plot(ma2, color = ma2Color, title="MA2")
piirto3 = plot(ma3, color = ma3Color, title="MA3")
piirto4 = plot(ma4, color = ma4Color, title="MA4")
fill(piirto1, piirto2, color=band1clr)
fill(piirto1, piirto3, color=band2clr)
fill(piirto1, piirto4, color=band3clr)
//Strategy entry and stop conditions
longCondition = riskLevel == "Highest" ? ma1Source > ma1 : riskLevel == "High" ? ma1Source > ma2 : riskLevel == "Medium" ? ma1Source > ma3 : riskLevel == "Low" ? ma1Source > ma4 : riskLevel == "Lowest" ? ma1 > ma2 and ma1 > ma3 and ma1 > ma4 : na
shortCondition = riskLevel == "Highest" ? ma1Source < ma1 : riskLevel == "High" ? ma1Source < ma2 : riskLevel == "Medium" ? ma1Source < ma3 : riskLevel == "Low" ? ma1Source < ma4 : riskLevel == "Lowest" ? ma1 < ma2 and ma1 < ma3 and ma1 < ma4 : na
stopLprice = useStop == true ? strategy.position_avg_price * (1-stopPrct) : na
stopSprice = useStop == true ? strategy.position_avg_price * (1+stopPrct) : na
if (longCondition)
strategy.entry("Long",strategy.long)
strategy.exit("Long Stop", "Long", stop=stopLprice)
if (shortCondition)
strategy.entry("Short",strategy.short)
strategy.exit("Short Stop", "Short", stop=stopSprice)
//End