
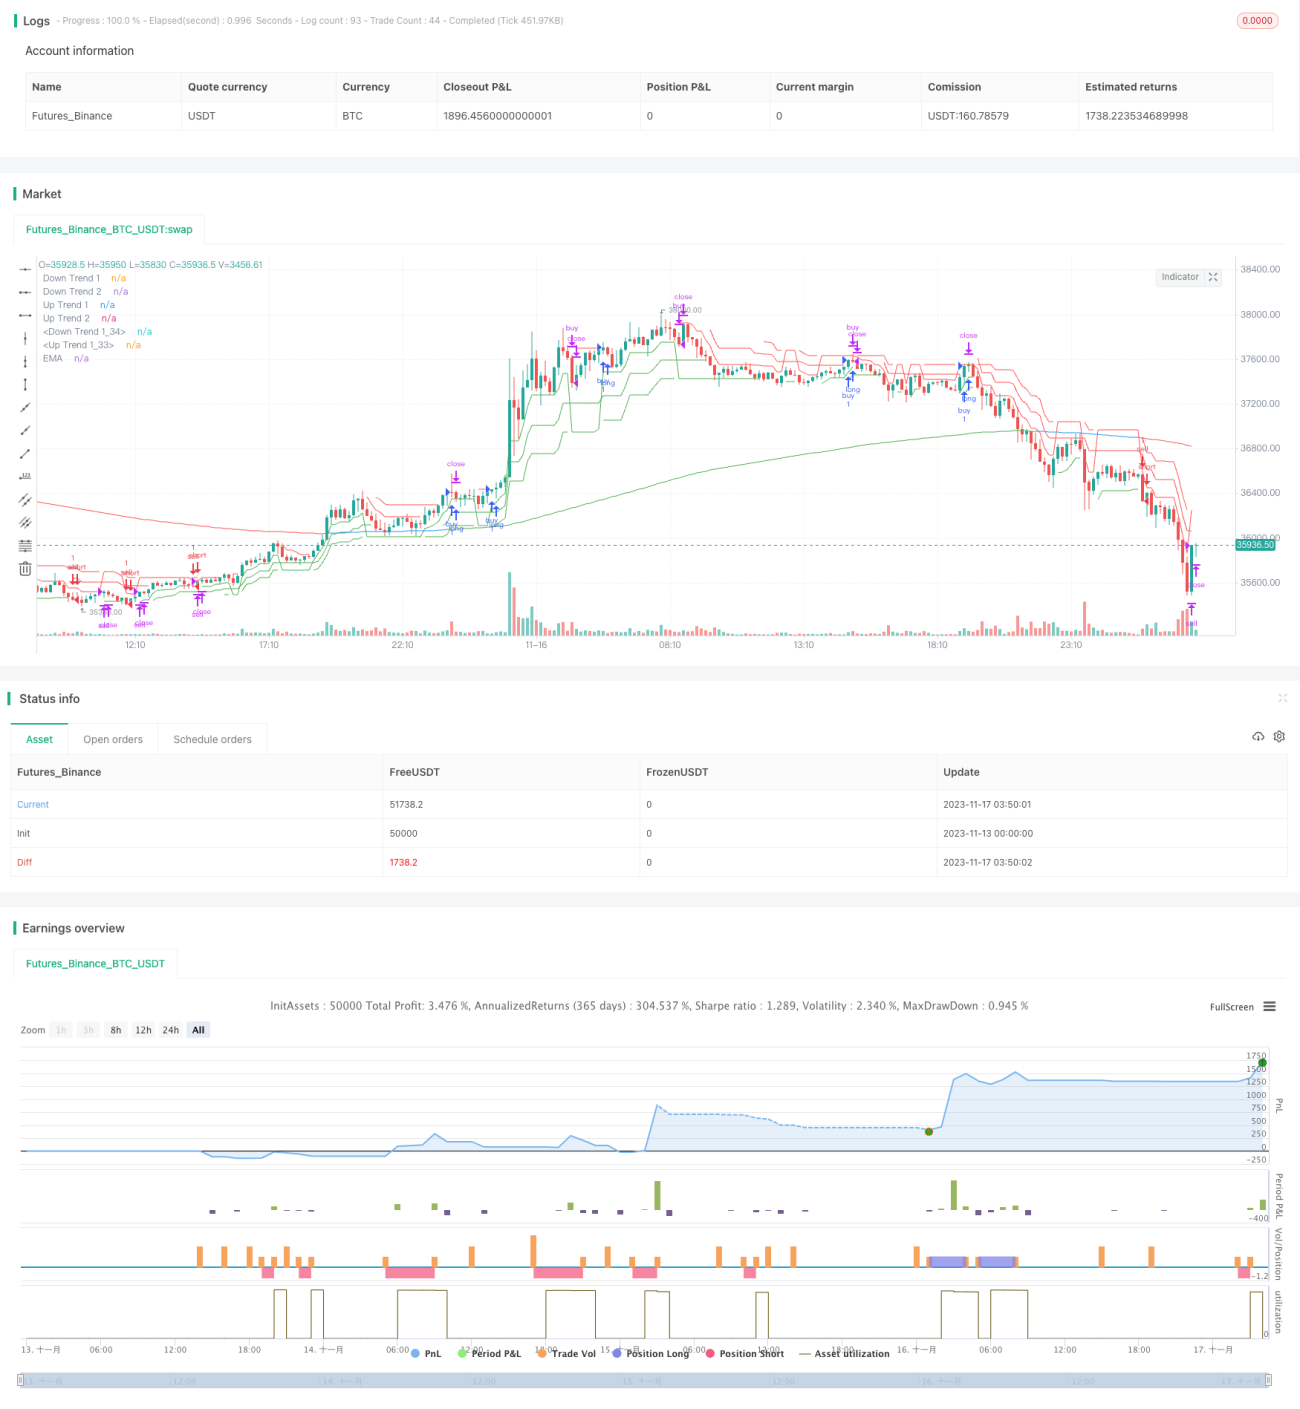
Cette stratégie permet de réaliser des opérations de rupture de suivi à haut taux de victoire en construisant un canal bi-triangulaire, combiné à un indicateur de super-tendance pour déterminer la direction de la rupture de prix. Cette stratégie est également combinée à une évaluation de la tendance générale du marché par l’EMA, afin d’éviter des transactions inefficaces en cas de choc.
Construction d’un super indicateur de tendance à trois paramètres différents pour déterminer la direction de la tendance à court, moyen et long terme des prix.
Les signaux de sortie et d’entrée sont utilisés pour déterminer si le prix a franchi le canal ascendant ou le canal descendant.
En combinant 233 cycles d’EMA pour juger de la direction de la tendance générale, le prix doit faire plus pour franchir le canal ascendant dans les marchés à plusieurs têtes d’EMA et le canal descendant dans les marchés à tête vide.
Déterminez les signaux d’arrêt et de perte en combinant trois indicateurs de super-tendance. Lorsque plus de deux indicateurs changent de couleur, placez un arrêt ou une perte.
Le canal bi-triangulaire, combiné à une évaluation de plusieurs périodes de temps, permet de capturer avec précision les ruptures de tendance.
Les conditions de sélection à plusieurs niveaux permettent d’éviter les transactions invalides et d’améliorer les chances de succès.
Tracking dynamique des pertes de freinage pour réduire le risque de retrait.
Les paramètres sont simples et faciles à maîtriser.
Il est possible que des positions soient fréquemment ouvertes puis bloquées dans des marchés à forte volatilité. Les paramètres ATR peuvent être ajustés de manière appropriée pour réduire la fréquence d’ouverture des positions.
Un cycle EMA trop court ne permet pas de juger de la tendance générale, un cycle trop long ne permet pas de suivre la tendance générale. Il est recommandé de tester pour déterminer les paramètres EMA optimaux.
Les niveaux de stop loss ne peuvent pas suivre dynamiquement les variations de la volatilité du marché et nécessitent une intervention manuelle. Un ajustement de la distance de stop loss peut être envisagé ultérieurement en combinaison avec un ajustement dynamique de l’ATR.
La stratégie de double triangle de Moonlight Tracker permet de capturer avec précision les fortes ruptures grâce à la combinaison d’un indicateur de tendance super et d’un canal double triangle. Le mécanisme de filtrage à plusieurs niveaux permet de filtrer les signaux inefficaces et offre une plus grande efficacité. La configuration simple des paramètres facilite également son utilisation.
/*backtest
start: 2023-11-13 00:00:00
end: 2023-11-17 04:00:00
period: 10m
basePeriod: 1m
exchanges: [{"eid":"Futures_Binance","currency":"BTC_USDT"}]
*/
// @version=5
// author=theasgard and moonshot-indicator (ms)
// year 2021
//
// This is a well knowen strategy by using 3 different Supertrends and a trend-defining EMA,
// feel free to play around with the settings, a backtest on 8h ETHUSDT pair brought some good results using
// the 233EMA and investing 75% of a 10k start capital
//
// the idea is to have at least 2 supertrnds going green above the trend-EMA to go long and exit by turning
// 2 supertrends red (idea: 1 supertrend in red could initialize a take profit)
// shorts work vice versa
// The EMA shows in green for uptrends and in red for downtrends, if it is blue no Signal will be taken because
// the 3 supertrends are not all above or below the trendline(EMA)
strategy("ms hypertrender", overlay=true)
// set up 3 supertrendlines and colour the direction up/down
atrPeriod1 = input(10, "ATR Length 1")
factor1 = input.float(1.0, "ATR Factor 1", step = 0.01)
[supertrend1, direction1] = ta.supertrend(factor1, atrPeriod1)
upTrend1 = plot(direction1 < 0 ? supertrend1 : na, "Up Trend 1", color = color.green, style=plot.style_linebr)
downTrend1 = plot(direction1 < 0? na : supertrend1, "Down Trend 1", color = color.red, style=plot.style_linebr)
atrPeriod2 = input(11, "ATR Length 2")
factor2 = input.float(2.0, "ATR Factor 2", step = 0.01)
[supertrend2, direction2] = ta.supertrend(factor2, atrPeriod2)
upTrend2 = plot(direction2 < 0 ? supertrend2 : na, "Up Trend 2", color = color.green, style=plot.style_linebr)
downTrend2 = plot(direction2 < 0? na : supertrend2, "Down Trend 2", color = color.red, style=plot.style_linebr)
atrPeriod3 = input(12, "ATR Length 3")
factor3 = input.float(3.0, "ATR Factor 3", step = 0.01)
[supertrend3, direction3] = ta.supertrend(factor3, atrPeriod3)
upTrend3 = plot(direction3 < 0 ? supertrend3 : na, "Up Trend 1", color = color.green, style=plot.style_linebr)
downTrend3 = plot(direction3 < 0? na : supertrend3, "Down Trend 1", color = color.red, style=plot.style_linebr)
//set up the trend dividing EMA and color uptrend nutreal downtrend
len = input.int(233, minval=1, title="Trend-EMA Length")
src = input(close, title="Source")
offset = input.int(title="Offset", defval=0, minval=-500, maxval=500)
//general Bull or Bear Trend? Visualized by ema
ematrend = ta.ema(src, len)
generaluptrend = supertrend1 > ematrend and supertrend2 > ematrend and supertrend3 > ematrend
generaldowntrend = supertrend1 < ematrend and supertrend2 < ematrend and supertrend3 < ematrend
emacolor = if generaluptrend
color.green
else if generaldowntrend
color.red
else
color.blue
plot(ematrend, title="EMA", color=emacolor, offset=offset)
// Bullish? min 2 supertrends green
bullish = (direction1 < 0 and direction2 < 0) or (direction1 < 0 and direction3 < 0) or (direction2 < 0 and direction3 < 0) and generaluptrend
extremebullish = direction1 < 0 and direction2 < 0 and direction3 < 0 and generaluptrend //all 3 green
// Bearish? min 2 supertrends red
bearish = (direction1 > 0 and direction2 > 0) or (direction1 > 0 and direction3 > 0) or (direction2 > 0 and direction3 > 0) and generaldowntrend
extremebearish = direction1 > 0 and direction2 > 0 and direction3 > 0 and generaldowntrend //all 3 red
// Open Long
//plotchar(((bullish and not bullish[1]) or (extremebullish and not extremebullish[1])) and (emacolor==color.green)? close : na, title = 'Start Long', char='▲', color = #80eb34, location = location.belowbar, size = size.small)
// TP 10% Long
TP10long = ((generaluptrend and bullish[1]) or (generaluptrend and extremebullish[1])) and (direction1 > 0 or direction2 > 0 or direction3 > 0)
//plotchar(TP10long and not TP10long[1]? close : na, title = 'TP on Long', char='┼', color = #ffd000, location = location.abovebar, size = size.tiny)
// Exit Long
//plotchar(extremebearish and not extremebearish[1] or bearish and not bearish[1]? close : na, title = 'Close all Longs', char='Ꭓ', color = #ff0037, location = location.abovebar, size = size.tiny)
// Open Short
//plotchar(((bearish and not bearish[1]) or (extremebearish and not extremebearish[1])) and (emacolor==color.red)? close : na, title = 'Start Short', char='▼', color = #0547e3, location = location.abovebar, size = size.small)
// TP 10% Short
TP10short = ((generaldowntrend and bearish[1]) or (generaldowntrend and extremebearish[1])) and (direction1 < 0 or direction2 < 0 or direction3 < 0)
//plotchar(TP10short and not TP10short[1]? close : na, title = 'TP on Short', char='┼', color = #ffd000, location = location.belowbar, size = size.tiny)
// Exit Short
//plotchar(extremebullish and not extremebullish[1] or bullish and not bullish[1]? close : na, title = 'Close all Shorts', char='Ꭓ', color = #ff0037, location = location.belowbar, size = size.tiny)
// Set stop loss level with input options (optional)
longLossPerc = input.float(title="Long Stop Loss (%)",
minval=0.0, step=0.1, defval=1) * 0.01
shortLossPerc = input.float(title="Short Stop Loss (%)",
minval=0.0, step=0.1, defval=1) * 0.01
// Determine stop loss price
longStopPrice = strategy.position_avg_price * (1 - longLossPerc)
shortStopPrice = strategy.position_avg_price * (1 + shortLossPerc)
openlong = (((bullish and not bullish[1]) or (extremebullish and not extremebullish[1])) and (emacolor==color.green))
openshort = (((bearish and not bearish[1]) or (extremebearish and not extremebearish[1])) and (emacolor==color.red))
exitlong = (extremebearish and not extremebearish[1] or bearish and not bearish[1]) or TP10long
exitshort = (extremebullish and not extremebullish[1] or bullish and not bullish[1]) or TP10short
strategy.entry("buy", strategy.long, when=openlong)
strategy.entry("sell", strategy.short, when=openshort)
strategy.close("buy", when=exitlong)
strategy.close("sell", when=exitshort)
// Submit exit orders based on calculated stop loss price
if (strategy.position_size > 0)
strategy.exit(id="Long Stop", stop=longStopPrice)
if (strategy.position_size < 0)
strategy.exit(id="Short Stop", stop=shortStopPrice)