Stratégie de rupture de choc de super tendance sur plusieurs périodes
Aperçu
La stratégie combine les indicateurs de tendance supérieure et les indicateurs de la ceinture de Brin sur plusieurs périodes de temps, identifie la direction de la tendance et les points de résistance de soutien clés, effectue des entrées lors de la rupture de la secousse et repose sur des positions de sortie croisée. La stratégie s’applique principalement aux variétés de futures sur matières premières très volatiles, telles que l’or, l’argent, le pétrole brut, etc.
Principe de stratégie
Fonction de super-tendance de cadre temporel personnalisé basée sur Pine Scriptpine_supertrend(), super tendances combinant différentes périodes (par exemple, 1 minute et 5 minutes) pour déterminer la direction de la tendance à grande période.
En même temps, le calcul de la descente de la ceinture de Bolling est utilisé pour juger de la rupture du canal. Lorsque le prix dépasse la ceinture de Bolling, il est considéré comme une rupture de la courbe; lorsque le prix tombe sous la ceinture de Bolling, il est considéré comme une rupture de la baisse.
Signal stratégique:
Signaux à plusieurs têtes: prix de clôture > Brin est en train de s’enrouler et prix de clôture > Indicateur de tendance super à plusieurs périodes Signaux de tête creuse: prix de clôture < Brin est en baisse et prix de clôture < Indicateur de tendance à la hausse sur plusieurs périodes
Arrêt des pertes:
Stop multiples: le cours de clôture est inférieur à 5 minutes à l’indicateur de tendance super Stop à vide: prix de clôture > 5 minutes
Par conséquent, les stratégies captent les ruptures de résonance de l’indicateur de super-tendance avec l’indicateur de la bande de Brin et traitent les transactions dans des conditions de forte volatilité.
Analyse des avantages
- Utilisation de l’indicateur de tendance des supermarchés à plusieurs périodes pour déterminer la direction de la tendance à grande période et améliorer la qualité du signal
- Les courroies de Brin sur et en dessous de la voie ferrée servent de points de résistance de soutien essentiels, réduisant ainsi les fausses percées.
- Indicateur de super-tendance comme point d’arrêt, pour réduire les pertes et contrôler les risques
Analyse des risques
- Les indicateurs de tendance sont en retard et risquent de manquer le point de basculement.
- Une mauvaise configuration des paramètres de la bande de Bryn peut entraîner des trades trop fréquents ou trop ratés
- Les futures sur les marchandises sont sujettes à de fortes fluctuations et à des pertes importantes en cas d’événement majeur ou de marché nocturne.
Comment gérer les risques:
- Signal de confirmation combiné à plusieurs indicateurs auxiliaires pour éviter les fausses percées
- Optimiser les paramètres de la bande de Bryn pour trouver l’équilibre optimal
- Ajustez la position d’arrêt et agrandissez la distance d’arrêt
Direction d’optimisation
- Essayez d’autres indicateurs de tendance, tels que KDJ, MACD, etc. comme aide à la décision
- Augmentation de la probabilité de jugement des modèles d’apprentissage automatique
- Optimiser les paramètres pour trouver la meilleure combinaison de superparamètres
Résumer
La stratégie intègre les supertrends et les deux indicateurs de haute efficacité de la bande de Brin, permettant une manœuvre à haute probabilité grâce à l’analyse des cadres temporels et à l’analyse des ruptures de canaux. La stratégie maîtrise efficacement le risque de fonds et confirme que des rendements supérieurs peuvent être obtenus dans les variétés à forte volatilité. L’efficacité de la stratégie peut également être améliorée par une optimisation supplémentaire et une combinaison d’INDICATORS.
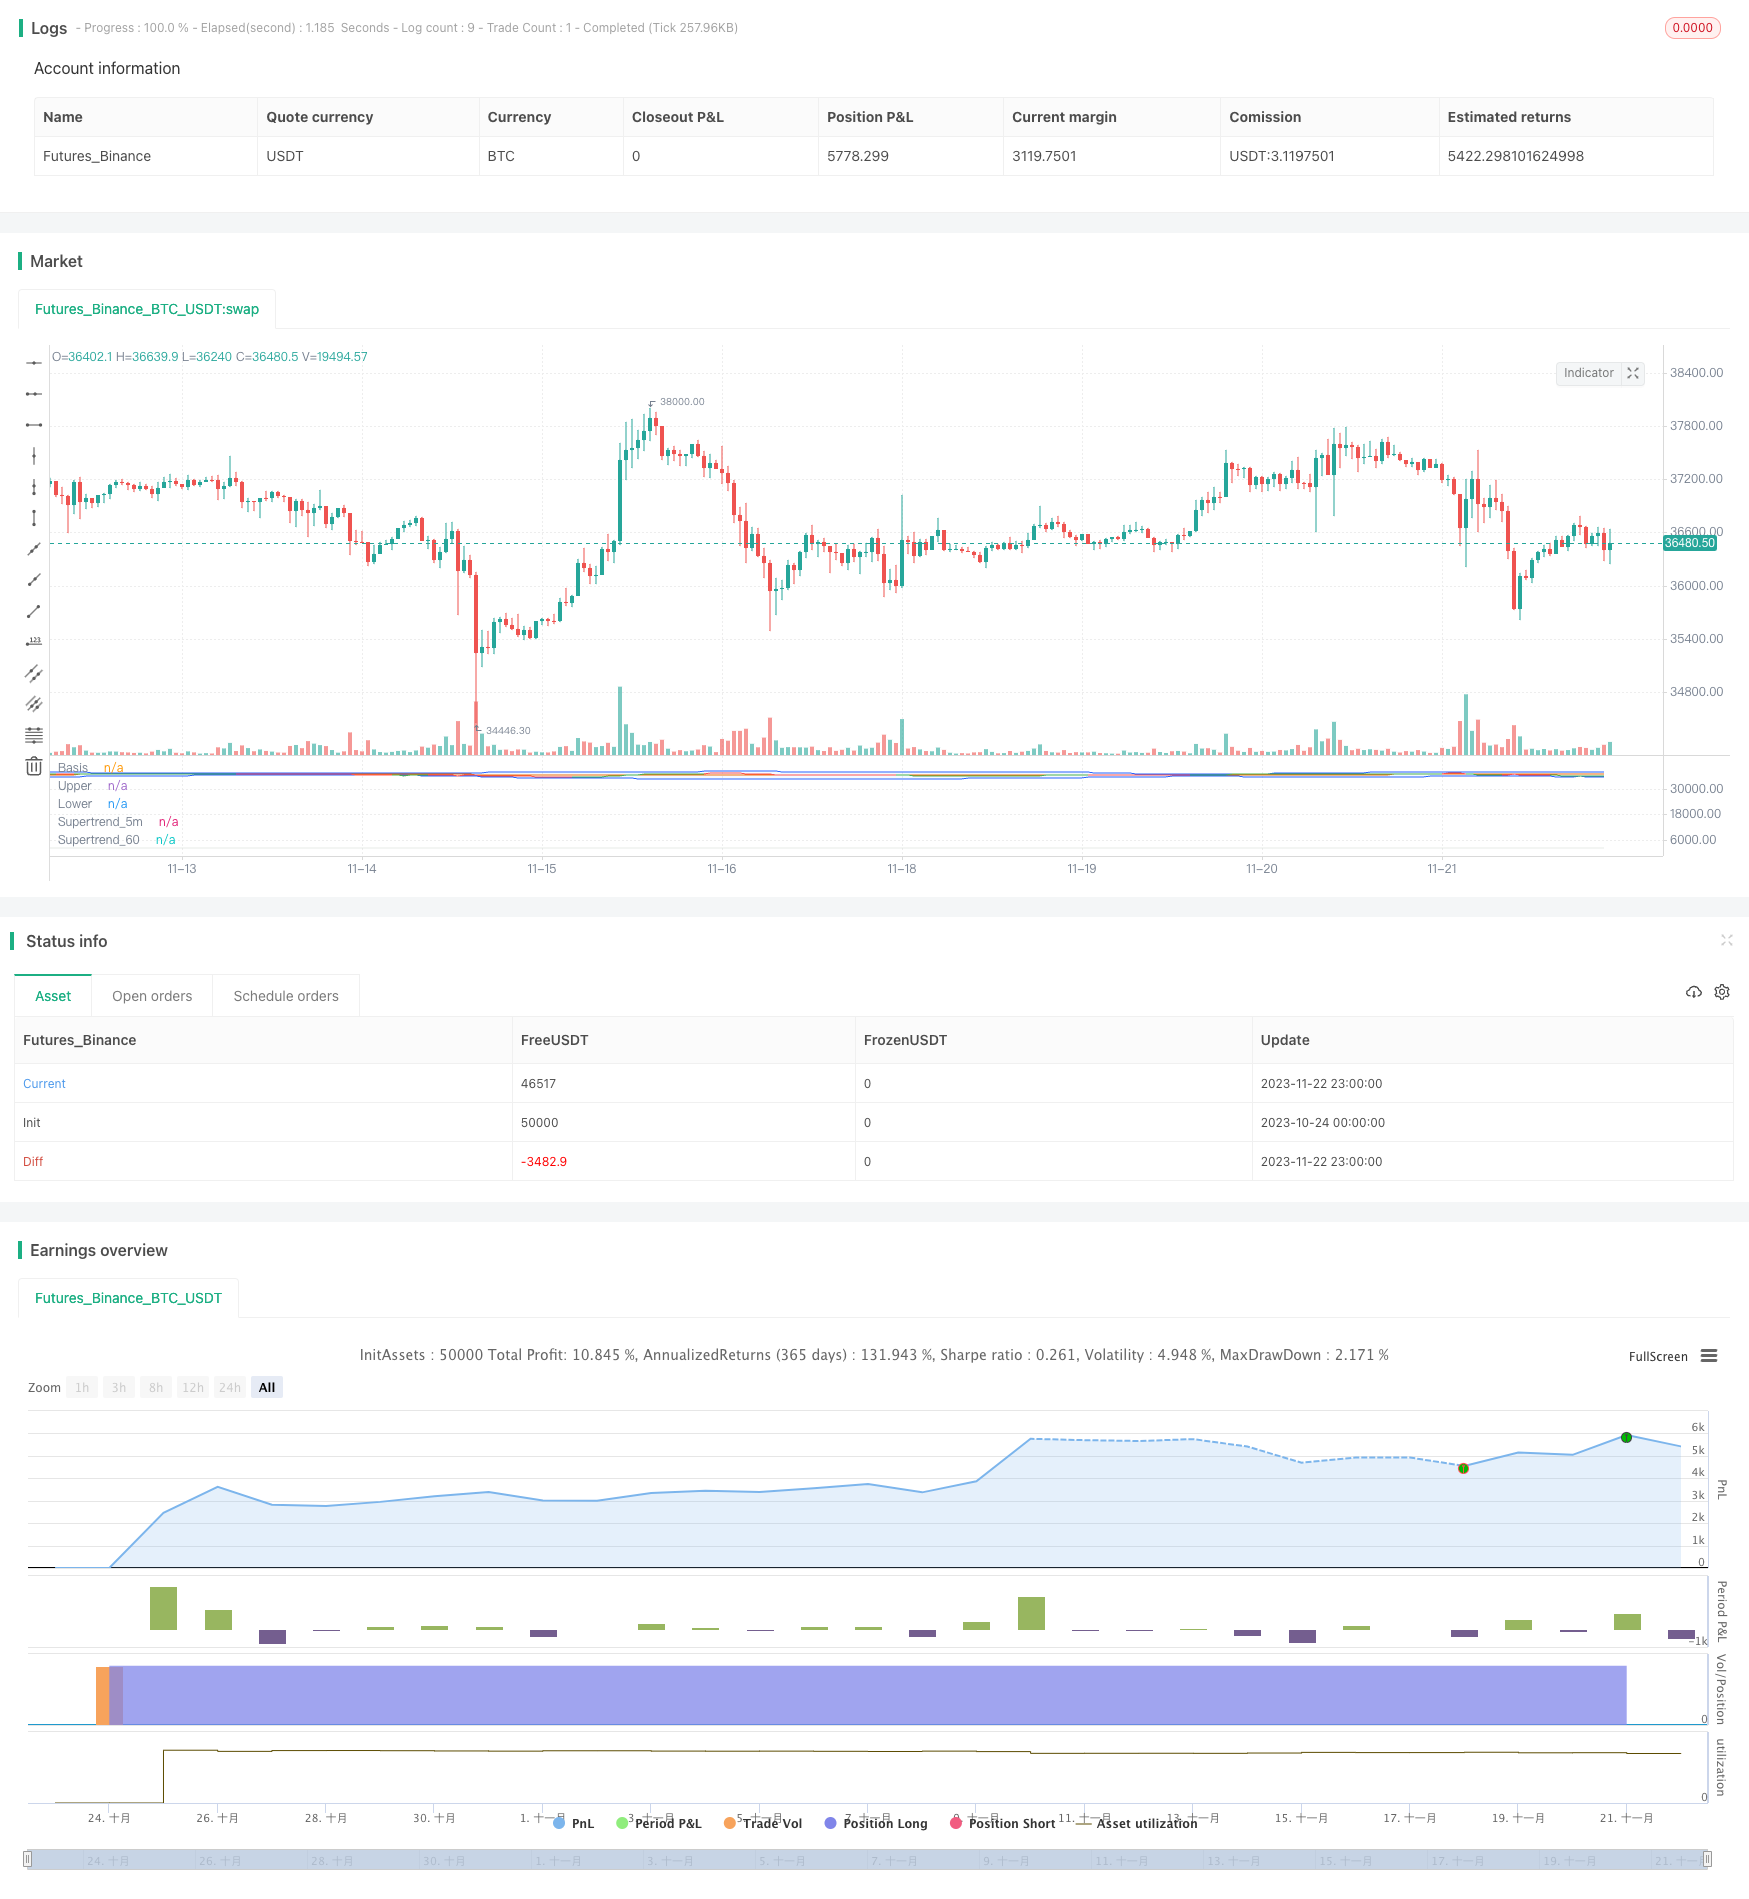
/*backtest
start: 2023-10-24 00:00:00
end: 2023-11-23 00:00:00
period: 1h
basePeriod: 15m
exchanges: [{"eid":"Futures_Binance","currency":"BTC_USDT"}]
*/

// This source code is subject to the terms of the Mozilla Public License 2.0 at https://mozilla.org/MPL/2.0/
// © ambreshc95

//@version=5
strategy("Comodity_SPL_Strategy_01", overlay=false)

// function of st
// [supertrend, direction] = ta.supertrend(3, 10)
// plot(direction < 0 ? supertrend : na, "Up direction", color = color.green, style=plot.style_linebr)
// plot(direction > 0 ? supertrend : na, "Down direction", color = color.red, style=plot.style_linebr)

// VWAP
// src_vwap = input(title = "Source", defval = hlc3, group="VWAP Settings")
// [_Vwap,stdv,_] = ta.vwap(src_vwap,false,1)
// plot(_Vwap, title="VWAP", color = color.rgb(0, 0, 0))


// The same on Pine Script®
pine_supertrend(factor, atrPeriod,len_ma) =>

    h= ta.sma(high,len_ma)
    l= ta.sma(low,len_ma)
    hlc_3 = (h+l)/2
    src = hlc_3
    atr = ta.atr(atrPeriod)
    upperBand = src + factor * atr
    lowerBand = src - factor * atr
    prevLowerBand = nz(lowerBand[1])
    prevUpperBand = nz(upperBand[1])

    lowerBand := lowerBand > prevLowerBand or close[1] < prevLowerBand ? lowerBand : prevLowerBand
    upperBand := upperBand < prevUpperBand or close[1] > prevUpperBand ? upperBand : prevUpperBand
    int direction = na
    float superTrend = na
    prevSuperTrend = superTrend[1]
    if na(atr[1])
        direction := 1
    else if prevSuperTrend == prevUpperBand
        direction := close > upperBand ? -1 : 1
    else
        direction := close < lowerBand ? 1 : -1
    superTrend := direction == -1 ? lowerBand : upperBand
    [superTrend, direction]
len_ma_given = input(75, title="MA_SMA_ST")
[Pine_Supertrend, pineDirection] = pine_supertrend(3, 10,len_ma_given)
// plot(pineDirection < 0 ? Pine_Supertrend : na, "Up direction", color = color.green, style=plot.style_linebr)
// plot(pineDirection > 0 ? Pine_Supertrend : na, "Down direction", color = color.red, style=plot.style_linebr)
//
// Define Supertrend parameters
atrLength = input(10, title="ATR Length")
factor = input(3.0, title="Factor")

// // Calculate Supertrend
[supertrend, direction] = ta.supertrend(factor, atrLength)

st_color = supertrend > close ? color.red : color.green
// // Plot Supertrend
// plot(supertrend, "Supertrend", st_color)
//

// BB Ploting
length = input.int(75, minval=1)
maType = input.string("SMA", "Basis MA Type", options = ["SMA", "EMA", "SMMA (RMA)", "WMA", "VWMA"])
src = input(close, title="Source")
mult = input.float(2.5, minval=0.001, maxval=50, title="StdDev")

ma(source, length, _type) =>
    switch _type
        "SMA" => ta.sma(source, length)
        "EMA" => ta.ema(source, length)
        "SMMA (RMA)" => ta.rma(source, length)
        "WMA" => ta.wma(source, length)
        "VWMA" => ta.vwma(source, length)

basis = ma(src, length, maType)
dev = mult * ta.stdev(src, length)
upper = basis + dev
lower = basis - dev
offset = input.int(0, "Offset", minval = -500, maxval = 500)
plot(basis, "Basis", color=#FF6D00, offset = offset)
p1 = plot(upper, "Upper", color=#2962FF, offset = offset)
p2 = plot(lower, "Lower", color=#2962FF, offset = offset)
fill(p1, p2, title = "Background", color=color.rgb(33, 150, 243, 95))


// h= ta.sma(high,60)
// l= ta.sma(low,60)
// c= sma(close,60)
// hlc_3 = (h+l)/2
// supertrend60 = request.security(syminfo.tickerid,  supertrend)

// // Define timeframes for signals
tf1 = input(title="Timeframe 1", defval="1")
tf2 = input(title="Timeframe 2",defval="5")
// tf3 = input(title="Timeframe 3",defval="30")


// // // Calculate Supertrend on multiple timeframes
supertrend_60 = request.security(syminfo.tickerid, tf1, Pine_Supertrend)
supertrend_5m = request.security(syminfo.tickerid, tf2, supertrend)
// supertrend3 = request.security(syminfo.tickerid, tf3, supertrend)

// // Plot Supertrend_60
st_color_60 = supertrend_60 > close ? color.rgb(210, 202, 202, 69) : color.rgb(203, 211, 203, 52)
plot(supertrend_60, "Supertrend_60", st_color_60)

// // Plot Supertrend_5m
st_color_5m = supertrend_5m > close ? color.red : color.green
plot(supertrend_5m, "Supertrend_5m", st_color_5m)


ma21 = ta.sma(close,21)
// rsi = ta.rsi(close,14)
// rsima = ta.sma(rsi,14)

// Define the Indian Standard Time (IST) offset from GMT
ist_offset = 5.5 // IST is GMT+5:30

// Define the start and end times of the trading session in IST
// start_time = timestamp("GMT", year, month, dayofmonth, 10, 0) + ist_offset * 60 * 60
// end_time = timestamp("GMT", year, month, dayofmonth, 14, 0) + ist_offset * 60 * 60
// Check if the current time is within the trading session
// in_trading_session = timenow >= start_time and timenow <= end_time

in_trading_session = not na(time(timeframe.period, "0945-1430"))
// bgcolor(inSession ? color.silver : na)
out_trading_session = not na(time(timeframe.period, "1515-1530"))
// // // Define buy and sell signals
buySignal = close>upper and close > supertrend_5m and close > supertrend_60 and close > ma21  and in_trading_session //close > supertrend and
sellSignal = close<lower and close < supertrend_5m and close < supertrend_60 and close < ma21  and in_trading_session //close < supertrend and

var bool long_position = false
var bool long_exit = false
var float long_entry_price = 0
var float short_entry_price = 0

if buySignal and not long_position
    // label.new(bar_index, na, yloc = yloc.belowbar, style = label.style_label_up, color = color.green, size = size.small)
    long_position := true
    strategy.entry("Buy",strategy.long)

long_exit := (close < supertrend_5m)
if long_position and long_exit
    // label.new(bar_index, na, yloc = yloc.belowbar, style = label.style_xcross, color = color.green, size = size.tiny)
    long_position := false
    strategy.exit("Exit","Buy",stop = close)

var bool short_position = false
var bool short_exit = false
if sellSignal and not short_position
    // label.new(bar_index, na, yloc = yloc.abovebar, style = label.style_label_down, color = color.red, size = size.small)
    short_position := true
    strategy.entry("Sell",strategy.short)

short_exit := (close > supertrend_5m)
if short_position and short_exit
    // label.new(bar_index, na, yloc = yloc.belowbar, style = label.style_xcross, color = color.red, size = size.tiny)
    short_position := false
    strategy.exit("Exit","Sell", stop = close)

if out_trading_session
    long_position := false
    strategy.exit("Exit","Buy",stop = close)
    short_position := false
    strategy.exit("Exit","Sell", stop = close)

// if long_position
//     long_entry_price := close[1] + 50//bar_index

// if short_position
//     short_entry_price := close[1] - 50//bar_index

// if (long_position and high[1] > long_entry_price)
//     label.new(bar_index, na, yloc = yloc.abovebar, style = label.style_triangledown, color = color.yellow, size = size.tiny)

// if (short_position and low[1] < short_entry_price)
//     label.new(bar_index, na, yloc = yloc.belowbar, style = label.style_triangleup, color = color.yellow, size = size.tiny)