Stratégie de suivi de la dynamique adaptative multifactorielle

Aperçu
La stratégie de suivi de la dynamique auto-adaptative multi-facteur permet d'automatiser les transactions sur des actifs très volatils tels que les crypto-monnaies en intégrant plusieurs indicateurs techniques pour identifier les tendances du marché et les points de résistance de soutien critique. La stratégie utilise des indicateurs tels que le RSI, le MACD et le Stochastic pour déterminer le moment de l'achat et de la vente, tout en permettant une identification plus précise des tendances en combinaison avec le pourcentage de variation des prix.
Principe de stratégie
Le cœur de la stratégie de suivi de la dynamique d'adaptation multifonctionnelle réside dans l'utilisation intégrée de plusieurs indicateurs techniques. La stratégie utilise principalement les composants suivants:
-
L'indicateur RSI détermine si le RSI est en sur-achat ou en sur-vente. En combinant différents paramètres, il est possible d'identifier le signal RSI ordinaire ou le signal RSI amélioré de Conner afin de déterminer s'il existe une possibilité de reprise.
-
L'indicateur MACD aide à déterminer la direction de la tendance. Il génère des signaux d'achat et de vente lorsque le MACD traverse ou descend la ligne de signal.
-
L'indicateur stochastique identifie les zones de survente et de surachat. Le signal combiné de la ligne K et de la ligne D pour la résolution de la résolution est inversé.
-
Le pourcentage de variation des prix permet de déterminer si une rupture est réelle. On calcule le pourcentage de variation des prix les plus élevés, les plus bas et les plus bas d'une période donnée pour déterminer s'il s'agit d'une véritable rupture.
-
L'EMA détermine la volatilité à des niveaux plus élevés. La ligne rapide est un signal de hausse et la ligne lente est un signal de baisse.
Cette stratégie consiste à choisir de faire plus de prises de position en fonction de l'abondance du marché et à définir un stop loss après avoir entré dans la position, afin de contrôler efficacement le risque. Choisir de quitter la position en position nulle lorsque le signal de revers apparaît. L'ensemble du processus de décision est pleinement intégré à plusieurs facteurs de jugement, ce qui permet de rendre des jugements plus précis.
Analyse des avantages
Cette stratégie présente les avantages suivants:
-
Le pilotage multifactoriel présente un avantage de jugement. Par rapport à un seul indicateur, les combinaisons de plusieurs indicateurs peuvent se vérifier les uns les autres, ce qui rend les résultats plus précis et plus fiables, évitant ainsi des coûts de transaction inutiles.
-
La stratégie impose des exigences strictes sur les conditions d'achat et de vente, nécessitant plusieurs indicateurs pour libérer des signaux simultanément, ce qui permet de filtrer une grande quantité de bruit et d'éviter les transactions erronées.
-
La capacité de la stratégie à calculer dynamiquement les paramètres de l'indicateur, évitant ainsi la subjectivité de la sélection manuelle des paramètres de la stratégie, rendant ainsi les paramètres de la stratégie plus scientifiques.
-
Le système de coupe de stop-loss contrôle les risques. La stratégie calcule et trace la position de la coupe de stop-loss en temps réel après l'ouverture de la position, ce qui permet de contrôler efficacement les pertes individuelles et d'éviter la rupture de la position.
Analyse des risques
Cette stratégie comporte aussi des risques à éviter:
-
La probabilité d'erreur d'indicateur de libération de signal. Bien que la vérification multi-indicateur puisse réduire considérablement le taux de signal erroné, il est possible que cela se produise. Cela peut entraîner des pertes inutiles.
-
Risque de rupture du stop. Dans des cas extrêmes, le prix peut chuter de manière abrupte, ce qui entraîne une rupture facile du stop et une perte plus importante.
-
L'optimisation des paramètres entraîne une sur-optimisation. Les paramètres dynamiques, bien qu'ils évitent la subjectivité induite par la sélection artificielle, peuvent également entraîner une sur-optimisation des paramètres et une perte de généralisation.
La réponse:
- Augmentation de la rigueur des conditions de filtrage du signal et réduction du taux de faux signaux.
- La construction des entrepôts par lots permet d'éviter des pertes excessives en une seule opération.
- Augmenter le nombre d'échantillons testés et évaluer rigoureusement la stabilité des paramètres
Orientation de l'optimisation de la stratégie
Les stratégies de suivi de la dynamique d'adaptation multifonctionnelle ont les dimensions suivantes qui peuvent être optimisées:
-
Augmentation du nombre de facteurs de jugement. Combinaison de plus de différents types de jugements de signaux d'indicateurs, tels que le taux de volatilité, le volume des transactions et d'autres jugements auxiliaires.
-
L'optimisation des mécanismes d'arrêt des pertes. Des algorithmes d'arrêt plus avancés, tels que l'arrêt de suivi et l'arrêt de choc, peuvent être introduits pour réduire davantage la probabilité de rupture de l'arrêt.
-
Introduire des modèles d'apprentissage automatique. Utiliser des modèles tels que RNN, LSTM pour modéliser les données historiques et aider à prendre des décisions d'achat et de vente.
-
L'intégration des stratégies. L'adoption de plusieurs sous-stratégies et l'intégration de celles-ci à l'aide d'une méthode d'apprentissage intégré permettent d'obtenir une performance globale plus stable.
Résumer
La stratégie de suivi de la dynamique d'adaptation multifonctionnelle intègre l'utilisation de plusieurs indicateurs techniques pour identifier le moment de l'achat et de la vente. Comparé à un seul indicateur, le jugement de la stratégie est plus précis, tandis que les paramètres intégrés s'adaptent et contrôlent le risque de mécanismes d'arrêt. La prochaine étape consiste à introduire davantage de facteurs de jugement auxiliaires, des algorithmes d'arrêt avancés et des méthodes d'apprentissage automatique.
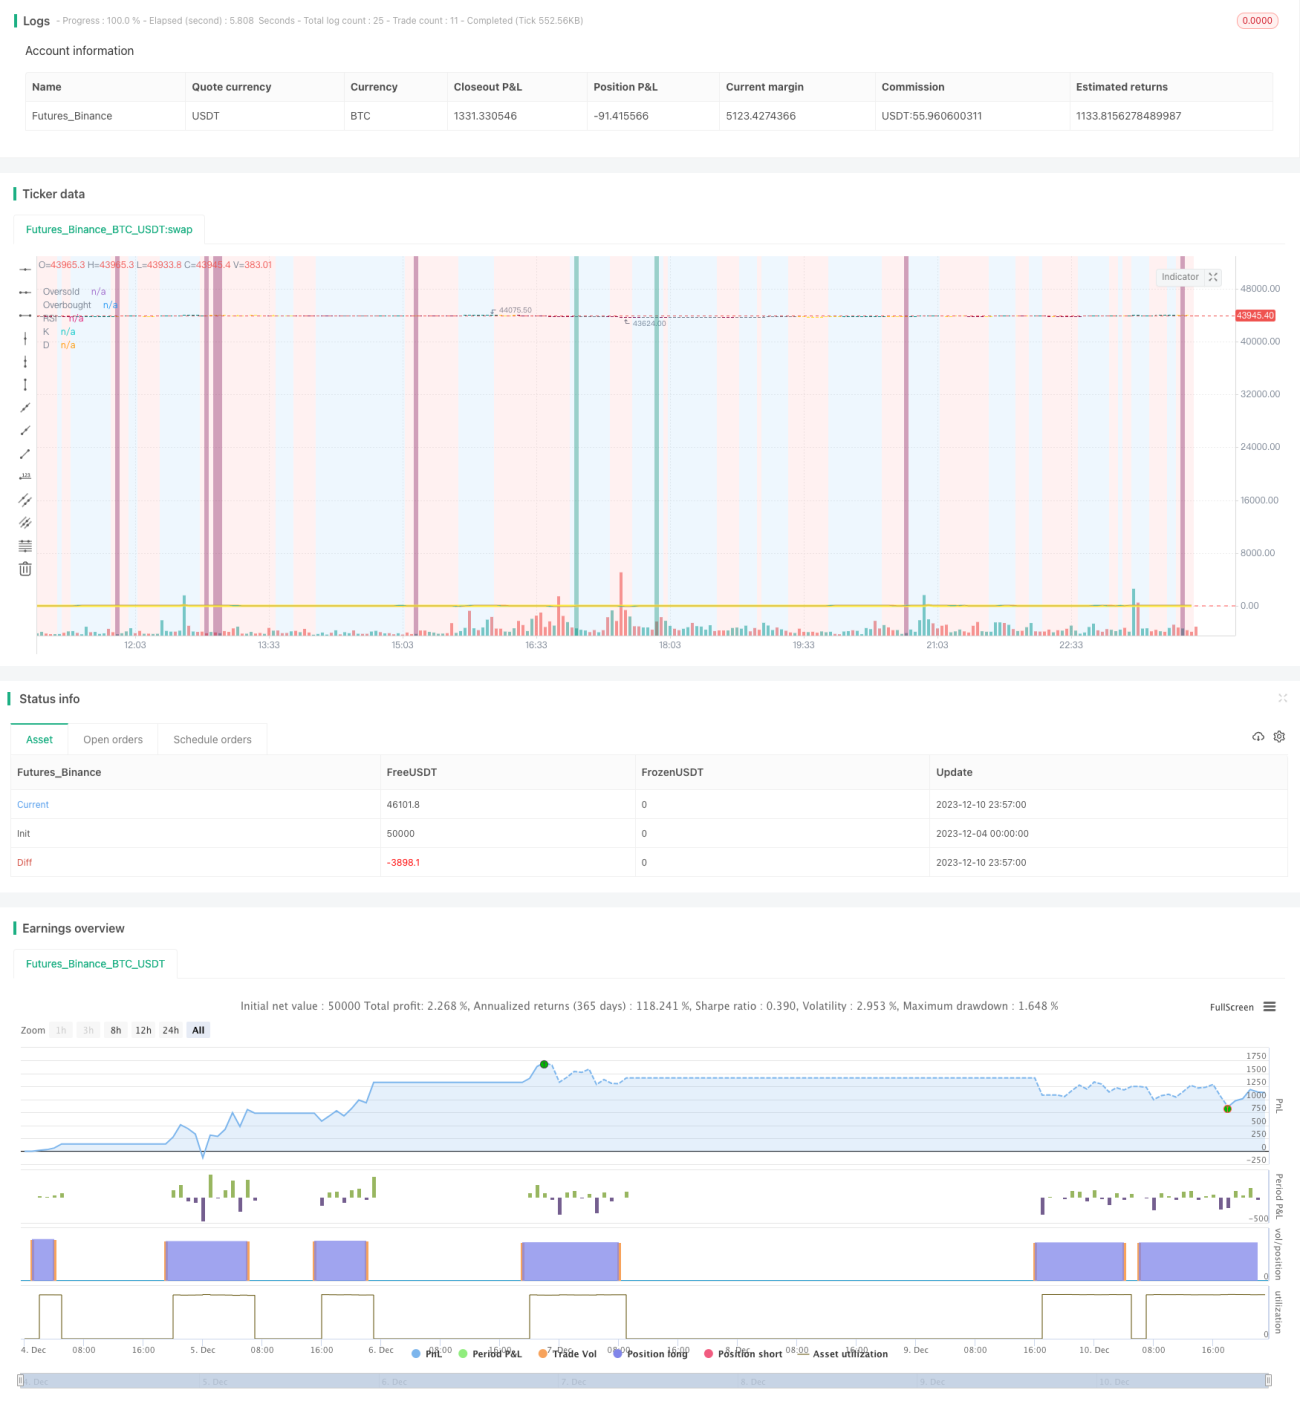
/*backtest
start: 2023-12-04 00:00:00
end: 2023-12-11 00:00:00
period: 3m
basePeriod: 1m
exchanges: [{"eid":"Futures_Binance","currency":"BTC_USDT"}]
*/

// This source code is subject to the terms of the Mozilla Public License 2.0 at https://mozilla.org/MPL/2.0/
//@version=4

// ██████╗██████╗ ███████╗ █████╗ ████████╗███████╗██████╗ ██████╗ ██╗ ██╗ - 1