Stratégies de suivi de tendance basées sur plusieurs indicateurs
Aperçu
Cette stratégie s’appelleStratégie de suivi des tendances dans une combinaison de plusieurs indicateursLa stratégie de suivi de tendance multi-indicateurs (Multi-Indicator Trend Tracking Strategy), qui utilise plusieurs indicateurs tels que la variation de Fisher, les moyennes mobiles pondérées (WMA), le RSI et la ligne de la moyenne (OBV) pour déterminer la direction de la tendance du marché et effectuer des transactions de suivi de tendance.
Principe de stratégie
- L’indicateur de variation de Fisher détermine la tendance et l’intensité des variations de prix. Il émet un signal de transaction lorsque 4 lignes de Fisher changent de couleur simultanément.
- La WMA détermine la direction de la tendance générale.
- L’indicateur OBV est utilisé pour confirmer les tendances.
En particulier, l’indicateur de conversion de Fisher contient 4 lignes de 1, 2, 4 et 8 fois. Lorsque 4 lignes tournent vers le haut en vert, elles produisent un signal de plus et que 4 lignes tournent vers le bas en rouge, elles produisent un signal de moins.
Analyse des avantages
Cette stratégie présente les avantages suivants:
- L’indicateur de conversion de Fisher a un fort pouvoir de jugement, et il est très probable qu’un renversement de tendance se produise lorsque 4 lignes de Fisher changent de couleur en même temps.
- Le WMA détermine la direction des grandes tendances et évite les échanges à contre-courant.
- L’indicateur OBV confirme la tendance et évite les faux rebonds dans les marchés sans tendance.
- L’indicateur RSI filtre les fausses informations pour assurer la fiabilité des signaux.
L’application combinée de plusieurs indicateurs assure à la fois l’exactitude et la fiabilité des signaux de négociation et la capacité de suivre les tendances, ce qui permet d’obtenir de meilleurs résultats stratégiques.
Analyse des risques
Cette stratégie comporte aussi des risques:
- La ligne de Fisher est susceptible de produire de faux signaux en cas de correction. Le filtrage RSI est utilisé.
- Le mauvais réglage des paramètres WMA peut également affecter l’accurance des jugements.
- L’indicateur de conversion de Fisher est moins judicieux pour les courts métrages.
- La stratégie peut entraîner des pertes énormes en cas de coupure de câble.
Pour réduire le risque, il est possible d’ajuster les paramètres RSI et d’optimiser les paramètres cycliques WMA. Il est également possible de définir des points de rupture pour éviter des pertes excessives.
Direction d’optimisation
Cette stratégie peut être améliorée par:
- Il est possible de tester l’efficacité de la stratégie avec différents paramètres de périodes pour trouver la meilleure combinaison de paramètres.
- Ajout d’un mécanisme d’arrêt des pertes. Les pertes s’arrêtent lorsque la perte atteint une certaine proportion.
- Les paramètres de l’indicateur de conversion de Fisher sont ajustés en fonction des résultats de la rétro-mesure pour trouver la combinaison de paramètres la plus précise pour déterminer l’indicateur.
- Essayez d’ajouter des filtres sur d’autres indicateurs, tels que les indices de force et de faiblesse, les préjugés, etc.
- Testez les différentes positions de démarrage.
Résumer
Cette stratégie utilise l’indicateur de conversion de Fisher, l’indicateur WMA, l’indicateur OBV et l’indicateur RSI pour déterminer la direction de la tendance du marché. Son signal de jugement est précis, sa capacité de confirmation est forte et il est capable de localiser efficacement la tendance à la rentabilité.
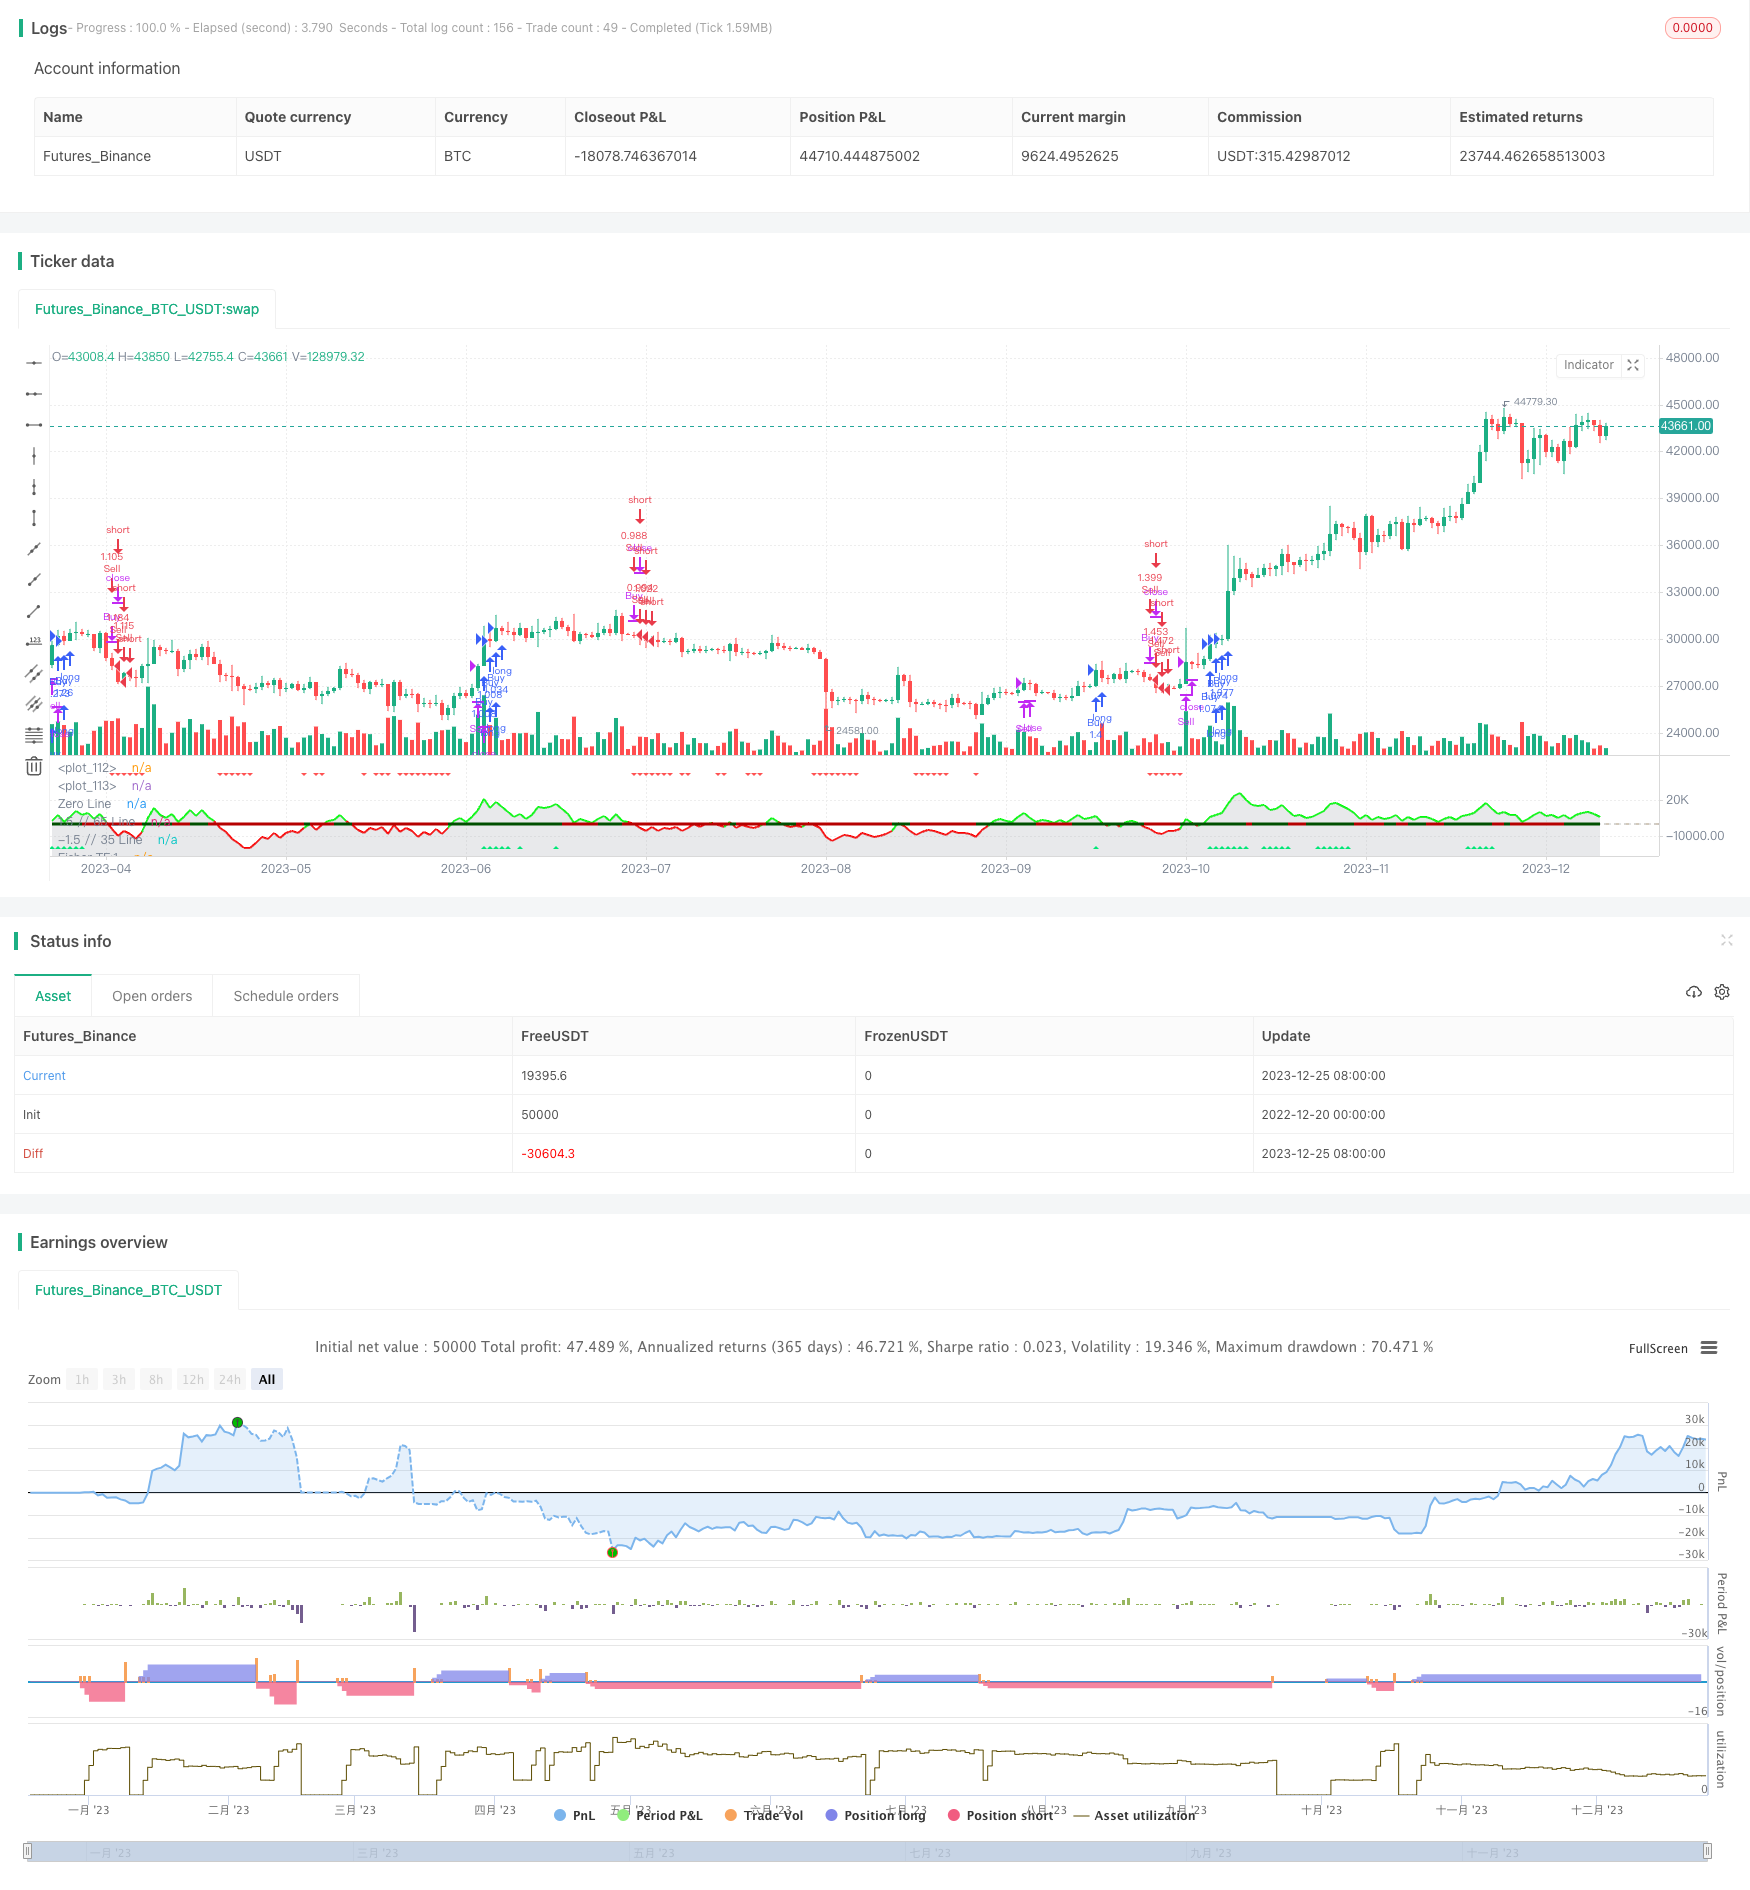
/*backtest
start: 2022-12-20 00:00:00
end: 2023-12-26 00:00:00
period: 1d
basePeriod: 1h
exchanges: [{"eid":"Futures_Binance","currency":"BTC_USDT"}]
*/

//@version=5
//author Sdover0123
strategy(title='FTR, WMA, OBV & RSI Strat', shorttitle='FTR WMA, OBV, RSI',overlay=false, default_qty_type=strategy.percent_of_equity, initial_capital = 100, default_qty_value=100, commission_value = 0.06, pyramiding = 3)
Len = input.int(10, minval=1, group ="Fisher Transform")
mult1 = input.int(1, minval=1, group ="Fisher Transform")
mult2 = input.int(2, minval=1, group ="Fisher Transform")
mult3 = input.int(4, minval=1, group ="Fisher Transform")
mult4 = input.int(8, minval=1, group ="Fisher Transform")
fish(Length, timeMultiplier) =>
    var nValue1 = 0.0
    var nValue2 = 0.0
    var nFish = 0.0
    xHL2 = hl2
    xMaxH = ta.highest(xHL2, Length * timeMultiplier)
    xMinL = ta.lowest(xHL2, Length * timeMultiplier)
    nValue1 := 0.33 * 2 * ((xHL2 - xMinL) / (xMaxH - xMinL) - 0.5) + 0.67 * nz(nValue1[1])
    if nValue1 > .99
        nValue2 := .999
        nValue2
    else if nValue1 < -.99
        nValue2 := -.999
        nValue2
    else
        nValue2 := nValue1
        nValue2
    nFish := 0.5 * math.log((1 + nValue2) / (1 - nValue2)) + 0.5 * nz(nFish[1])
    nFish
Fisher1 = fish(Len, mult1)
Fisher2 = fish(Len, mult2)
Fisher4 = fish(Len, mult3)
Fisher8 = fish(Len, mult4)

rsiLength = input.int(14, minval=1, group ="Moving Averages")
rsiVal = (ta.rsi(close, rsiLength) - 50) / 10
avg = strategy.position_avg_price

wma(source, length) =>
    sum = 0.0
    for i = 0 to length - 1
        sum := sum + source[i] * (length - i)
    wma = sum / (length * (length + 1) / 2)
    wma

wmaLength = input.int(10, "WMA Length", minval=1, group ="Moving Averages")
wmaClose = wma(close, wmaLength)
// Determine if WMA is bullish or bearish
isWmaBullish = wmaClose > wmaClose[1]
isWmaBearish = wmaClose < wmaClose[1]

//OBV
src = close
length = input.int(20, title="OBV Length", group="On-Balance Volume")
obv1(src) =>
    change_1 = ta.change(src)
    ta.cum(ta.change(src) > 0 ? volume : change_1 < 0 ? -volume : 0 * volume)*0.01
os = obv1(src)
obv_osc = os - ta.ema(os, length)
obc_color = (obv_osc > 0 ? color.rgb(0, 255, 8) : color.rgb(255, 0, 0))
plot(obv_osc, color=obc_color, style=plot.style_line, title='OBV-Points', linewidth=2)
plot(obv_osc, color=color.new(#b2b5be, 70), title='OBV', style=plot.style_area)
obvBullFilter = input.float(0.1, minval = 0, maxval = 5, step = 0.01, title ="OBV Bullish minimum value", group="On-Balance Volume")
obvBearFilter = input.float(-0.1, minval = -5, maxval = 0, step = 0.01, title ="OBV Bearish minimum value", group="On-Balance Volume")
obvBull = obv_osc > obvBullFilter
obvBear = obv_osc < obvBearFilter

// Add buy/sell signals
ReversalFilterDown = input.float(-0.7, 'Reversal Down TP Filter', -4, 4, step = 0.01, group = "RSI Level Filters", tooltip = "This is defined by taking the RSI value -50 and /10. When all Fisher lines are changing colour, this will SL/TP the long")
ReversalFilterUp = input.float(0.7, 'Reversal Up TP Filter', -4, 4, step = 0.01, group = "RSI Level Filters", tooltip = "This is defined by taking the RSI value -50 and /10. When all Fisher lines are changing colour, this will SL/TP the short")
RSILevelBuyFilter = input.float(1.66, 'RSI Level Buy Filter', -4, 4, step = 0.01, group = "RSI Level Filters", tooltip = "This is defined by taking the RSI value -50 and /10. Consider negative values")
RSILevelSellFilter = input.float(1, 'RSI Level Sell Filter', -4, 4, step = 0.01, group = "RSI Level Filters", tooltip = "This is defined by taking the RSI value -50 and /10. Consider negative values")
//buys - if breaking out and all Fisher are green and RSI filter value is met
buySignal = Fisher1 > Fisher1[1] and Fisher2 > Fisher2[1] and Fisher4 > Fisher4[1] and Fisher8 > Fisher8[1] and rsiVal > RSILevelBuyFilter and isWmaBullish and obvBull
ReversalUp = Fisher1 > Fisher1[1] and Fisher2 > Fisher2[1] and Fisher4 > Fisher4[1] and Fisher8 > Fisher8[1] and rsiVal > ReversalFilterUp
//sells - if breaking down and all Fisher are green and RSI filter value is met
sellSignal = Fisher1 < Fisher1[1] and Fisher2 < Fisher2[1] and Fisher4 < Fisher4[1] and Fisher8 < Fisher8[1] and rsiVal < RSILevelSellFilter and isWmaBearish and obvBear
ReversalDown = Fisher1 < Fisher1[1] and Fisher2 < Fisher2[1] and Fisher4 < Fisher4[1] and Fisher8 < Fisher8[1] and rsiVal < ReversalFilterDown


// Buy and Sell conditions
if buySignal and time>timestamp(2022, 06, 01, 09, 30) and barstate.isconfirmed
    strategy.close("Sell", comment = "Close Short")
    strategy.entry("Buy", strategy.long, comment = "Long")

if sellSignal and time>timestamp(2022, 06, 01, 09, 30) and barstate.isconfirmed
    strategy.close("Buy", comment = "Close Long")
    strategy.entry("Sell", strategy.short, comment = "Short")

if ReversalDown
    strategy.close("Buy", comment = "Close Long")

if ReversalUp
    strategy.close("Sell", comment = "Close Short")

//Plotting
//Fisher
plot(Fisher1, color=Fisher1 > nz(Fisher1[1]) ? color.green : color.rgb(255, 0, 0), title='Fisher TF:1')
plot(Fisher2, color=Fisher2 > nz(Fisher2[1]) ? color.green : color.rgb(255, 0, 0), title='Fisher TF:1', linewidth=2)
plot(Fisher4, color=Fisher4 > nz(Fisher4[1]) ? #008000 : #b60000, title='Fisher TF:1', linewidth=3)
plot(Fisher8, color=Fisher8 > nz(Fisher8[1]) ? #004f00 : #b60000, title='Fisher TF:1', linewidth=3)
//RSI
plot(rsiVal, color=rsiVal < 0 ? color.purple : color.yellow, linewidth=2, title='RSI')

//WMA
plot(isWmaBullish ? -2 : na, color=color.rgb(76, 175, 79, 20), linewidth=3, style=plot.style_linebr, title="WMA Bullish")
plot(isWmaBearish ? -2 : na, color=color.rgb(255, 82, 82, 20), linewidth=3, style=plot.style_linebr, title="WMA Bearish")

//Buy/Sell Signals
plotshape(buySignal, title='Buy Signal', location=location.bottom, color=color.new(color.lime, 0), style=shape.triangleup, size=size.small)
plotshape(sellSignal, title='Sell Signal', location=location.top, color=color.new(color.red, 0), style=shape.triangledown, size=size.small)

//Orientation
hline(RSILevelBuyFilter, color=color.rgb(25, 36, 99, 20), linestyle=hline.style_dotted, linewidth=2)
hline(RSILevelSellFilter, color=color.rgb(111, 27, 27, 20), linestyle=hline.style_dotted, linewidth=2)
hline(0, color=color.rgb(181, 166, 144, 39), linestyle=hline.style_dashed, linewidth=2, title = "Zero Line")
hline(1.5, color=color.rgb(217, 219, 220, 50), linestyle=hline.style_dotted, linewidth=2, title = "1.5 // 65 Line")
hline(-1.5, color=color.rgb(217, 219, 220, 50), linestyle=hline.style_dotted, linewidth=2, title = "-1.5 // 35 Line")