Stratégie de suivi automatique des tendances basée sur T3 et ATR
Aperçu
Le cœur de cette stratégie est d’utiliser les moyennes mobiles lisses de l’indicateur T3 et les arrêts dynamiques de l’indicateur ATR pour identifier la direction de la tendance et suivre la tendance. La stratégie, combinant le suivi de la tendance et les opportunités de renversement de tendance, vise à obtenir plus de profit dans une tendance.
Principe de stratégie
Cette stratégie utilise les moyennes mobiles lisses du cours de l’indicateur T3 et les moyennes réelles de l’indicateur ATR pour calculer la portée des fluctuations du cycle. Un signal de transaction est généré lorsque le prix franchit l’arrêt ATR dynamique. Plus précisément, un signal d’achat est généré lorsque le prix franchit l’arrêt ATR au-dessus et un signal de vente lorsque le prix franchit l’arrêt ATR en dessous.
Afin de filtrer les signaux faux, la stratégie exige en outre que le prix doit également franchir la moyenne mobile T3 pour confirmer le signal. En outre, la stratégie calcule les points d’arrêt et d’arrêt par les valeurs ATR pour la gestion des risques.
Analyse des avantages
Comparé aux moyennes mobiles traditionnelles, l’indicateur T3 a une plus grande sensibilité et moins de latence, permettant de capturer plus rapidement les changements de tendance des prix. En outre, le T3 a des avantages mathématiques qui permettent de fournir des moyennes mobiles plus précises et plus lisses.
Les valeurs ATR reflètent la volatilité et le niveau de risque du marché actuel. Les ATR dynamiques suivent les arrêts et les arrêts de perte pour ajuster dynamiquement la taille de la position, obtenir plus de profit dans des conditions de tendance et réduire les pertes dans des conditions de choc.
Analyse des risques
La stratégie repose sur le calcul des indicateurs et présente un risque de arbitrage. En outre, les moyennes mobiles lisses T3 et les arrêts dynamiques ATR sont en retard et risquent de manquer des occasions de retournement rapide des prix. Les paramètres peuvent être ajustés de manière appropriée ou optimisés en combinaison avec d’autres indicateurs.
Lors d’un renversement de tendance, le stop loss peut être dépassé, ce qui augmente les pertes. Il est possible d’assouplir la portée du stop loss ou d’utiliser d’autres paramètres tels que la valeur de Handle comme base de stop loss.
Direction d’optimisation
Les paramètres de l’indicateur T3 peuvent être ajustés pour optimiser sa sensibilité.
Il est possible de tester différents paramètres ATR pour trouver la valeur optimale.
Il est possible d’essayer différents coefficients de risque-rendement pour déterminer les paramètres optimaux.
D’autres indicateurs peuvent être ajoutés au filtrage, comme l’indice de flux de trésorerie.
Les combinaisons de paramètres peuvent être automatiquement optimisées à l’aide de méthodes d’apprentissage automatique.
Résumer
La stratégie intègre la capacité de suivi de la tendance des moyennes mobiles T3 et la capacité d’ajustement dynamique des arrêts de perte de l’ATR. La stratégie, qui prend en compte à la fois le suivi de la tendance et les opportunités de retournement, est une stratégie de trading quantitative universelle.
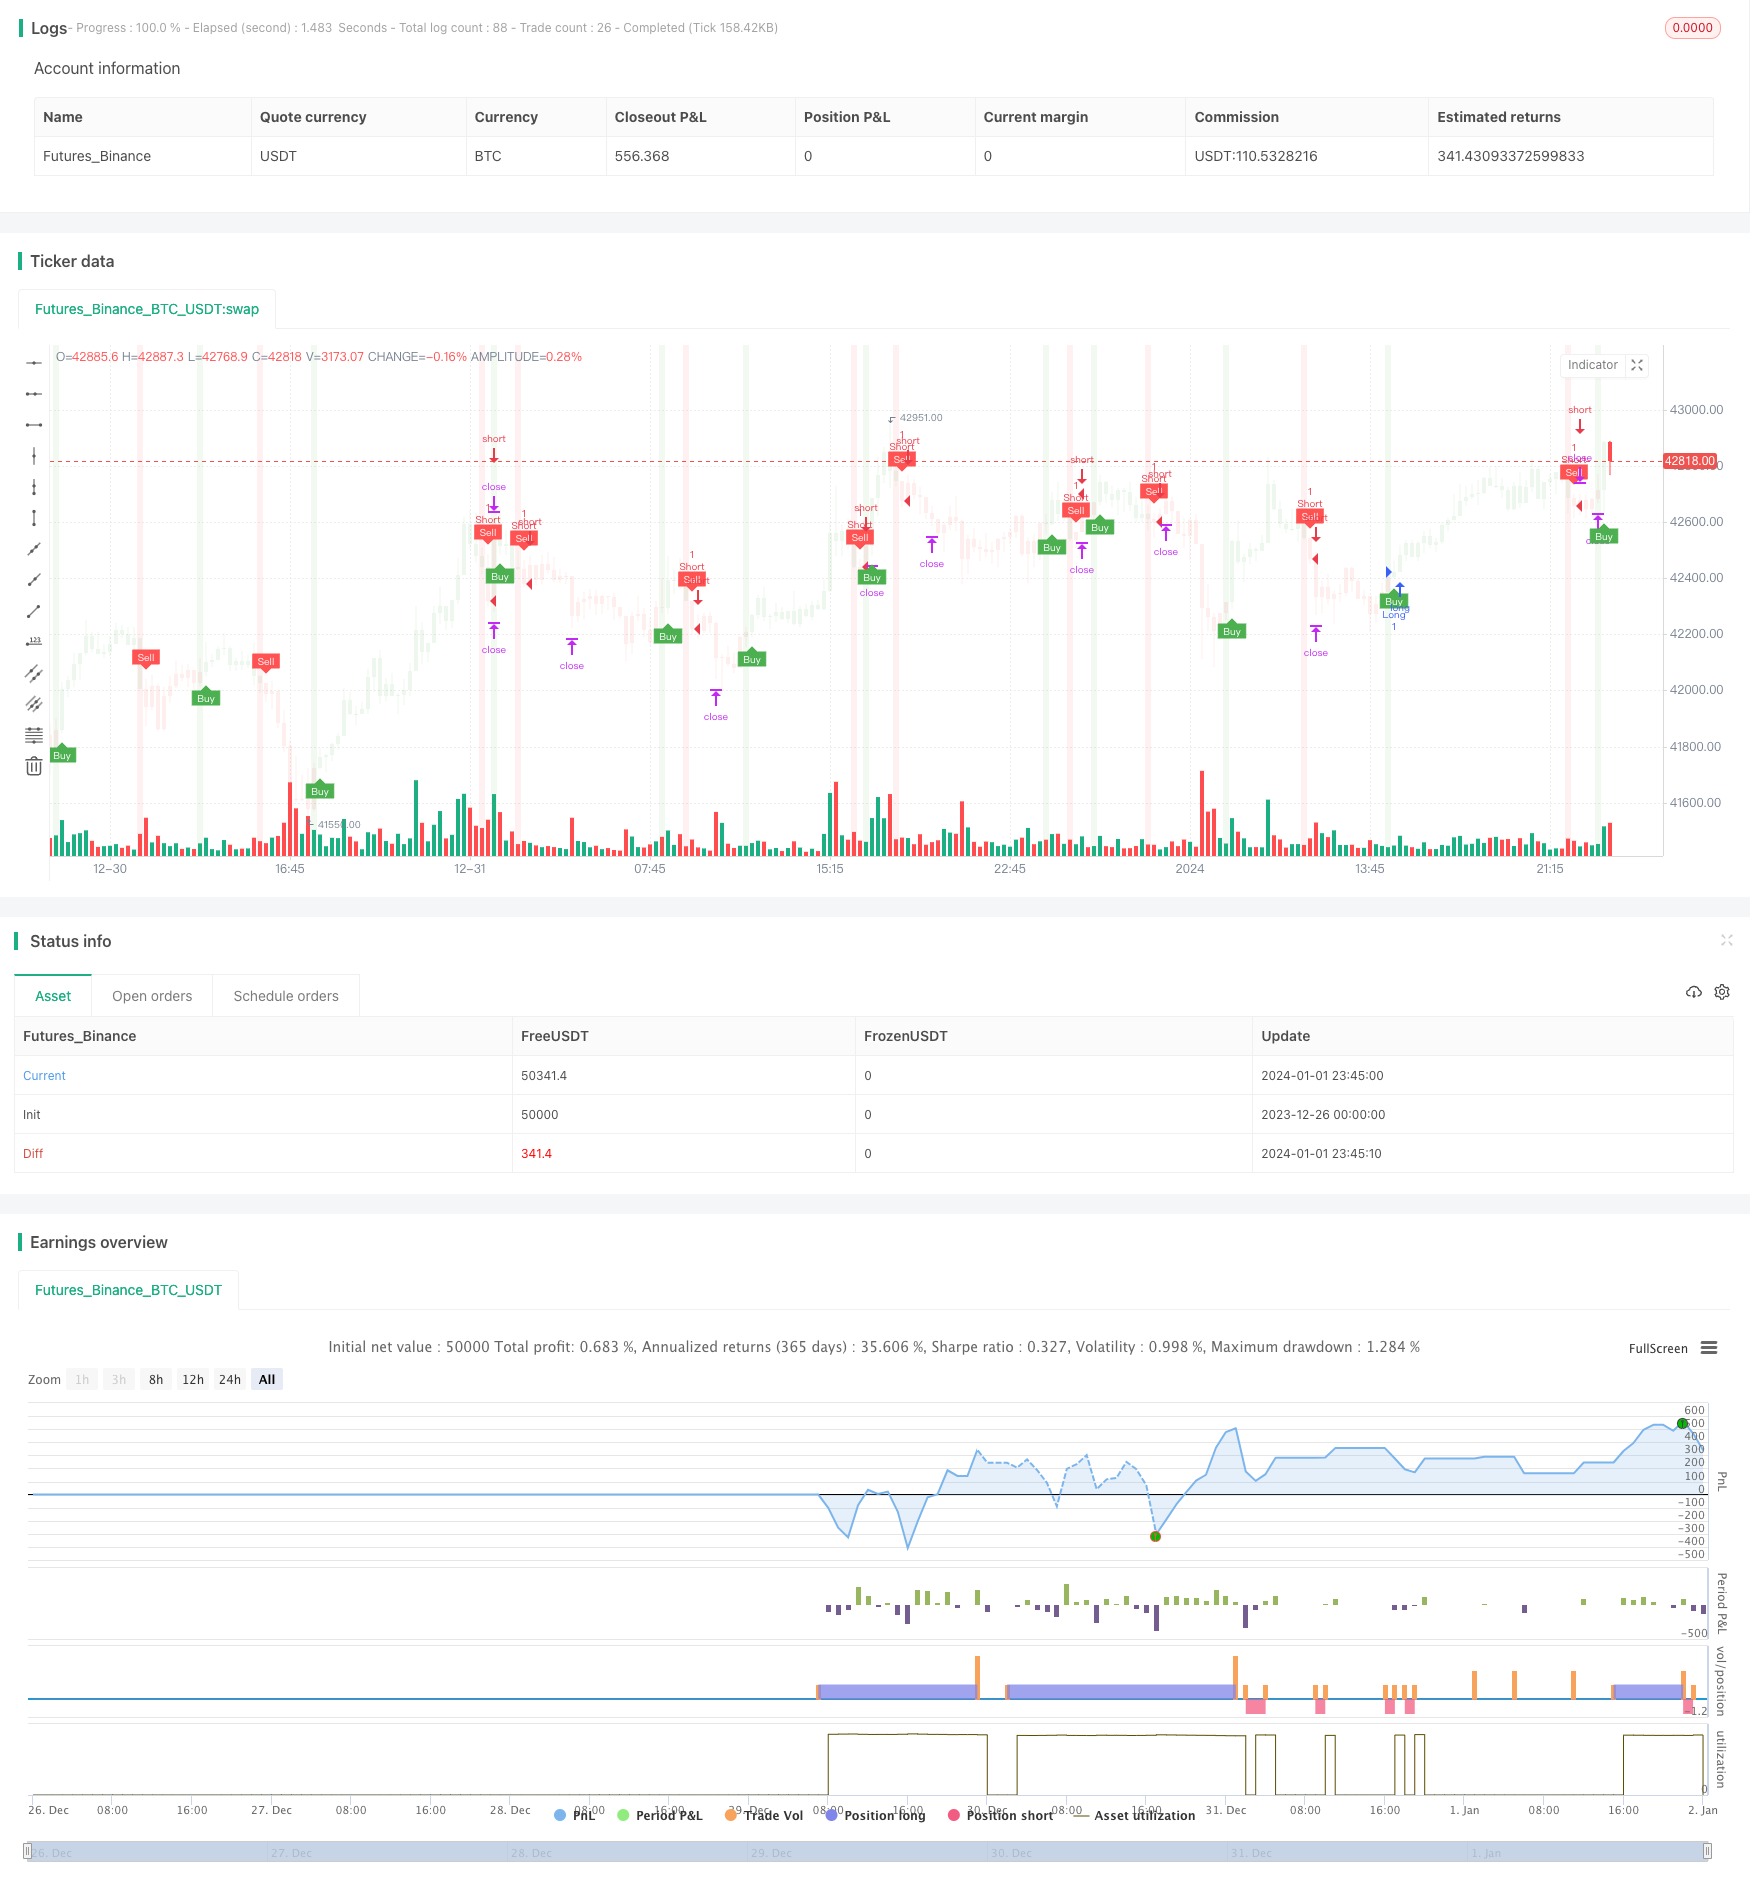
/*backtest
start: 2023-12-26 00:00:00
end: 2024-01-02 00:00:00
period: 15m
basePeriod: 5m
exchanges: [{"eid":"Futures_Binance","currency":"BTC_USDT"}]
*/

//@version=5
strategy(title='NinjaView Example 1 (UTBA "QuantNomad" Strategy)', overlay=true)
T3 = input(100)//600
// Input for Long Settings
// Input for Long Settings


xPrice3 = close
xe1 = ta.ema(xPrice3, T3)
xe2 = ta.ema(xe1, T3)
xe3 = ta.ema(xe2, T3)
xe4 = ta.ema(xe3, T3)
xe5 = ta.ema(xe4, T3)
xe6 = ta.ema(xe5, T3)

b3 = 0.7
c1 = -b3*b3*b3
c2 = 3*b3*b3+3*b3*b3*b3
c3 = -6*b3*b3-3*b3-3*b3*b3*b3
c4 = 1+3*b3+b3*b3*b3+3*b3*b3
nT3Average = c1 * xe6 + c2 * xe5 + c3 * xe4 + c4 * xe3

//plot(nT3Average, color=color.white, title="T3")

// Buy Signal - Price is below T3 Average
buySignal3 = xPrice3 < nT3Average
sellSignal3 = xPrice3 > nT3Average
// Inputs
a = input(1, title='Key Value. "This changes the sensitivity"')
c = input(50, title='ATR Period')
h = input(true, title='Signals from Heikin Ashi Candles')
riskRewardRatio = input(1, title='Risk Reward Ratio')

xATR = ta.atr(c)
nLoss = a * xATR

src = h ? request.security(ticker.heikinashi(syminfo.tickerid), timeframe.period, close, lookahead=barmerge.lookahead_off) : close

xATRTrailingStop = 0.0
iff_1 = src > nz(xATRTrailingStop[1], 0) ? src - nLoss : src + nLoss
iff_2 = src < nz(xATRTrailingStop[1], 0) and src[1] < nz(xATRTrailingStop[1], 0) ? math.min(nz(xATRTrailingStop[1]), src + nLoss) : iff_1
xATRTrailingStop := src > nz(xATRTrailingStop[1], 0) and src[1] > nz(xATRTrailingStop[1], 0) ? math.max(nz(xATRTrailingStop[1]), src - nLoss) : iff_2

pos = 0
iff_3 = src[1] > nz(xATRTrailingStop[1], 0) and src < nz(xATRTrailingStop[1], 0) ? -1 : nz(pos[1], 0)
pos := src[1] < nz(xATRTrailingStop[1], 0) and src > nz(xATRTrailingStop[1], 0) ? 1 : iff_3

xcolor = pos == -1 ? color.red : pos == 1 ? color.green : color.blue

ema = ta.ema(src, 1)
above = ta.crossover(ema, xATRTrailingStop)
below = ta.crossunder(ema, xATRTrailingStop)

buy = src > xATRTrailingStop and above
sell = src < xATRTrailingStop and below

barbuy = src > xATRTrailingStop
barsell = src < xATRTrailingStop

plotshape(buy, title='Buy', text='Buy', style=shape.labelup, location=location.belowbar, color=color.new(color.green, 0), textcolor=color.new(color.white, 0), size=size.tiny)
plotshape(sell, title='Sell', text='Sell', style=shape.labeldown, location=location.abovebar, color=color.new(color.red, 0), textcolor=color.new(color.white, 0), size=size.tiny)

barcolor(barbuy ? color.new(color.green, 90) : na)
barcolor(barsell ? color.new(color.red, 90) : na)

var float entryPrice = na
var float takeProfitLong = na
var float stopLossLong = na
var float takeProfitShort = na
var float stopLossShort = na

if buy and buySignal3
    entryPrice := src
    takeProfitLong := entryPrice + nLoss * riskRewardRatio
    stopLossLong := entryPrice - nLoss
    takeProfitShort := na
    stopLossShort := na

if sell and sellSignal3
    entryPrice := src
    takeProfitShort := entryPrice - nLoss * riskRewardRatio
    stopLossShort := entryPrice + nLoss
    takeProfitLong := na
    stopLossLong := na

// Strategy order conditions
acct = "Sim101"
ticker = "ES 12-23"
qty = 1

OCOMarketLong = '{ "alert": "OCO Market Long", "account": "' + str.tostring(acct) + '", "ticker": "' + str.tostring(ticker) + '", "qty": "' + str.tostring(qty) + '", "take_profit_price": "' + str.tostring(takeProfitLong) + '", "stop_price": "' + str.tostring(stopLossLong) + '", "tif": "DAY" }'
OCOMarketShort = '{ "alert": "OCO Market Short", "account": "' + str.tostring(acct) + '", "ticker": "' + str.tostring(ticker) + '", "qty": "' + str.tostring(qty) + '", "take_profit_price": "' + str.tostring(takeProfitShort) + '", "stop_price": "' + str.tostring(stopLossShort) + '", "tif": "DAY" }'
CloseAll = '{ "alert": "Close All", "account": "' + str.tostring(acct) + '", "ticker": "' + str.tostring(ticker) + '" }'

strategy.entry("Long", strategy.long, when=buy and buySignal3, alert_message=OCOMarketLong)
strategy.entry("Short", strategy.short, when=sell and sellSignal3, alert_message=OCOMarketShort)

// Setting the take profit and stop loss for long trades
strategy.exit("Take Profit/Stop Loss", "Long", stop=stopLossLong, limit=takeProfitLong,alert_message=CloseAll)

// Setting the take profit and stop loss for short trades
strategy.exit("Take Profit/Stop Loss", "Short", stop=stopLossShort, limit=takeProfitShort,alert_message=CloseAll)

// Plot trade setup boxes
bgcolor(buy ? color.new(color.green, 90) : na, transp=0, offset=-1)
bgcolor(sell ? color.new(color.red, 90) : na, transp=0, offset=-1)

// longCondition = buy and not na(entryPrice)
// shortCondition = sell and not na(entryPrice)

// var line longTakeProfitLine = na
// var line longStopLossLine = na
// var line shortTakeProfitLine = na
// var line shortStopLossLine = na

// if longCondition
//     longTakeProfitLine := line.new(bar_index, takeProfitLong, bar_index + 1, takeProfitLong, color=color.green, width=2)
//     longStopLossLine := line.new(bar_index, stopLossLong, bar_index + 1, stopLossLong, color=color.red, width=2)
//     label.new(bar_index + 1, takeProfitLong, str.tostring(takeProfitLong, "#.#####"), color=color.green, style=label.style_none, textcolor=color.green, size=size.tiny)
//     label.new(bar_index + 1, stopLossLong, str.tostring(stopLossLong, "#.#####"), color=color.red, style=label.style_none, textcolor=color.red, size=size.tiny)

// if shortCondition
//     shortTakeProfitLine := line.new(bar_index, takeProfitShort, bar_index + 1, takeProfitShort, color=color.green, width=2)
//     shortStopLossLine := line.new(bar_index, stopLossShort, bar_index + 1, stopLossShort, color=color.red, width=2)
//     label.new(bar_index + 1, takeProfitShort, str.tostring(takeProfitShort, "#.#####"), color=color.green, style=label.style_none, textcolor=color.green, size=size.tiny)
//     label.new(bar_index + 1, stopLossShort, str.tostring(stopLossShort, "#.#####"), color=color.red, style=label.style_none, textcolor=color.red, size=size.tiny)

alertcondition(buy, 'UT Long', 'UT Long')
alertcondition(sell, 'UT Short', 'UT Short')