क्रॉस-टाइमफ्रेम सुपर ट्रेंड शॉक ब्रेकआउट रणनीति
अवलोकन
यह रणनीति बहु-समय फ़्रेम के सुपरट्रेंड सूचकांकों और बुरिन बैंड सूचकांकों को जोड़ती है, प्रवृत्ति की दिशा और महत्वपूर्ण समर्थन प्रतिरोध की पहचान करती है, जब आघात टूट जाता है तो प्रविष्टियां होती हैं, और क्रॉस-एक्जिट स्थिति के आधार पर होती हैं। यह रणनीति मुख्य रूप से उच्च अस्थिरता वाले कमोडिटी वायदा किस्मों जैसे कि सोने, चांदी, कच्चे तेल आदि के लिए है।
रणनीति सिद्धांत
पीन स्क्रिप्ट पर आधारित कस्टम बहु-समय फ्रेम सुपरट्रेंड फ़ंक्शनpine_supertrend()विभिन्न चक्रों (उदाहरण के लिए 1 मिनट और 5 मिनट) के संयोजन में सुपरट्रेंड, बड़े चक्र की प्रवृत्ति की दिशा का निर्धारण करें।
उसी समय, बुलिन बैंड को ट्रैक करने के लिए गणना करें, और एक चैनल तोड़ने का निर्णय लें। जब कीमत बुलिन बैंड को ट्रैक करने के लिए तोड़ती है, तो इसे बैलेंस ब्रेक माना जाता है; जब कीमत बुलिन बैंड को ट्रैक करने के लिए गिरती है, तो इसे गिरावट के लिए माना जाता है।
रणनीतिक संकेत:
मल्टीहेड सिग्नलः समापन मूल्य > बुलिन पटरी पर है और समापन मूल्य > मल्टीटाइम फ़्रेम सुपरट्रेंड सूचक खाली सिर सिग्नलः समापन मूल्य < ब्रीज डाउन ट्रैक और समापन मूल्य < बहु-समय फ़्रेम सुपरट्रेंड सूचक
स्टॉप लॉस:
मल्टीहेड स्टॉपः क्लोजआउट मूल्य < 5 मिनट सुपर ट्रेंड सूचक खाली सिर रोकनाः समापन मूल्य > 5 मिनट सुपर ट्रेंड सूचक
इसलिए, रणनीति सुपरट्रेंड सूचकांक और बुरिन बैंड सूचकांक के प्रतिध्वनि को पकड़ती है और उच्च अस्थिरता के दौरान लेनदेन को संसाधित करती है।
श्रेष्ठता विश्लेषण
- मल्टी-टाइम फ़्रेम सुपरट्रेंड इंडिकेटर का उपयोग करके महाचक्र प्रवृत्ति की दिशा निर्धारित करने और सिग्नल गुणवत्ता में सुधार करने के लिए
- बुलिन बैंड को मुख्य समर्थन प्रतिरोध बिंदु के रूप में नीचे की ओर ले जाया जाता है, जिससे झूठी दरारें कम हो जाती हैं
- सुपरट्रेंड सूचक को स्टॉपलॉस के रूप में उपयोग करना, नुकसान को कम करना, जोखिम को नियंत्रित करना
जोखिम विश्लेषण
- सुपरट्रेंड सूचकांक में विलंबता है, और यह रुझान के मोड़ को याद कर सकता है
- ब्रिन बैंड पैरामीटर की गलत सेटिंग से बहुत अधिक बार या बहुत अधिक ट्रेडों को छोड़ दिया जा सकता है
- कमोडिटी फ्यूचर रात के बाजार या किसी बड़ी घटना के दौरान कीमतों में भारी उतार-चढ़ाव, नुकसान को रोकने के लिए आसान
जोखिम समाधान:
- कई सहायक संकेतों के साथ एक पुष्टिकरण संकेत, झूठी घुसपैठ से बचें
- सबसे अच्छा संतुलन खोजने के लिए ब्रिन बैंड पैरामीटर का अनुकूलन करें
- स्टॉप स्थान को समायोजित करें और स्टॉप दूरी को बढ़ाएं
अनुकूलन दिशा
- KDJ, MACD आदि जैसे अन्य ट्रेंडिंग सूचकांकों को सहायक के रूप में आज़माएं
- मशीन लर्निंग मॉडल में निर्णय की संभावना को बढ़ाने के लिए
- पैरामीटर अनुकूलन करें और सबसे अच्छा सुपरपैरमिटर संयोजन खोजें
संक्षेप
यह रणनीति सुपरट्रेंड्स और बुरीन बैंड के दो उच्च-प्रभावी संकेतकों को एकीकृत करती है, जो समय-सीमा विश्लेषण और चैनल ब्रेकआउट निर्णयों के माध्यम से उच्च-संभाव्यता संचालन को प्राप्त करती है। रणनीति ने फंड के जोखिम को प्रभावी ढंग से नियंत्रित किया है और उच्च अस्थिरता वाली किस्मों में बेहतर रिटर्न प्राप्त करने के लिए प्रमाणित किया है। रणनीति की प्रभावशीलता को और अधिक अनुकूलन और संकेतकों के संयोजन द्वारा बढ़ाया जा सकता है।
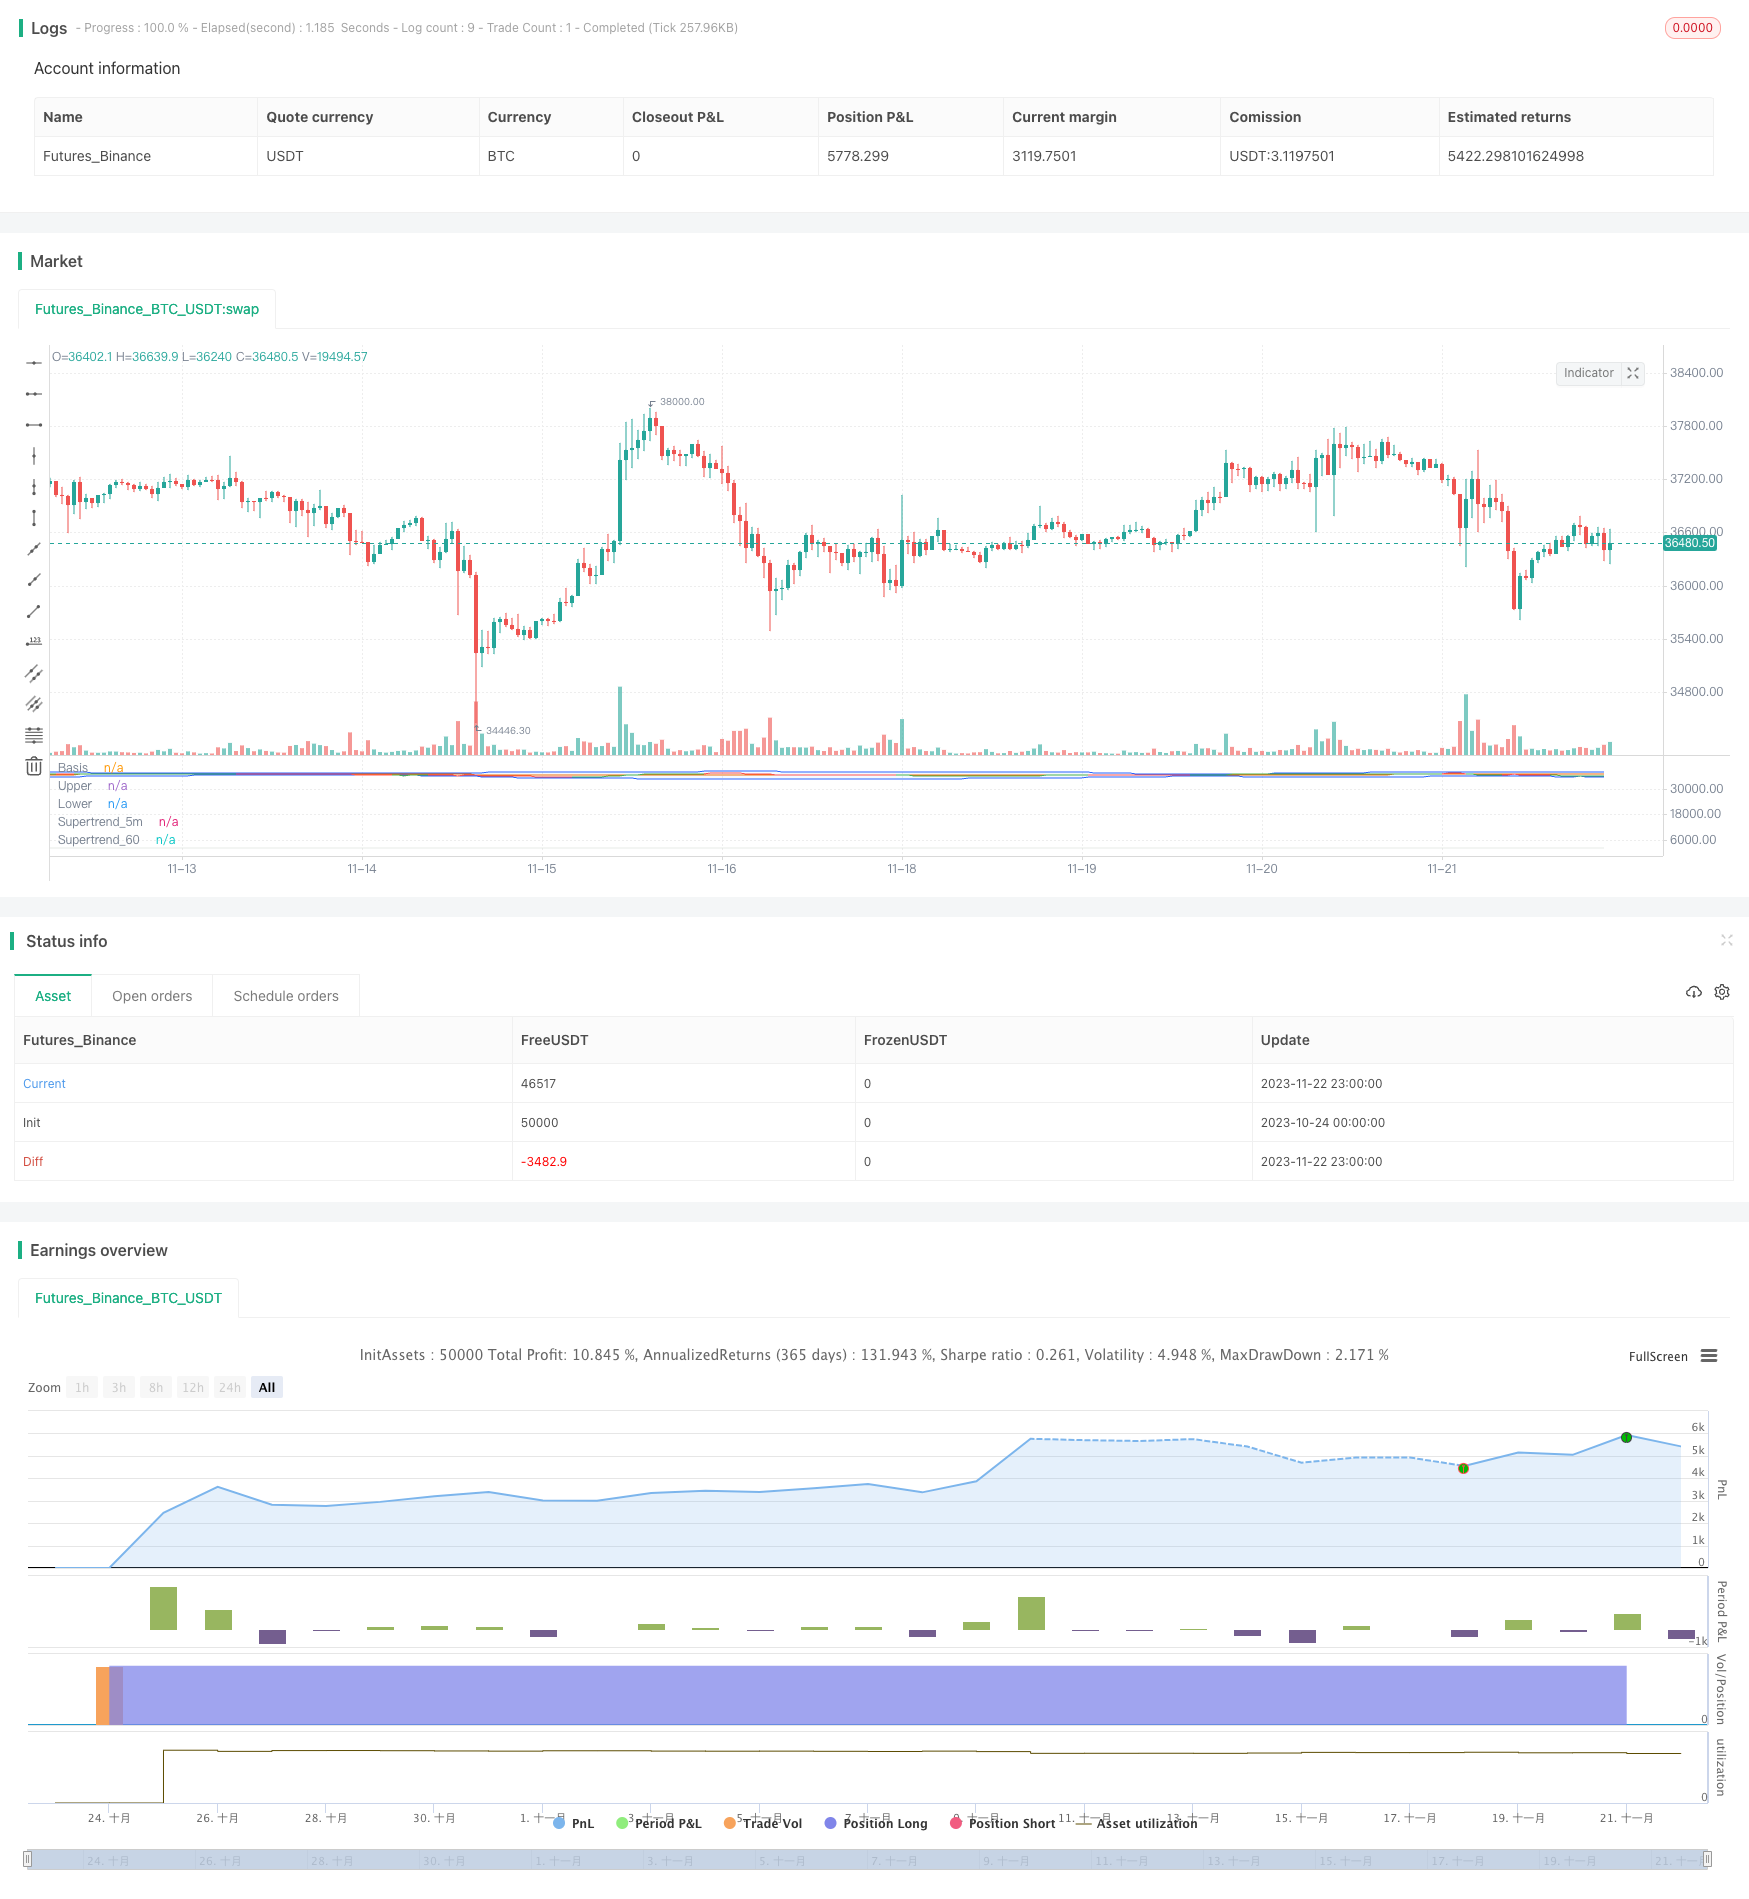
/*backtest
start: 2023-10-24 00:00:00
end: 2023-11-23 00:00:00
period: 1h
basePeriod: 15m
exchanges: [{"eid":"Futures_Binance","currency":"BTC_USDT"}]
*/

// This source code is subject to the terms of the Mozilla Public License 2.0 at https://mozilla.org/MPL/2.0/
// © ambreshc95

//@version=5
strategy("Comodity_SPL_Strategy_01", overlay=false)

// function of st
// [supertrend, direction] = ta.supertrend(3, 10)
// plot(direction < 0 ? supertrend : na, "Up direction", color = color.green, style=plot.style_linebr)
// plot(direction > 0 ? supertrend : na, "Down direction", color = color.red, style=plot.style_linebr)

// VWAP
// src_vwap = input(title = "Source", defval = hlc3, group="VWAP Settings")
// [_Vwap,stdv,_] = ta.vwap(src_vwap,false,1)
// plot(_Vwap, title="VWAP", color = color.rgb(0, 0, 0))


// The same on Pine Script®
pine_supertrend(factor, atrPeriod,len_ma) =>

    h= ta.sma(high,len_ma)
    l= ta.sma(low,len_ma)
    hlc_3 = (h+l)/2
    src = hlc_3
    atr = ta.atr(atrPeriod)
    upperBand = src + factor * atr
    lowerBand = src - factor * atr
    prevLowerBand = nz(lowerBand[1])
    prevUpperBand = nz(upperBand[1])

    lowerBand := lowerBand > prevLowerBand or close[1] < prevLowerBand ? lowerBand : prevLowerBand
    upperBand := upperBand < prevUpperBand or close[1] > prevUpperBand ? upperBand : prevUpperBand
    int direction = na
    float superTrend = na
    prevSuperTrend = superTrend[1]
    if na(atr[1])
        direction := 1
    else if prevSuperTrend == prevUpperBand
        direction := close > upperBand ? -1 : 1
    else
        direction := close < lowerBand ? 1 : -1
    superTrend := direction == -1 ? lowerBand : upperBand
    [superTrend, direction]
len_ma_given = input(75, title="MA_SMA_ST")
[Pine_Supertrend, pineDirection] = pine_supertrend(3, 10,len_ma_given)
// plot(pineDirection < 0 ? Pine_Supertrend : na, "Up direction", color = color.green, style=plot.style_linebr)
// plot(pineDirection > 0 ? Pine_Supertrend : na, "Down direction", color = color.red, style=plot.style_linebr)
//
// Define Supertrend parameters
atrLength = input(10, title="ATR Length")
factor = input(3.0, title="Factor")

// // Calculate Supertrend
[supertrend, direction] = ta.supertrend(factor, atrLength)

st_color = supertrend > close ? color.red : color.green
// // Plot Supertrend
// plot(supertrend, "Supertrend", st_color)
//

// BB Ploting
length = input.int(75, minval=1)
maType = input.string("SMA", "Basis MA Type", options = ["SMA", "EMA", "SMMA (RMA)", "WMA", "VWMA"])
src = input(close, title="Source")
mult = input.float(2.5, minval=0.001, maxval=50, title="StdDev")

ma(source, length, _type) =>
    switch _type
        "SMA" => ta.sma(source, length)
        "EMA" => ta.ema(source, length)
        "SMMA (RMA)" => ta.rma(source, length)
        "WMA" => ta.wma(source, length)
        "VWMA" => ta.vwma(source, length)

basis = ma(src, length, maType)
dev = mult * ta.stdev(src, length)
upper = basis + dev
lower = basis - dev
offset = input.int(0, "Offset", minval = -500, maxval = 500)
plot(basis, "Basis", color=#FF6D00, offset = offset)
p1 = plot(upper, "Upper", color=#2962FF, offset = offset)
p2 = plot(lower, "Lower", color=#2962FF, offset = offset)
fill(p1, p2, title = "Background", color=color.rgb(33, 150, 243, 95))


// h= ta.sma(high,60)
// l= ta.sma(low,60)
// c= sma(close,60)
// hlc_3 = (h+l)/2
// supertrend60 = request.security(syminfo.tickerid,  supertrend)

// // Define timeframes for signals
tf1 = input(title="Timeframe 1", defval="1")
tf2 = input(title="Timeframe 2",defval="5")
// tf3 = input(title="Timeframe 3",defval="30")


// // // Calculate Supertrend on multiple timeframes
supertrend_60 = request.security(syminfo.tickerid, tf1, Pine_Supertrend)
supertrend_5m = request.security(syminfo.tickerid, tf2, supertrend)
// supertrend3 = request.security(syminfo.tickerid, tf3, supertrend)

// // Plot Supertrend_60
st_color_60 = supertrend_60 > close ? color.rgb(210, 202, 202, 69) : color.rgb(203, 211, 203, 52)
plot(supertrend_60, "Supertrend_60", st_color_60)

// // Plot Supertrend_5m
st_color_5m = supertrend_5m > close ? color.red : color.green
plot(supertrend_5m, "Supertrend_5m", st_color_5m)


ma21 = ta.sma(close,21)
// rsi = ta.rsi(close,14)
// rsima = ta.sma(rsi,14)

// Define the Indian Standard Time (IST) offset from GMT
ist_offset = 5.5 // IST is GMT+5:30

// Define the start and end times of the trading session in IST
// start_time = timestamp("GMT", year, month, dayofmonth, 10, 0) + ist_offset * 60 * 60
// end_time = timestamp("GMT", year, month, dayofmonth, 14, 0) + ist_offset * 60 * 60
// Check if the current time is within the trading session
// in_trading_session = timenow >= start_time and timenow <= end_time

in_trading_session = not na(time(timeframe.period, "0945-1430"))
// bgcolor(inSession ? color.silver : na)
out_trading_session = not na(time(timeframe.period, "1515-1530"))
// // // Define buy and sell signals
buySignal = close>upper and close > supertrend_5m and close > supertrend_60 and close > ma21  and in_trading_session //close > supertrend and
sellSignal = close<lower and close < supertrend_5m and close < supertrend_60 and close < ma21  and in_trading_session //close < supertrend and

var bool long_position = false
var bool long_exit = false
var float long_entry_price = 0
var float short_entry_price = 0

if buySignal and not long_position
    // label.new(bar_index, na, yloc = yloc.belowbar, style = label.style_label_up, color = color.green, size = size.small)
    long_position := true
    strategy.entry("Buy",strategy.long)

long_exit := (close < supertrend_5m)
if long_position and long_exit
    // label.new(bar_index, na, yloc = yloc.belowbar, style = label.style_xcross, color = color.green, size = size.tiny)
    long_position := false
    strategy.exit("Exit","Buy",stop = close)

var bool short_position = false
var bool short_exit = false
if sellSignal and not short_position
    // label.new(bar_index, na, yloc = yloc.abovebar, style = label.style_label_down, color = color.red, size = size.small)
    short_position := true
    strategy.entry("Sell",strategy.short)

short_exit := (close > supertrend_5m)
if short_position and short_exit
    // label.new(bar_index, na, yloc = yloc.belowbar, style = label.style_xcross, color = color.red, size = size.tiny)
    short_position := false
    strategy.exit("Exit","Sell", stop = close)

if out_trading_session
    long_position := false
    strategy.exit("Exit","Buy",stop = close)
    short_position := false
    strategy.exit("Exit","Sell", stop = close)

// if long_position
//     long_entry_price := close[1] + 50//bar_index

// if short_position
//     short_entry_price := close[1] - 50//bar_index

// if (long_position and high[1] > long_entry_price)
//     label.new(bar_index, na, yloc = yloc.abovebar, style = label.style_triangledown, color = color.yellow, size = size.tiny)

// if (short_position and low[1] < short_entry_price)
//     label.new(bar_index, na, yloc = yloc.belowbar, style = label.style_triangleup, color = color.yellow, size = size.tiny)