धैर्यपूर्वक प्रवृत्ति-अनुसरण रणनीति का पालन करें
अवलोकन
धैर्य ट्रेंड ट्रैकिंग रणनीति एक ट्रेंड फॉलोइंग रणनीति है। यह चलती औसत के संकेतकों के संयोजन का उपयोग करके प्रवृत्ति की दिशा का निर्धारण करती है, और ओवरबॉट ओवरसोल संकेतक सीसीआई के साथ मिलकर एक व्यापारिक संकेत देती है। यह रणनीति बड़ी प्रवृत्ति का पीछा करती है, जो अस्थिरता के दौरान प्रभावी रूप से पिच से बच सकती है।
रणनीति सिद्धांत
यह रणनीति 21 चक्र और 55 चक्र के ईएमए के संयोजन का उपयोग करती है ताकि यह पता लगाया जा सके कि रुझान किस दिशा में है। जब अल्पकालिक ईएमए लंबी अवधि के ईएमए के ऊपर होता है, तो इसे एक उछाल के रूप में परिभाषित किया जाता है, और जब अल्पकालिक ईएमए लंबी अवधि के ईएमए के नीचे होता है, तो इसे एक गिरावट के रूप में परिभाषित किया जाता है।
सीसीआई सूचकांक का उपयोग ओवरबॉय ओवरसोल को समझने के लिए किया जाता है। सीसीआई के ऊपर -100 लाइन के माध्यम से नीचे के ओवरबॉय सिग्नल के लिए, नीचे -100 लाइन के माध्यम से शीर्ष ओवरबॉय सिग्नल के लिए। सीसीआई सूचकांक के विभिन्न ओवरबॉय ओवरसोल लाइनों के अनुसार, रणनीति को तीन ट्रेडिंग सिग्नल की ताकत के स्तर में विभाजित किया गया है।
यदि यह एक उछाल है, तो यदि सीसीआई सूचक एक मजबूत ओवरबॉट सिग्नल भेजता है, तो एक ओवरहेड प्रविष्टि की जाती है। यदि यह एक गिरावट है, तो एक ओवरहेड प्रविष्टि की जाती है।
स्टॉप-लॉस लाइन को सुपरट्रेंड सूचक के रूप में सेट किया गया है और लक्ष्य लाभ को एक निश्चित संख्या में सेट किया गया है।
श्रेष्ठता विश्लेषण
इस रणनीति के मुख्य फायदे हैंः
- ट्रेंड को ट्रैक करें और फंसने से बचें
- सीसीआई सूचकांक एक प्रभावी रूप से टर्नओवर बिंदु का आकलन कर सकता है
- सुपरट्रेंड स्टॉप लॉस सेट करना उचित है
- फिक्स्ड स्टॉप लॉस और फिक्स्ड स्टॉप रोल, नियंत्रित जोखिम
जोखिम विश्लेषण
इस रणनीति में मुख्य रूप से निम्नलिखित जोखिम हैं:
- प्रवृत्ति में गलतफहमी की संभावना
- CCI सूचकांक में झूठे संकेतों की संभावना
- अनावश्यक क्षति की संभावना के लिए स्टॉप पॉइंट बहुत कम या बहुत गहरा
- स्थिर स्टॉप ट्रेंड को लगातार ट्रैक करने में असमर्थता की संभावना
इन जोखिमों के लिए, हम ईएमए चक्र पैरामीटर, सीसीआई पैरामीटर और स्टॉप लॉस स्टॉप पॉइंट बिट्स को समायोजित करके अनुकूलित कर सकते हैं। साथ ही, रणनीतिक संकेत सत्यापन के लिए अधिक संकेतकों को पेश करना आवश्यक है।
अनुकूलन दिशा
इस रणनीति के अनुकूलन के मुख्य पहलू हैंः
अधिक सूचकांक के संयोजन का परीक्षण करें, बेहतर प्रवृत्ति निर्णय और संकेत सत्यापन सूचकांक की तलाश करें।
एटीआर डायनामिक स्टॉप लॉस स्टॉप का उपयोग करें ताकि रुझानों को बेहतर तरीके से ट्रैक किया जा सके और जोखिमों को नियंत्रित किया जा सके।
प्रवृत्ति की संभावना का आकलन करने के लिए ऐतिहासिक डेटा प्रशिक्षण पर आधारित मशीन सीखने के मॉडल को पेश करना।
विभिन्न किस्मों के पैरामीटर के लिए अनुकूलन अनुकूलन।
संक्षेप
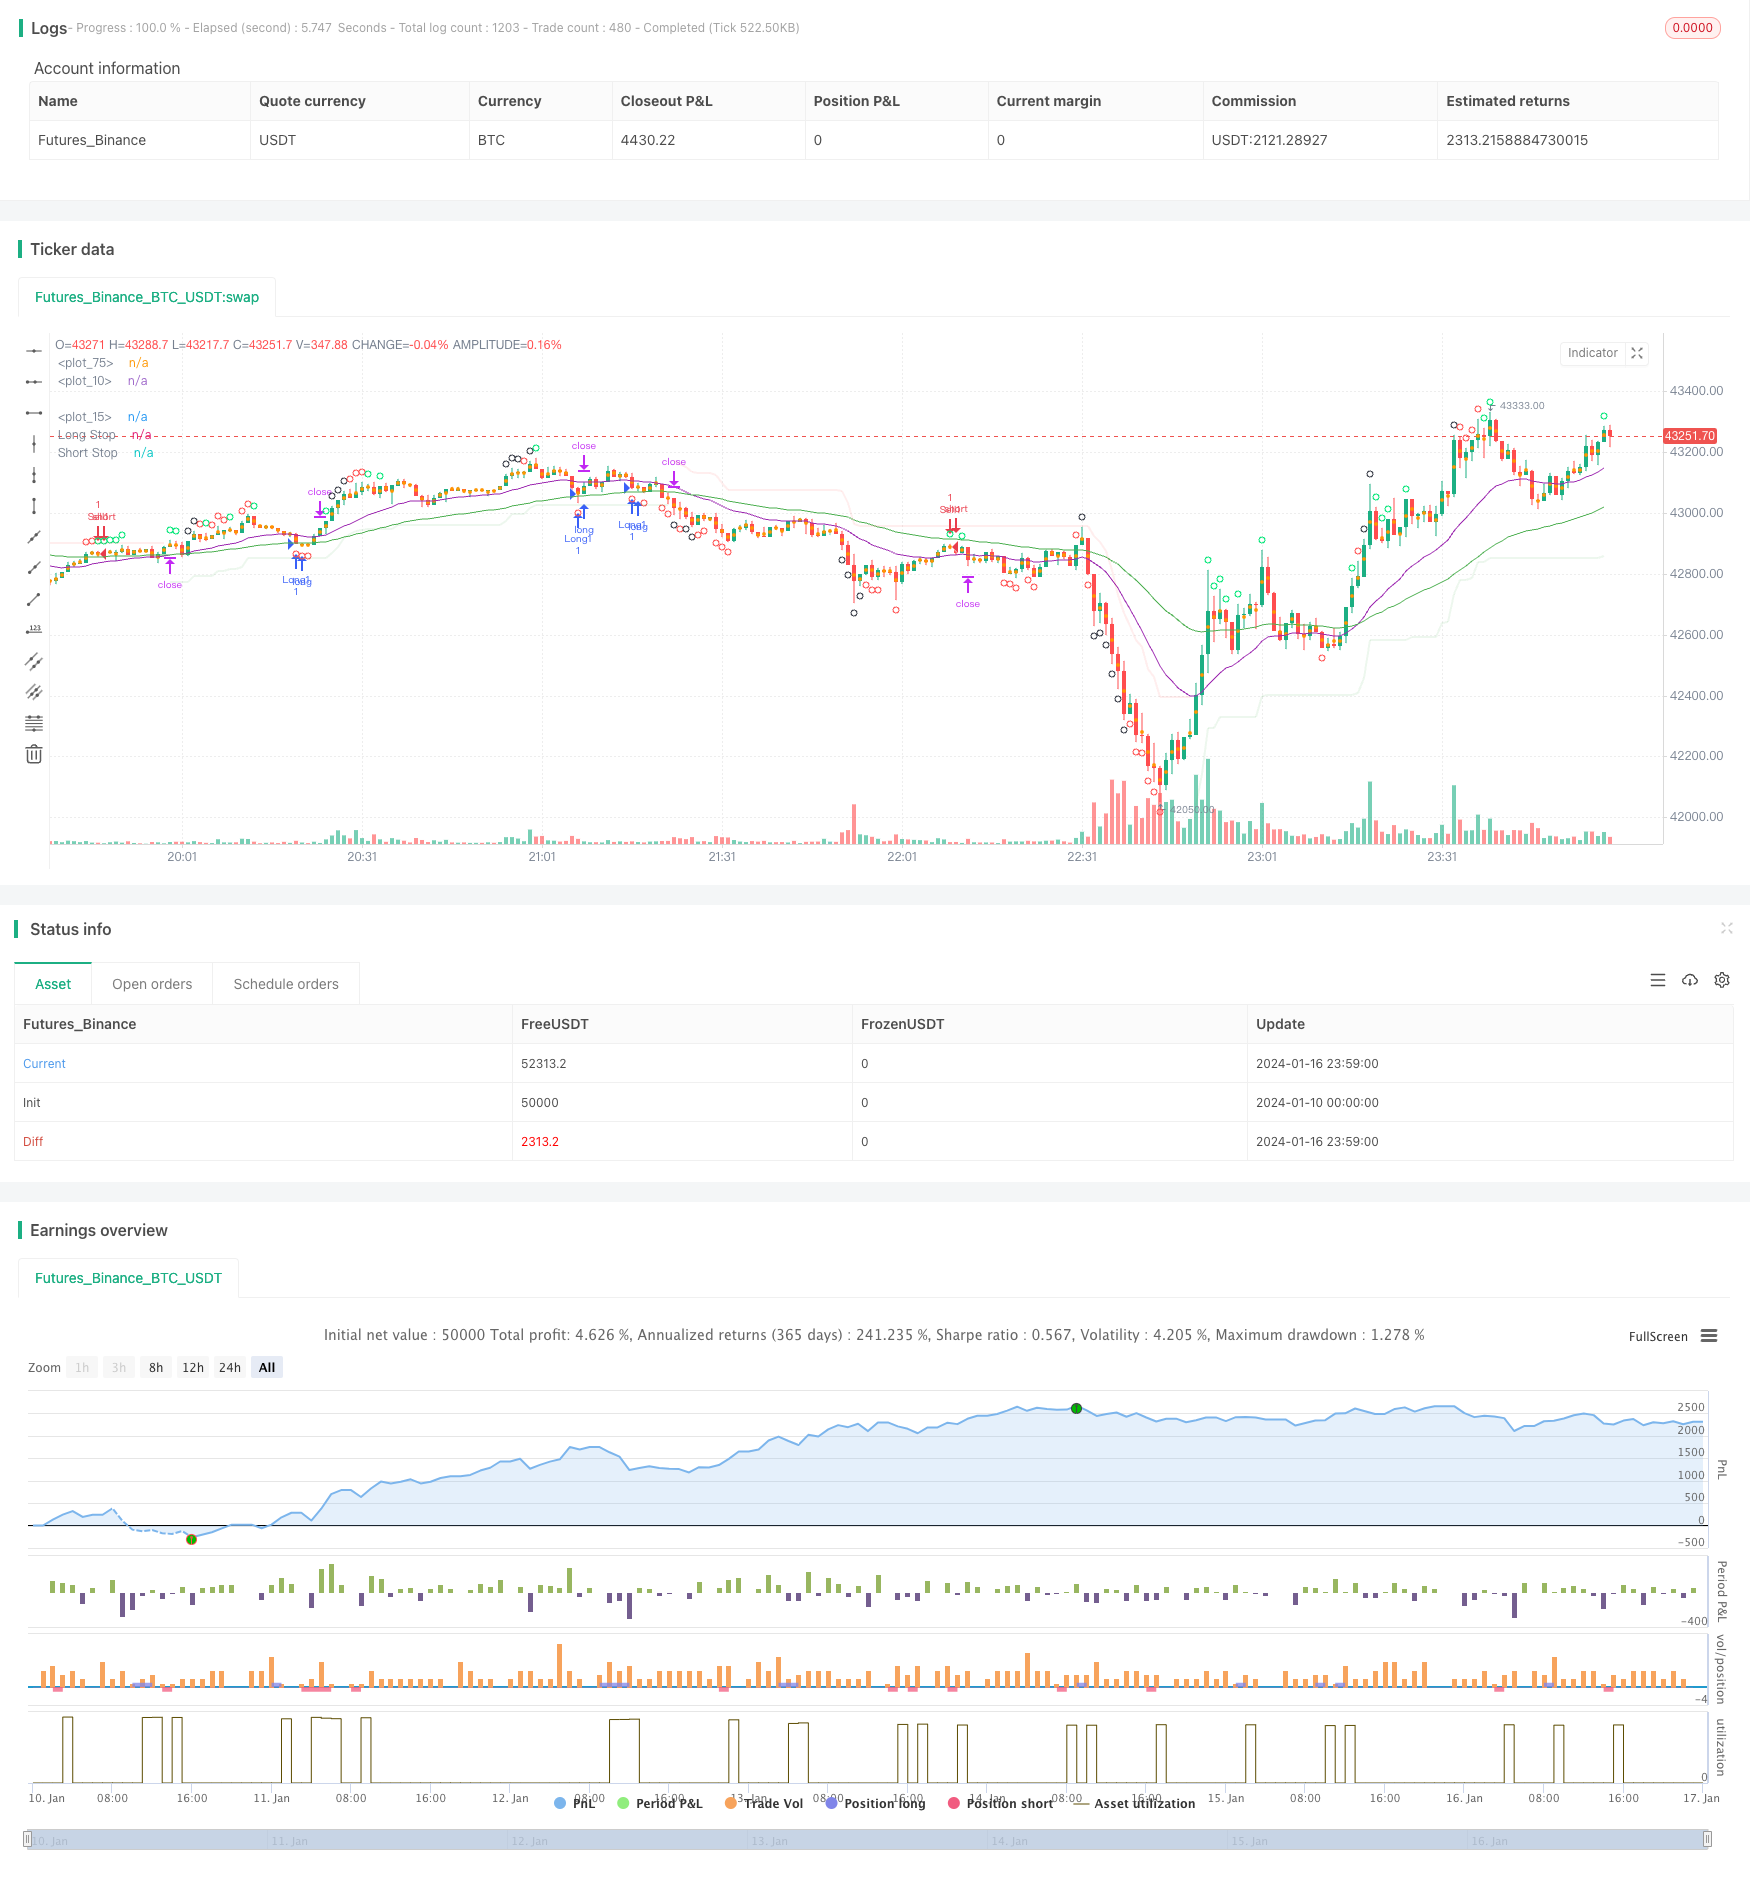
धैर्य ट्रेंड ट्रैकिंग रणनीति समग्र रूप से एक बहुत ही व्यावहारिक प्रवृत्ति का पालन करने की रणनीति है। यह एक बड़ी प्रवृत्ति की दिशा का आकलन करने के लिए एक चलती औसत का उपयोग करता है, सीसीआई संकेतक एक उलटा बिंदु सिग्नल का पता लगाता है, और सुपर ट्रेंड स्टॉपलाइन को स्थापित करना उचित है। पैरामीटर समायोजन और बहु-संकेतक संयोजन सत्यापन के माध्यम से, इस रणनीति को और अधिक अनुकूलित किया जा सकता है, जो लंबे समय तक वास्तविक स्टॉक ट्रैकिंग सत्यापन के लायक है।
/*backtest
start: 2024-01-10 00:00:00
end: 2024-01-17 00:00:00
period: 1m
basePeriod: 1m
exchanges: [{"eid":"Futures_Binance","currency":"BTC_USDT"}]
*/

// This source code is subject to the terms of the Mozilla Public License 2.0 at https://mozilla.org/MPL/2.0/
// © greenmask9

//@version=4
strategy("Patient Trendfollower (7) Strategy", overlay=true)

// 21 EMA
emalength = input(21, title="Short EMA")
emashort = ema(close, emalength)
plot(emashort, color = color.purple, linewidth=1)

// 55 EMA
emalength2 = input(55, title="Long EMA")
ema = ema(close, emalength2)
plot(ema, color = color.green, linewidth=1)

//CCI calculation and inputs
lengthcci = input(20, minval=1, title="Overbought/sold detector period")
src = input(close, title="Overbought/sold detector source")
ma = sma(src, lengthcci)
ccivalue = (src - ma) / (0.015 * dev(src, lengthcci))


//CCI plotting
ccioverbought = input(defval=100, title="Overbought level 1")
ccioverbought2 = input(defval=140, title="Overbought level 2")
ccioverbought3 = input(defval=180, title="Overbought level 3")

ccioversold = input(defval=-100, title="Oversold level 1")
ccioversold2 = input(defval=-140, title="Oversold level 2")
ccioversold3 = input(defval=-180, title="Oversold level 3")

cciOB = (ccivalue >= ccioverbought and ccivalue < ccioverbought2)
plotshape(cciOB,  title= "Overbought", location=location.abovebar, color=color.lime, transp=0, style=shape.circle)
cciOS = (ccivalue <= ccioversold and ccivalue > ccioversold2)
plotshape(cciOS, title= "Oversold", location=location.belowbar, color=color.lime, transp=0, style=shape.circle)

cciOB2 = (ccivalue >= ccioverbought2 and ccivalue < ccioverbought3)
plotshape(cciOB2,  title= "Overbought", location=location.abovebar, color=color.red, transp=0, style=shape.circle)
cciOS2 = (ccivalue <= ccioversold and ccivalue > ccioversold3)
plotshape(cciOS2, title= "Oversold", location=location.belowbar, color=color.red, transp=0, style=shape.circle)

cciOB3 = (ccivalue >= ccioverbought3)
plotshape(cciOB3,  title= "Overbought", location=location.abovebar, color=color.black, transp=0, style=shape.circle)
cciOS3 = (ccivalue <= ccioversold3)
plotshape(cciOS3, title= "Oversold", location=location.belowbar, color=color.black, transp=0, style=shape.circle)

//Supertrend

length = input(title="ATR Period", type=input.integer, defval=55)
mult = input(title="ATR Multiplier", type=input.float, step=0.1, defval=5.0)
wicks = input(title="Take Wicks into Account ?", type=input.bool, defval=true)
illuminate = input(title="Illuminate Trend", type=input.bool, defval=true)

atr = mult * atr(length)

longStop = hl2 - atr
longStopPrev = nz(longStop[1], longStop)
longStop := (wicks ? low[1] : close[1]) > longStopPrev ? max(longStop, longStopPrev) : longStop

shortStop = hl2 + atr
shortStopPrev = nz(shortStop[1], shortStop)
shortStop := (wicks ? high[1] : close[1]) < shortStopPrev ? min(shortStop, shortStopPrev) : shortStop

dir = 1
dir := nz(dir[1], dir)
dir := dir == -1 and (wicks ? high : close) > shortStopPrev ? 1 : dir == 1 and (wicks ? low : close) < longStopPrev ? -1 : dir

longColor = color.new(color.green, 90)
shortColor = color.new(color.red, 90)
noneColor = color.new(color.white, 100)

longStopPlot = plot(dir == 1 ? longStop : na, title="Long Stop", style=plot.style_linebr, linewidth=2, color=longColor)
shortStopPlot = plot(dir == 1 ? na : shortStop, title="Short Stop", style=plot.style_linebr, linewidth=2, color=shortColor)
midPricePlot = plot(ohlc4, title="", style=plot.style_circles, linewidth=0)

longFillColor = illuminate ? (dir == 1 ? longColor : noneColor) : noneColor
shortFillColor = illuminate ? (dir == -1 ? shortColor : noneColor) : noneColor
fill(midPricePlot, longStopPlot, title="Long State Filling", color=longFillColor)
fill(midPricePlot, shortStopPlot, title="Short State Filling", color=shortFillColor)

//entries
uptrend = emashort>ema and dir == 1
upsignal = ccivalue<=ccioversold and ccivalue>ccioversold2
upsignal2 = ccivalue<=ccioversold2 and ccivalue>ccioversold3
upsignal3 = ccivalue<=ccioversold3
downtrend = emashort<ema and dir == -1
downsignal = ccivalue>=ccioverbought and ccivalue<ccioverbought2
downsignal2 = ccivalue>=ccioverbought2 and ccivalue<ccioverbought3
downsignal3 = ccivalue>=ccioverbought3

//adapts to the current bar, I need to save the bars number when the condition for buy was true, static number is spread
spread = input (0.00020, title="Spread")
upstoploss = longStop - spread
downstoploss = shortStop + spread
strategy.initial_capital = 50000
ordersize=floor(strategy.initial_capital/close)
testlong = input(title="Test longs", type=input.bool, defval=true)
testshort = input(title="Test shorts", type=input.bool, defval=true)
//new
degree = input(title="Test level 1 overbought/sold levels", type=input.bool, defval=true)
degree2 = input(title="Test level 2 overbought/sold levels", type=input.bool, defval=false)
degree3 = input(title="Test level 3 overbought/sold levels", type=input.bool, defval=false)

statictarget = input(title="Use static target", type=input.bool, defval=true)
statictargetvalue = input(title="Static target in pips", type=input.integer, defval=400)

//timetrade = input(title="Open trades only withing specified time", type=input.bool, defval=true)
//timtrade = input()

//přidat možnost TP podle ATR a sl podle ATR
buy1 = uptrend and upsignal and strategy.opentrades==0 and testlong and degree
x1 = barssince (buy1)
if (buy1)
//bodlo by zakázat atrtarget v tomto případě
    if (statictarget)
        strategy.entry("Long1", strategy.long, ordersize)
        strategy.exit( "Exitlong", from_entry="Long1" , profit=statictargetvalue,stop=upstoploss[x1])

buy2 = uptrend and upsignal2 and strategy.opentrades==0 and testlong and degree2
x2 = barssince (buy2)
if (buy2)
//bodlo by zakázat atrtarget v tomto případě
    if (statictarget)
        strategy.entry("Long2", strategy.long, ordersize)
        strategy.exit( "Exitlong", from_entry="Long2" , profit=statictargetvalue,stop=upstoploss[x2])

buy3 = uptrend and upsignal3 and strategy.opentrades==0 and testlong and degree3
x3 = barssince (buy3)
if (buy3)
//bodlo by zakázat atrtarget v tomto případě
    if (statictarget)
        strategy.entry("Long3", strategy.long, ordersize)
        strategy.exit( "Exitlong", from_entry="Long3" , profit=statictargetvalue,stop=upstoploss[x3])

sell1 = downtrend and downsignal and strategy.opentrades==0 and testshort and degree
y1 = barssince (sell1)
if (sell1)
    if (statictarget)
        strategy.entry("Sell1", strategy.short, ordersize)
        strategy.exit( "Exitshort", from_entry="Sell1" , profit=statictargetvalue,stop=downstoploss[y1])

sell2 = downtrend and downsignal2 and strategy.opentrades==0 and testshort and degree2
y2 = barssince (sell2)
if (sell2)
    if (statictarget)
        strategy.entry("Sell2", strategy.short, ordersize)
        strategy.exit( "Exitshort", from_entry="Sell2" , profit=statictargetvalue,stop=downstoploss[y2])

sell3 = downtrend and downsignal3 and strategy.opentrades==0 and testshort and degree3
y3 = barssince (sell3)
if (sell3)
    if (statictarget)
        strategy.entry("Sell3", strategy.short, ordersize)
        strategy.exit( "Exitshort", from_entry="Sell3" , profit=statictargetvalue,stop=downstoploss[y3])