Bollinger + RSI, Strategi Ganda v1.1
Penulis:ChaoZhang, Tanggal: 2022-05-07 14:59:50Tag:RSI
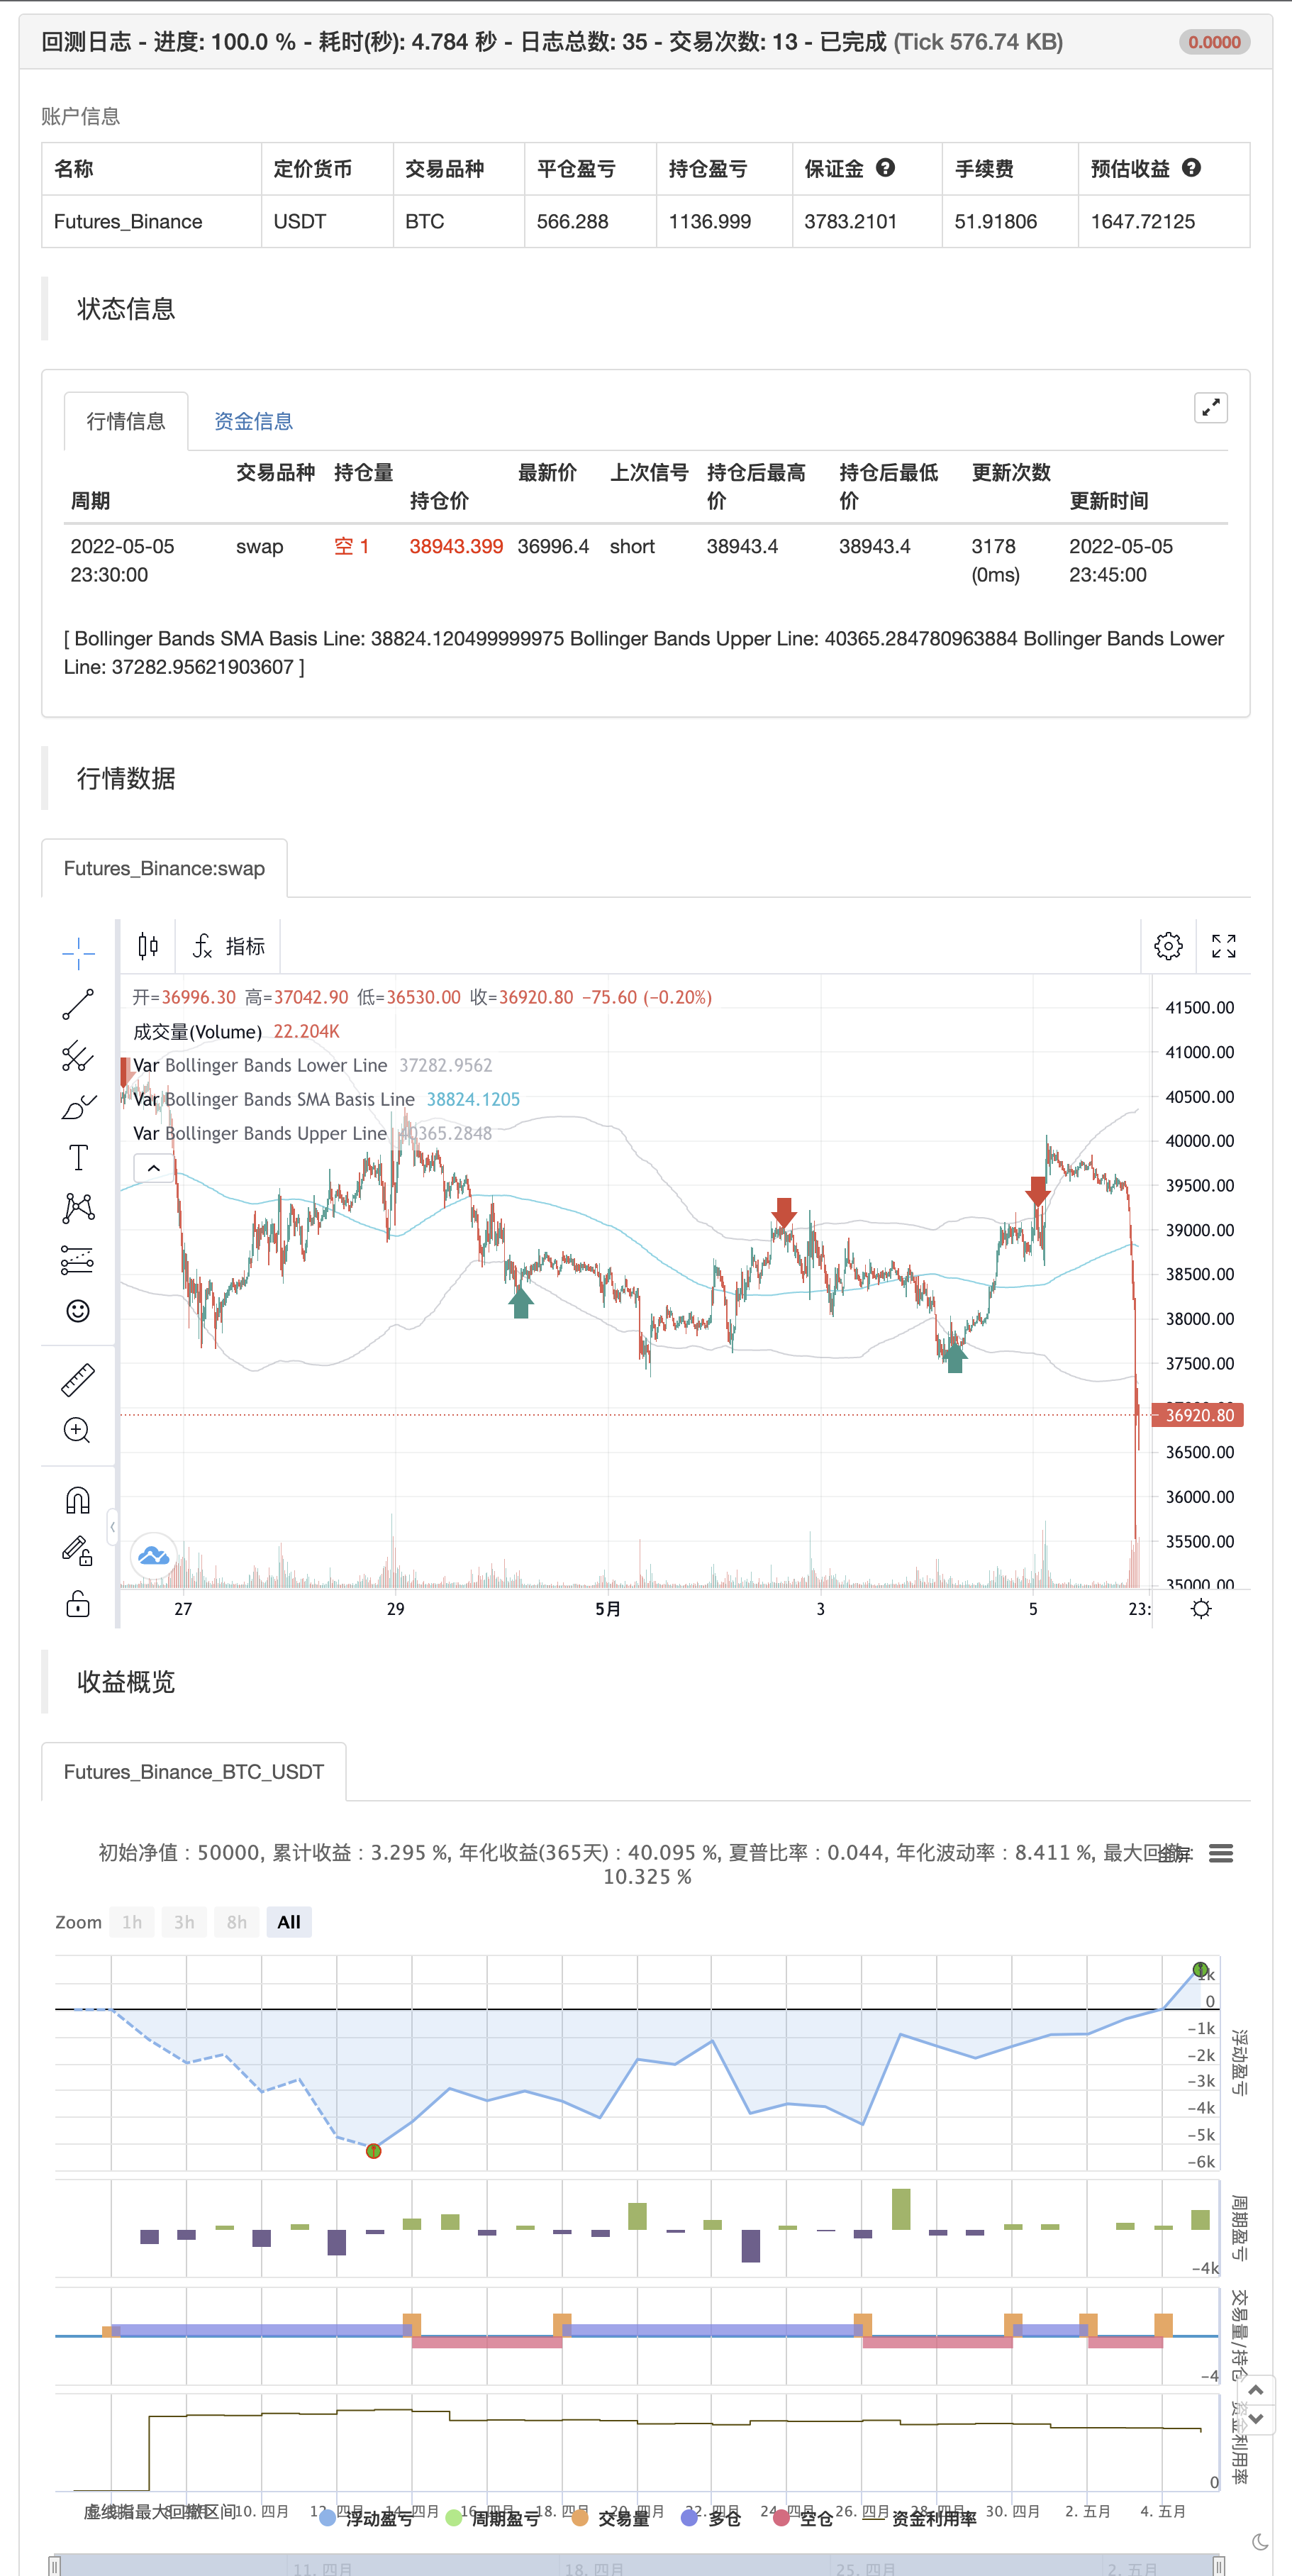
Strategi ini menggunakan indikator RSI bersama dengan Bollinger Bands untuk menjual ketika harga berada di atas Bollinger Band atas (dan untuk membeli ketika nilai ini berada di bawah band bawah).
UPDATEDalam versi 1.1 yang diperbarui ini, strategi telah disederhanakan untuk pengguna (kurang input) dan dibuat lebih sukses dalam backtesting dengan sekarang menggunakan periode 200 untuk SMA yang merupakan dasar untuk Bollinger Band.
Dan sama seperti versi pertama strategi ini tidak menggunakan harga penutupan dari kerangka waktu yang lebih tinggi dan seharusnya tidak diwarnai kembali setelah lilin saat ini ditutup.
Semua perdagangan melibatkan risiko tinggi; kinerja masa lalu tidak selalu menunjukkan hasil masa depan. Hasil kinerja hipotetis atau simulasi memiliki keterbatasan inheren tertentu. Tidak seperti catatan kinerja yang sebenarnya, hasil simulasi tidak mewakili perdagangan yang sebenarnya. Juga, karena perdagangan tidak benar-benar dilaksanakan, hasilnya mungkin kurang atau terlalu dikompensasi untuk dampak, jika ada, dari faktor pasar tertentu, seperti kurangnya likuiditas. Program perdagangan simulasi pada umumnya juga tunduk pada fakta bahwa mereka dirancang dengan manfaat dari hindsight. Tidak ada representasi yang dibuat bahwa setiap akun akan atau cenderung mencapai keuntungan atau kerugian yang mirip dengan yang ditunjukkan.
P.S. Untuk pengguna lanjutan jika Anda ingin mengakses lebih banyak fungsi dari skrip strategi ini, maka silakan gunakan versi 1.0:Pengamatan
/*backtest
start: 2022-04-06 00:00:00
end: 2022-05-05 23:59:00
period: 15m
basePeriod: 5m
exchanges: [{"eid":"Futures_Binance","currency":"BTC_USDT"}]
*/

//@version=2
strategy("Bollinger + RSI, Double Strategy (by ChartArt) v1.1", shorttitle="CA_-_RSI_Bol_Strat_1.1", overlay=true)

// ChartArt's RSI + Bollinger Bands, Double Strategy - Update
//
// Version 1.1
// Idea by ChartArt on January 18, 2015.
//
// This strategy uses the RSI indicator
// together with the Bollinger Bands
// to sell when the price is above the
// upper Bollinger Band (and to buy when
// this value is below the lower band).
//
// This simple strategy only triggers when
// both the RSI and the Bollinger Bands
// indicators are at the same time in
// a overbought or oversold condition.
//
// In this version 1.1 the strategy was
// both simplified for the user and
// made more successful in backtesting.
//
// List of my work:
// https://www.tradingview.com/u/ChartArt/
//
//  __             __  ___       __  ___
// /  ` |__|  /\  |__)  |   /\  |__)  |
// \__, |  | /~~\ |  \  |  /~~\ |  \  |
//
//


///////////// RSI
RSIlength = input(6,title="RSI Period Length")
RSIoverSold = 50
RSIoverBought = 50
price = close
vrsi = rsi(price, RSIlength)


///////////// Bollinger Bands
BBlength = input(200, minval=1,title="Bollinger Period Length")
BBmult = 2 // input(2.0, minval=0.001, maxval=50,title="Bollinger Bands Standard Deviation")
BBbasis = sma(price, BBlength)
BBdev = BBmult * stdev(price, BBlength)
BBupper = BBbasis + BBdev
BBlower = BBbasis - BBdev
source = close
buyEntry = crossover(source, BBlower)
sellEntry = crossunder(source, BBupper)
plot(BBbasis, color=aqua,title="Bollinger Bands SMA Basis Line")
p1 = plot(BBupper, color=silver,title="Bollinger Bands Upper Line")
p2 = plot(BBlower, color=silver,title="Bollinger Bands Lower Line")
//fill(p1, p2)


///////////// Colors
switch1=input(true, title="Enable Bar Color?")
switch2=input(true, title="Enable Background Color?")
TrendColor = RSIoverBought and (price[1] > BBupper and price < BBupper) and BBbasis < BBbasis[1] ? red : RSIoverSold and (price[1] < BBlower and price > BBlower) and BBbasis > BBbasis[1] ? green : na
///barcolor(switch1?TrendColor:na)
//bgcolor(switch2?TrendColor:na,transp=50)


///////////// RSI + Bollinger Bands Strategy
if (not na(vrsi))

    if (crossover(vrsi, RSIoverSold) and crossover(source, BBlower))
        strategy.entry("RSI_BB_L", strategy.long, stop=BBlower,  comment="RSI_BB_L")

    if (crossunder(vrsi, RSIoverBought) and crossunder(source, BBupper))
        strategy.entry("RSI_BB_S", strategy.short, stop=BBupper,  comment="RSI_BB_S")

//plot(strategy.equity, title="equity", color=red, linewidth=2, style=areabr)
- MACD RSI Ichimoku Momentum Trend Mengikuti Strategi Panjang
- Strategi Perubahan Arah RSI
- Strategi Perdagangan RSI Bollinger Bands yang Ditingkatkan
- Strategi Pivot dan Momentum
- Rata-rata bergerak dan strategi perdagangan RSI yang komprehensif
- Strategi Kembali Selasa (Filter Akhir Pekan)
- Strategi Crossover EMA yang ditingkatkan dengan RSI/MACD/ATR
- Strategi perdagangan jangka panjang gabungan MACD dan RSI
- RSI2 Strategi Intraday Reversal Win Rate Backtest
- Tren Multi-Indikator Mengikuti Strategi
- Strategi Perdagangan AlphaTradingBot
- baguette dengan multigrain
- MillMachine
- Indikator pembalikan K I
- Lilin yang Menelan
- MA Kaisar Insiliconot
- Titik Pembalikan Demark
- Swing Highs/Lows & Pola Lilin
- TMA Overlay
- Strategi MACD + SMA 200
- Sistem CM Sling Shot
- Strategi Bollinger Bands
- Optimized Trend Tracker
- Pengembalian bulanan dalam Strategi PineScript
- ADX dan DI untuk v4
- MacD Custom Indicator-Multiple Time Frame+Semua Pilihan Tersedia!
- Indikator: WaveTrend Oscillator
- Indikator Momentum Squeeze
- AlphaTrend
- perdagangan jangka waktu yang berbeda
- Sentiment Oscillator