
Strategi tren flying dragon memungkinkan penilaian tren dan pembuatan sinyal perdagangan dengan menyesuaikan jenis, panjang, dan bias rata-rata bergerak, menggambar pita tren dengan warna yang berbeda. Strategi ini dapat menemukan kombinasi parameter terbaik dalam periode waktu yang berbeda, menyeimbangkan antara akurasi penilaian tren dan risiko perdagangan.
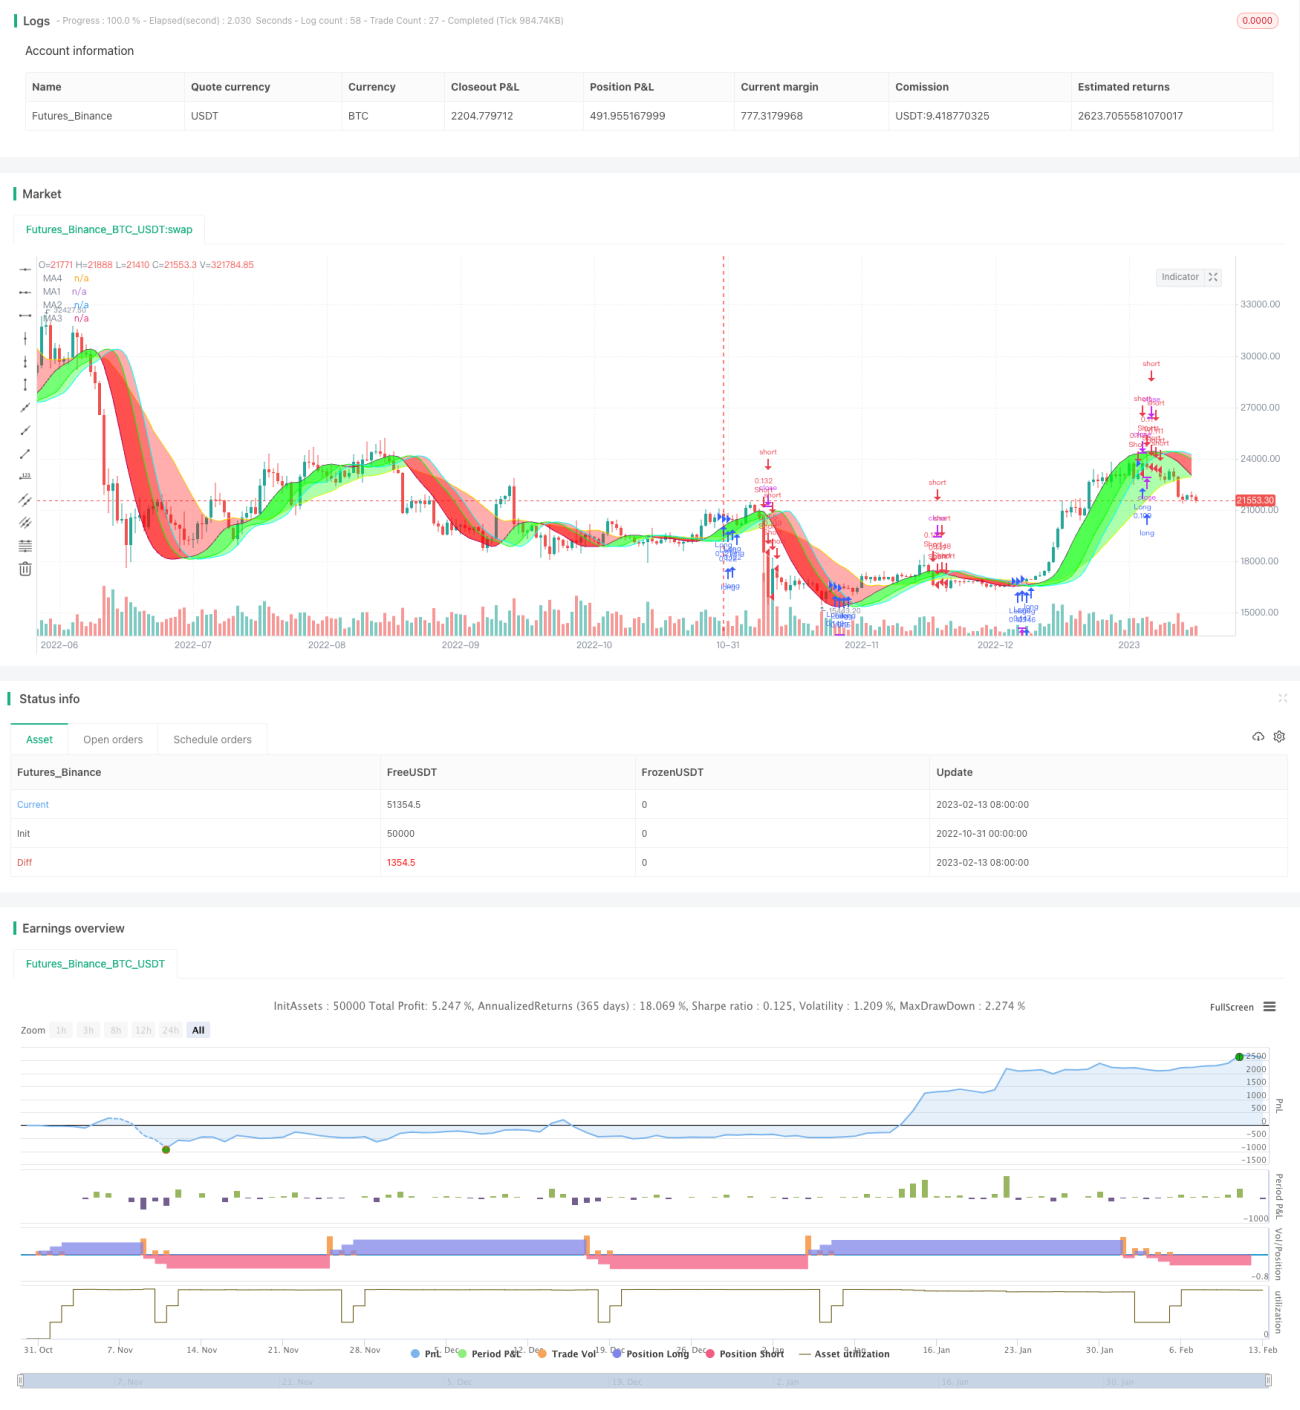
Strategi ini menggunakan dua moving average untuk memetakan zona tren, yang diberi nomor MA1 dan MA4. MA1 adalah moving average cepat, dan MA4 adalah moving average lambat. Sementara itu, MA1 mengatur 3 offset (Offset1, Offset2, Offset3) untuk membentuk MA2 dan MA3.
Pengguna dapat memilih 5 tingkat risiko, di bawah tingkat risiko yang berbeda, melintasi berbagai rata-rata bergerak akan membentuk sinyal perdagangan, risiko dari tinggi ke rendah berurutan: MA1 Offset1, MA2, MA3, MA4, semua warna pita tren konsisten. Warna pita tren menunjukkan arah tren saat ini, hijau untuk tren naik, merah untuk tren turun.
Selain itu, strategi ini memungkinkan penggunaan stop loss dan pilihan untuk melakukan posisi panjang, posisi pendek, atau perdagangan dua arah.
Risiko dapat dikendalikan dan dikurangi dengan menurunkan tingkat risiko secara bertahap, meningkatkan pengujian kombinasi parameter, dan mengoptimalkan parameter untuk varietas yang berbeda.
Strategi tren Fibonacci merancang sistem perdagangan tren yang terlihat dengan kombinasi cerdas dari rata-rata bergerak. Parameter strategi ini sangat disesuaikan, dapat dioptimalkan secara menyeluruh untuk berbagai varietas dan lingkungan pasar, menemukan keseimbangan terbaik antara stabilitas dan sensitivitas. Kombinasi parameter multi-grup memberikan ruang yang cukup untuk pengoptimalan.
/*backtest
start: 2022-10-31 00:00:00
end: 2023-02-14 00:00:00
period: 1d
basePeriod: 1h
exchanges: [{"eid":"Futures_Binance","currency":"BTC_USDT"}]
*/
// This source code is subject to the terms of the Mozilla Public License 2.0 at https://mozilla.org/MPL/2.0/
// © MarkoP010 2023
//@version=5
//The basic idea of the strategy is to select the best set of MAs, types, lenghts and offsets, which draws red trend bands for downtrend (and green for uptrend).
//Strategy executes by selected risk level either when there is MA crossover with price (MA1 Offset1 on Highest risk level, MA2 on Low risk level) or three bands with the same color on at the same time (on Lowest risk level).
//Strategy plots user selectable Moving Average lines and a colored trend band between the MA lines. The trend bands can be turned off individually if required.
//The Offset option shifts the selected MA with the set number of steps to the right. That is where the Magic happens and the Dragon roars!
//Strategy version 1.0
strategy("Flying Dragon Trend Strategy", shorttitle="FD Trend Strategy", overlay=true, pyramiding=3, initial_capital=100000, default_qty_type=strategy.percent_of_equity, default_qty_value=5, commission_type=strategy.commission.cash_per_order, commission_value=10, calc_on_order_fills=false, process_orders_on_close=true)
strDirection = input.string(defval="Both", title="Strategy Direction", options=["Both", "Long", "Short"], group="Strategy") //Strategy direction selector by DashTrader
strSelection = strDirection == "Long" ? strategy.direction.long : strDirection == "Short" ? strategy.direction.short : strategy.direction.all //Strategy direction selector by DashTrader
strategy.risk.allow_entry_in(strSelection)
riskLevel = input.string(defval="Medium", title="Risk Level", options=["Highest", "High", "Medium", "Low", "Lowest"], tooltip="Strategy execution criteria. When Highest then MA1 Offset1 crossover with price, when Low then MA2 Offset crossover, when Lowest then all the Bands are the same color.", group="Strategy")
useStop = input(defval=false, title="Use Stop Loss", inline="SL", group="Strategy")
stopPrct = input.int(defval=10, title=" %", minval=0, maxval=100, step=1, inline="SL", group="Strategy") / 100
//Moving Averages function
MA(source, length, type) =>
type == "EMA" ? ta.ema(source, length) :
type == "HMA" ? ta.hma(source, length) :
type == "RMA" ? ta.rma(source, length) :
type == "SMA" ? ta.sma(source, length) :
type == "SWMA" ? ta.swma(source) :
type == "VWMA" ? ta.vwma(source, length) :
type == "WMA" ? ta.wma(source, length) :
na
//Inputs
ma1Type = input.string(defval="HMA", title="", inline="MA1", options=["EMA", "HMA", "RMA", "SMA","SWMA", "VWMA", "WMA"], group="Leading Moving Average")
ma1Length = input.int(defval=35, title="",minval=1, inline="MA1", group="Leading Moving Average")
ma1Source = input(defval=close, title="", tooltip="For short timeframes, minutes to hours, instead of Default values try Lowest risk level and HMA75 with Offsets 0,1,4 and SMA12 with Offset 6.", inline="MA1", group="Leading Moving Average")
ma1Color = input(defval=color.purple, title="", inline="MA-1", group="Leading Moving Average")
//useMa1Offset = input(defval=false, title="Use offset to MA-1", inline="MA1", group="Leading Moving Average")
ma1Offset = input.int(defval=0, title="Offset1 Steps", minval=0, maxval=10, step=1, tooltip="The Magic happens here! The offset to move the line to the right.", inline="MA-1", group="Leading Moving Average")
ma1 = MA(ma1Source, ma1Length, ma1Type)[ma1Offset]
ma2Color = input(defval=color.lime, title="", inline="MA-2", group="Leading Moving Average")
//useMa2Offset = input(defval=true, title="Use offset to MA2", inline="MA-2", group="Leading Moving Average")
ma2Offset = input.int(defval=4, title="Offset2 Steps", minval=0, maxval=10, step=1, tooltip="The Magic happens here! The offset to move the line to the right.", inline="MA-2", group="Leading Moving Average")
ma2 = ma1[ma2Offset]
ma3Color = input(defval=color.aqua, title="", inline="MA-3", group="Leading Moving Average")
//useMa3Offset = input(defval=false, title="Use offset to MA3", inline="MA-3", group="Leading Moving Average")
ma3Offset = input.int(defval=6, title="Offset3 Steps", minval=0, maxval=10, step=1, tooltip="The Magic happens here! The offset to move the line to the right.", inline="MA-3", group="Leading Moving Average")
ma3 = ma1[ma3Offset]
ma4Type = input.string(defval="SMA", title="", inline="MA4", options=["EMA", "HMA", "RMA", "SMA","SWMA", "VWMA", "WMA"], group="Lagging Moving Average")
ma4Length = input.int(defval=22, title="",minval=1, inline="MA4", group="Lagging Moving Average")
ma4Source = input(defval=close, title="", inline="MA4", group="Lagging Moving Average")
ma4Color = input(defval=color.yellow, title="", inline="MA-4", group="Lagging Moving Average")
//useMa4Offset = input(defval=true, title="Use offset to MA4", inline="MA-4", group="Lagging Moving Average")
ma4Offset = input.int(defval=2, title="Offset Steps", minval=0, maxval=10, step=1, tooltip="The Magic happens here! The offset to move the line to the right.", inline="MA-4", group="Lagging Moving Average")
ma4 = MA(ma4Source, ma4Length, ma4Type)[ma4Offset]
bandTransp = input.int(defval=60, title="Band Transparency", minval=20, maxval=80, step=10, group="Banding")
useBand1 = input(defval=true, title="Band 1", inline="Band", group="Banding")
band1Transp = useBand1 ? bandTransp : 100
band1clr = ma1 > ma2 ? color.new(#00ff00, transp=band1Transp) : color.new(#ff0000, transp=band1Transp)
useBand2 = input(defval=true, title="Band 2", inline="Band", group="Banding")
band2Transp = useBand2 ? bandTransp : 100
band2clr = ma1 > ma3 ? color.new(#00ff00, transp=band2Transp) : color.new(#ff0000, transp=band2Transp)
useBand3 = input(defval=true, title="Band 3", tooltip="Up trend green, down trend red. Colors get reversed if MA1 lenght is greater than MA2 lenght, or they are different type and MA2 quicker. In that case, just reverse your selections for MA1 and MA2, or let it be as is.", inline="Band", group="Banding")
band3Transp = useBand3 ? bandTransp : 100
band3clr = ma1 > ma4 ? color.new(#00ff00, transp=band3Transp) : color.new(#ff0000, transp=band3Transp)
//Graphs
piirto1 = plot(ma1, color = ma1Color, title="MA1")
piirto2 = plot(ma2, color = ma2Color, title="MA2")
piirto3 = plot(ma3, color = ma3Color, title="MA3")
piirto4 = plot(ma4, color = ma4Color, title="MA4")
fill(piirto1, piirto2, color=band1clr)
fill(piirto1, piirto3, color=band2clr)
fill(piirto1, piirto4, color=band3clr)
//Strategy entry and stop conditions
longCondition = riskLevel == "Highest" ? ma1Source > ma1 : riskLevel == "High" ? ma1Source > ma2 : riskLevel == "Medium" ? ma1Source > ma3 : riskLevel == "Low" ? ma1Source > ma4 : riskLevel == "Lowest" ? ma1 > ma2 and ma1 > ma3 and ma1 > ma4 : na
shortCondition = riskLevel == "Highest" ? ma1Source < ma1 : riskLevel == "High" ? ma1Source < ma2 : riskLevel == "Medium" ? ma1Source < ma3 : riskLevel == "Low" ? ma1Source < ma4 : riskLevel == "Lowest" ? ma1 < ma2 and ma1 < ma3 and ma1 < ma4 : na
stopLprice = useStop == true ? strategy.position_avg_price * (1-stopPrct) : na
stopSprice = useStop == true ? strategy.position_avg_price * (1+stopPrct) : na
if (longCondition)
strategy.entry("Long",strategy.long)
strategy.exit("Long Stop", "Long", stop=stopLprice)
if (shortCondition)
strategy.entry("Short",strategy.short)
strategy.exit("Short Stop", "Short", stop=stopSprice)
//End