Strategi Terobosan Segitiga Ganda Moonlight Tracker


Tanggal Pembuatan: 2023-11-21 13:49:10 Akhirnya memodifikasi: 2023-11-21 13:49:10
menyalin: 0 Jumlah klik: 688
1
fokus pada
1617
Pengikut

Strategi Terobosan Segitiga Ganda Moonlight Tracker

Ringkasan

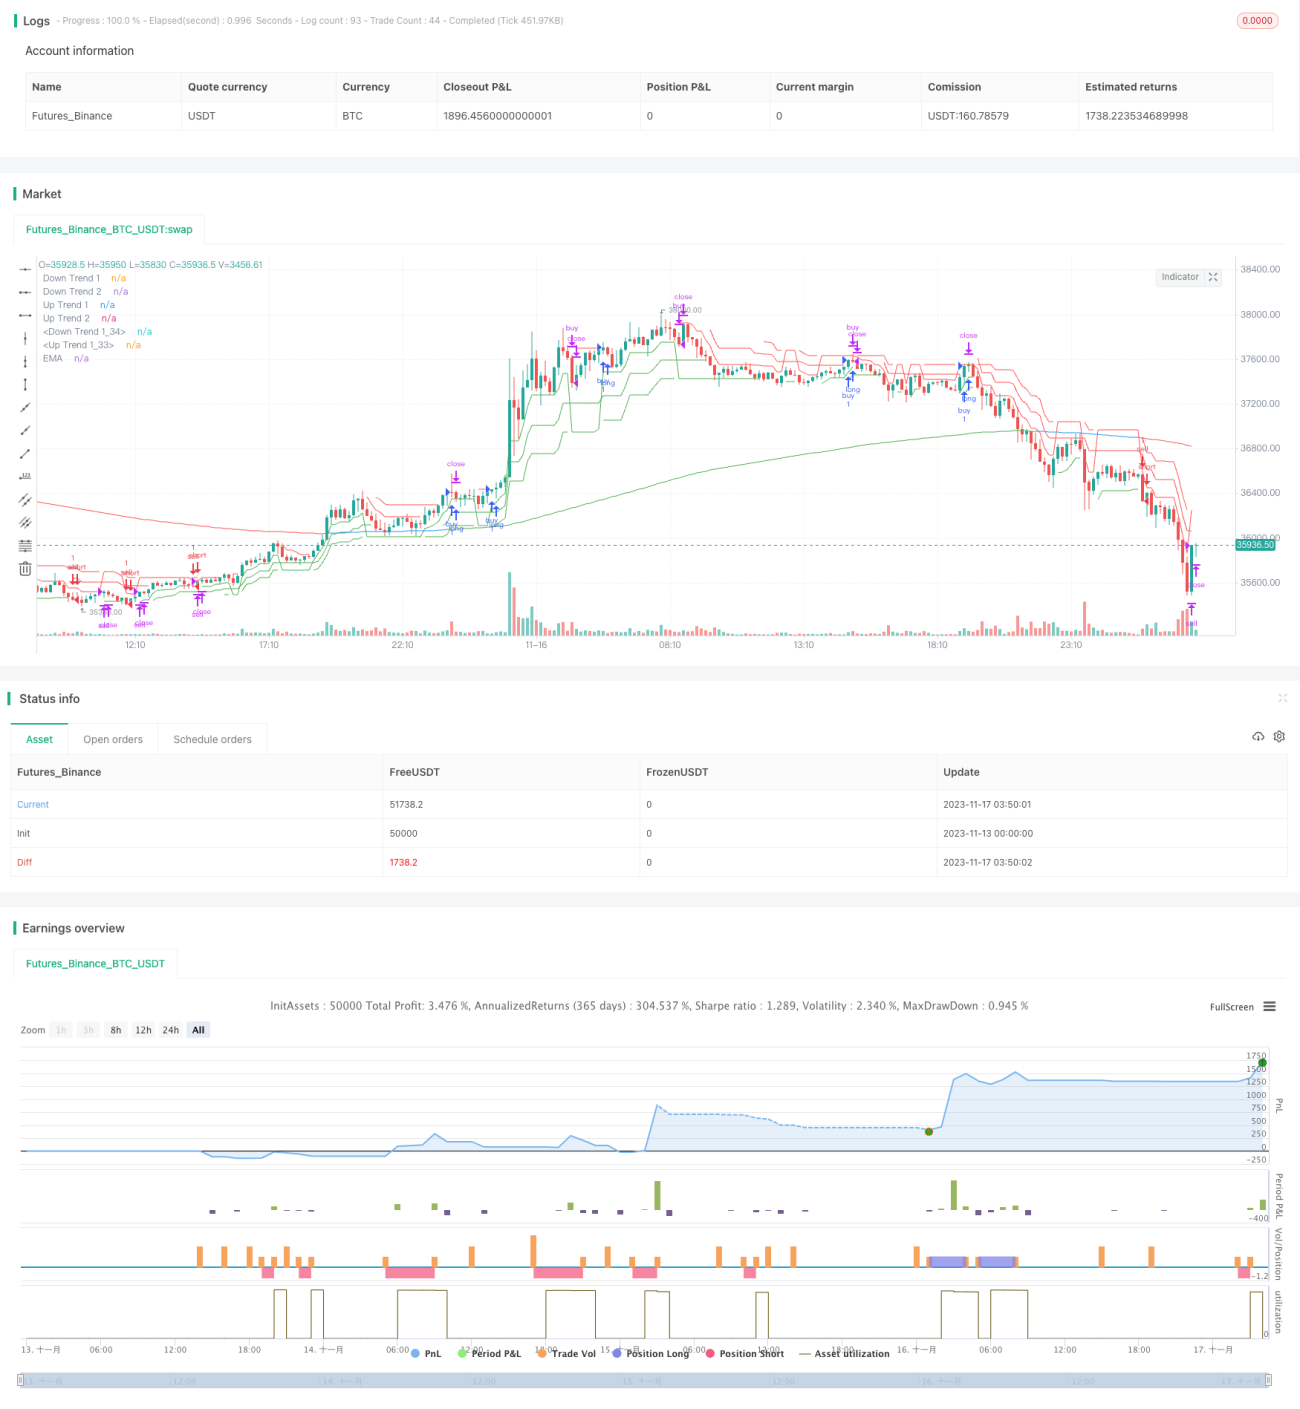
Strategi ini memungkinkan untuk mencapai tingkat kemenangan yang tinggi dalam operasi pelacakan penembusan dengan membangun saluran dua segitiga, yang dikombinasikan dengan indikator supertrend untuk menentukan arah penembusan harga. Strategi ini juga menggabungkan EMA untuk menilai tren pasar secara keseluruhan dan menghindari perdagangan yang tidak efektif dalam situasi yang bergolak.

Prinsip Strategi

  1. Membangun indikator supertrend dengan tiga parameter berbeda untuk menentukan arah tren harga dalam jangka pendek, menengah, dan panjang.

  2. Dengan menggunakan saluran dua segitiga untuk menentukan apakah harga akan menembus saluran naik atau turun, sebagai sinyal ListEntry dan Exit.

  3. Dengan kombinasi 233 siklus EMA untuk menentukan arah tren secara keseluruhan, harga perlu melakukan lebih banyak untuk menembus saluran naik di pasar multihead EMA, dan kosong untuk menembus saluran turun di pasar kosong.

  4. Stop dan stop loss sinyal dinilai melalui tiga indikator supertrend yang dikombinasikan. Stop atau stop loss posisi dihapus ketika lebih dari dua indikator berubah warna.

Keunggulan Strategis

  1. Saluran dua segitiga, dikombinasikan dengan penilaian siklus waktu, dapat menangkap terobosan tren secara akurat.

  2. Kondisi multi-level filter dapat menghindari transaksi yang tidak valid dan meningkatkan tingkat kemenangan.

  3. Tracking Stop Loss Dinamis, Mengurangi Risiko Penarikan

  4. Pengaturan parameter sederhana, mudah dipelajari dan digunakan.

Risiko dan Optimalisasi Strategi

  1. Dalam pasar yang bergolak besar dapat terjadi situasi yang sering membuka posisi dan kemudian dihentikan. Parameter siklus ATR dapat disesuaikan dengan tepat untuk mengurangi frekuensi pembukaan posisi.

  2. Periode EMA yang terlalu pendek tidak dapat menentukan tren keseluruhan, dan terlalu lama tidak dapat dilacak. Disarankan untuk menguji parameter EMA optimal.

  3. Stop loss level tidak dapat secara dinamis melacak perubahan amplitudo fluktuasi pasar dan memerlukan intervensi manual untuk penyesuaian. Pada tahap selanjutnya dapat dipertimbangkan untuk menyesuaikan stop loss distance dengan ATR secara dinamis.

Meringkaskan

Strategi penembusan dua segitiga pelacak sinar bulan dengan kombinasi indikator tren super dengan saluran dua segitiga, memungkinkan penangkapan yang tepat untuk penembusan yang kuat. Selain itu, mekanisme penyaringan multi-tingkat dapat menyaring sinyal yang tidak efektif, dengan tingkat kemenangan yang lebih tinggi. Pengaturan parameter yang sederhana juga membuatnya mudah dipahami.

Kode Sumber Strategi
/*backtest
start: 2023-11-13 00:00:00
end: 2023-11-17 04:00:00
period: 10m
basePeriod: 1m
exchanges: [{"eid":"Futures_Binance","currency":"BTC_USDT"}]
*/

// @version=5
// author=theasgard and moonshot-indicator (ms)
// year 2021
//
// This is a well knowen strategy by using 3 different Supertrends and a trend-defining EMA,
// feel free to play around with the settings, a backtest on 8h ETHUSDT pair brought some good results using 
// the 233EMA and investing 75% of a 10k start capital
//
// the idea is to have at least 2 supertrnds going green above the trend-EMA to go long and exit by turning 
// 2 supertrends red (idea: 1 supertrend in red could initialize a take profit)
// shorts work vice versa
// The EMA shows in green for uptrends and in red for downtrends, if it is blue no Signal will be taken because 
// the 3 supertrends are not all above or below the trendline(EMA)

strategy("ms hypertrender", overlay=true)

// set up 3 supertrendlines and colour the direction up/down
atrPeriod1 = input(10, "ATR Length 1")
factor1 = input.float(1.0, "ATR Factor 1", step = 0.01)
[supertrend1, direction1] = ta.supertrend(factor1, atrPeriod1)
upTrend1 = plot(direction1 < 0 ? supertrend1 : na, "Up Trend 1", color = color.green, style=plot.style_linebr)
downTrend1 = plot(direction1 < 0? na : supertrend1, "Down Trend 1", color = color.red, style=plot.style_linebr)

atrPeriod2 = input(11, "ATR Length 2")
factor2 = input.float(2.0, "ATR Factor 2", step = 0.01)
[supertrend2, direction2] = ta.supertrend(factor2, atrPeriod2)
upTrend2 = plot(direction2 < 0 ? supertrend2 : na, "Up Trend 2", color = color.green, style=plot.style_linebr)
downTrend2 = plot(direction2 < 0? na : supertrend2, "Down Trend 2", color = color.red, style=plot.style_linebr)

atrPeriod3 = input(12, "ATR Length 3")
factor3 = input.float(3.0, "ATR Factor 3", step = 0.01)
[supertrend3, direction3] = ta.supertrend(factor3, atrPeriod3)
upTrend3 = plot(direction3 < 0 ? supertrend3 : na, "Up Trend 1", color = color.green, style=plot.style_linebr)
downTrend3 = plot(direction3 < 0? na : supertrend3, "Down Trend 1", color = color.red, style=plot.style_linebr)

//set up the trend dividing EMA and color uptrend nutreal downtrend
len = input.int(233, minval=1, title="Trend-EMA Length")
src = input(close, title="Source")
offset = input.int(title="Offset", defval=0, minval=-500, maxval=500)

//general Bull or Bear Trend? Visualized by ema
ematrend = ta.ema(src, len)
generaluptrend = supertrend1 > ematrend and supertrend2 > ematrend and supertrend3 > ematrend
generaldowntrend = supertrend1 < ematrend and supertrend2 < ematrend and supertrend3 < ematrend
emacolor = if generaluptrend
    color.green
else if generaldowntrend
    color.red
else
    color.blue
plot(ematrend, title="EMA", color=emacolor, offset=offset)

// Bullish? min 2 supertrends green
bullish = (direction1 < 0 and direction2 < 0) or (direction1 < 0 and direction3 < 0) or (direction2 < 0 and direction3 < 0) and generaluptrend
extremebullish = direction1 < 0 and direction2 < 0 and direction3 < 0 and generaluptrend //all 3 green

// Bearish? min 2 supertrends red
bearish = (direction1 > 0 and direction2 > 0) or (direction1 > 0 and direction3 > 0) or (direction2 > 0 and direction3 > 0) and generaldowntrend
extremebearish = direction1 > 0 and direction2 > 0 and direction3 > 0 and generaldowntrend //all 3 red

// Open Long
//plotchar(((bullish and not bullish[1]) or (extremebullish and not extremebullish[1])) and (emacolor==color.green)? close : na, title = 'Start Long', char='▲', color = #80eb34, location = location.belowbar, size = size.small)

// TP 10% Long
TP10long = ((generaluptrend and bullish[1]) or (generaluptrend and extremebullish[1])) and (direction1 > 0 or direction2 > 0 or direction3 > 0)
//plotchar(TP10long and not TP10long[1]? close : na, title = 'TP on Long', char='┼', color = #ffd000, location = location.abovebar, size = size.tiny)

// Exit Long
//plotchar(extremebearish and not extremebearish[1] or bearish and not bearish[1]? close : na, title = 'Close all Longs', char='Ꭓ', color = #ff0037, location = location.abovebar, size = size.tiny)

// Open Short
//plotchar(((bearish and not bearish[1]) or (extremebearish and not extremebearish[1])) and (emacolor==color.red)? close : na, title = 'Start Short', char='▼', color = #0547e3, location = location.abovebar, size = size.small)

// TP 10% Short
TP10short = ((generaldowntrend and bearish[1]) or (generaldowntrend and extremebearish[1])) and (direction1 < 0 or direction2 < 0 or direction3 < 0)
//plotchar(TP10short and not TP10short[1]? close : na, title = 'TP on Short', char='┼', color = #ffd000, location = location.belowbar, size = size.tiny)

// Exit Short
//plotchar(extremebullish and not extremebullish[1] or bullish and not bullish[1]? close : na, title = 'Close all Shorts', char='Ꭓ', color = #ff0037, location = location.belowbar, size = size.tiny)

// Set stop loss level with input options (optional)
longLossPerc = input.float(title="Long Stop Loss (%)",
     minval=0.0, step=0.1, defval=1) * 0.01

shortLossPerc = input.float(title="Short Stop Loss (%)",
     minval=0.0, step=0.1, defval=1) * 0.01
     
// Determine stop loss price
longStopPrice  = strategy.position_avg_price * (1 - longLossPerc)
shortStopPrice = strategy.position_avg_price * (1 + shortLossPerc)

openlong = (((bullish and not bullish[1]) or (extremebullish and not extremebullish[1])) and (emacolor==color.green))
openshort = (((bearish and not bearish[1]) or (extremebearish and not extremebearish[1])) and (emacolor==color.red))
exitlong = (extremebearish and not extremebearish[1] or bearish and not bearish[1]) or TP10long
exitshort = (extremebullish and not extremebullish[1] or bullish and not bullish[1]) or TP10short
strategy.entry("buy", strategy.long, when=openlong)
strategy.entry("sell", strategy.short, when=openshort)

strategy.close("buy", when=exitlong)
strategy.close("sell", when=exitshort)

// Submit exit orders based on calculated stop loss price
if (strategy.position_size > 0)
    strategy.exit(id="Long Stop", stop=longStopPrice)

if (strategy.position_size < 0)
    strategy.exit(id="Short Stop", stop=shortStopPrice)