Strategi Pasangan Jalur Ganda Pembalikan Momentum


Tanggal Pembuatan: 2023-11-24 10:17:15 Akhirnya memodifikasi: 2023-11-24 10:17:15
menyalin: 0 Jumlah klik: 613
1
fokus pada
1617
Pengikut

Strategi Pasangan Jalur Ganda Pembalikan Momentum

Ringkasan

Strategi ini menggunakan beberapa indikator teknis untuk menghasilkan sinyal perdagangan. Strategi ini menggunakan titik balik penilaian bentuk 123, membentuk sinyal pasangan dengan indikator CSI ergodic, dan memungkinkan pelacakan tren. Strategi ini bertujuan untuk menangkap tren garis pendek tengah dan mendapatkan keuntungan yang lebih tinggi.

Prinsip Strategi

Strategi ini terdiri dari dua bagian:

  1. 123 Penghakiman Transformatif
  2. Indikator ergodic CSI menghasilkan sinyal pasangan

123 bentuk penilaian adalah dengan 3 garis K terakhir dari hubungan harga penutupan untuk menilai harga berbalik. Logika penilaian spesifik adalah: Jika dua garis K sebelumnya dan satu garis penutupan berikutnya naik, dan indikator stoch cepat dan lambat saat ini berada di bawah 50, itu adalah sinyal beli. Jika dua garis K terdepan dan satu garis penutupan berikutnya turun, dan indikator stoch cepat dan lambat saat ini berada di atas 50, maka sinyal jual.

Indikator ergodic CSI memperhitungkan berbagai faktor, seperti harga, amplitudo riil, dan indikator tren, untuk menilai tren pasar secara menyeluruh, menghasilkan zona jual beli. Sinyal beli muncul ketika indikator berada di atas zona beli, dan sinyal jual muncul ketika indikator berada di bawah zona jual.

Akhirnya, sinyal pembalikan 123 bentuk dengan sinyal orbit dari CSI ergodic melakukan operasi perhitungan dan perhitungan untuk mendapatkan sinyal strategi akhir.

Keunggulan Strategis

  1. Menangkap Tren Garis Pendek, Potensi Keuntungan Lebih Besar
  2. Penghakiman Reverse Morphology, yang efektif dalam menangkap titik balik
  3. Dua jalur berpasangan, mengurangi sinyal palsu

Risiko Strategis

  1. Perbedaan harga saham yang mungkin terjadi, yang menyebabkan stop loss
  2. Inversionary shape rentan terhadap pasar yang bergoyang
  3. Optimasi parameter terbatas, efek berfluktuasi besar

Arah optimasi

  1. Optimalkan parameter untuk meningkatkan efektivitas keuntungan strategi
  2. Meningkatkan logika stop loss dan mengurangi kerugian tunggal
  3. Model multi-faktor untuk meningkatkan kualitas pilihan saham

Meringkaskan

Strategi ini memungkinkan pelacakan yang efektif dari tren garis pendek dan menengah dengan cara membalikkan bentuknya dan memasangkannya dengan dual track. Strategi ini memiliki stabilitas dan tingkat keuntungan yang lebih tinggi dibandingkan dengan indikator teknis tunggal. Langkah selanjutnya adalah mengoptimalkan parameter lebih lanjut dan menambahkan modul stop loss dan stock option untuk mengurangi penarikan balik dan meningkatkan efek keseluruhan.
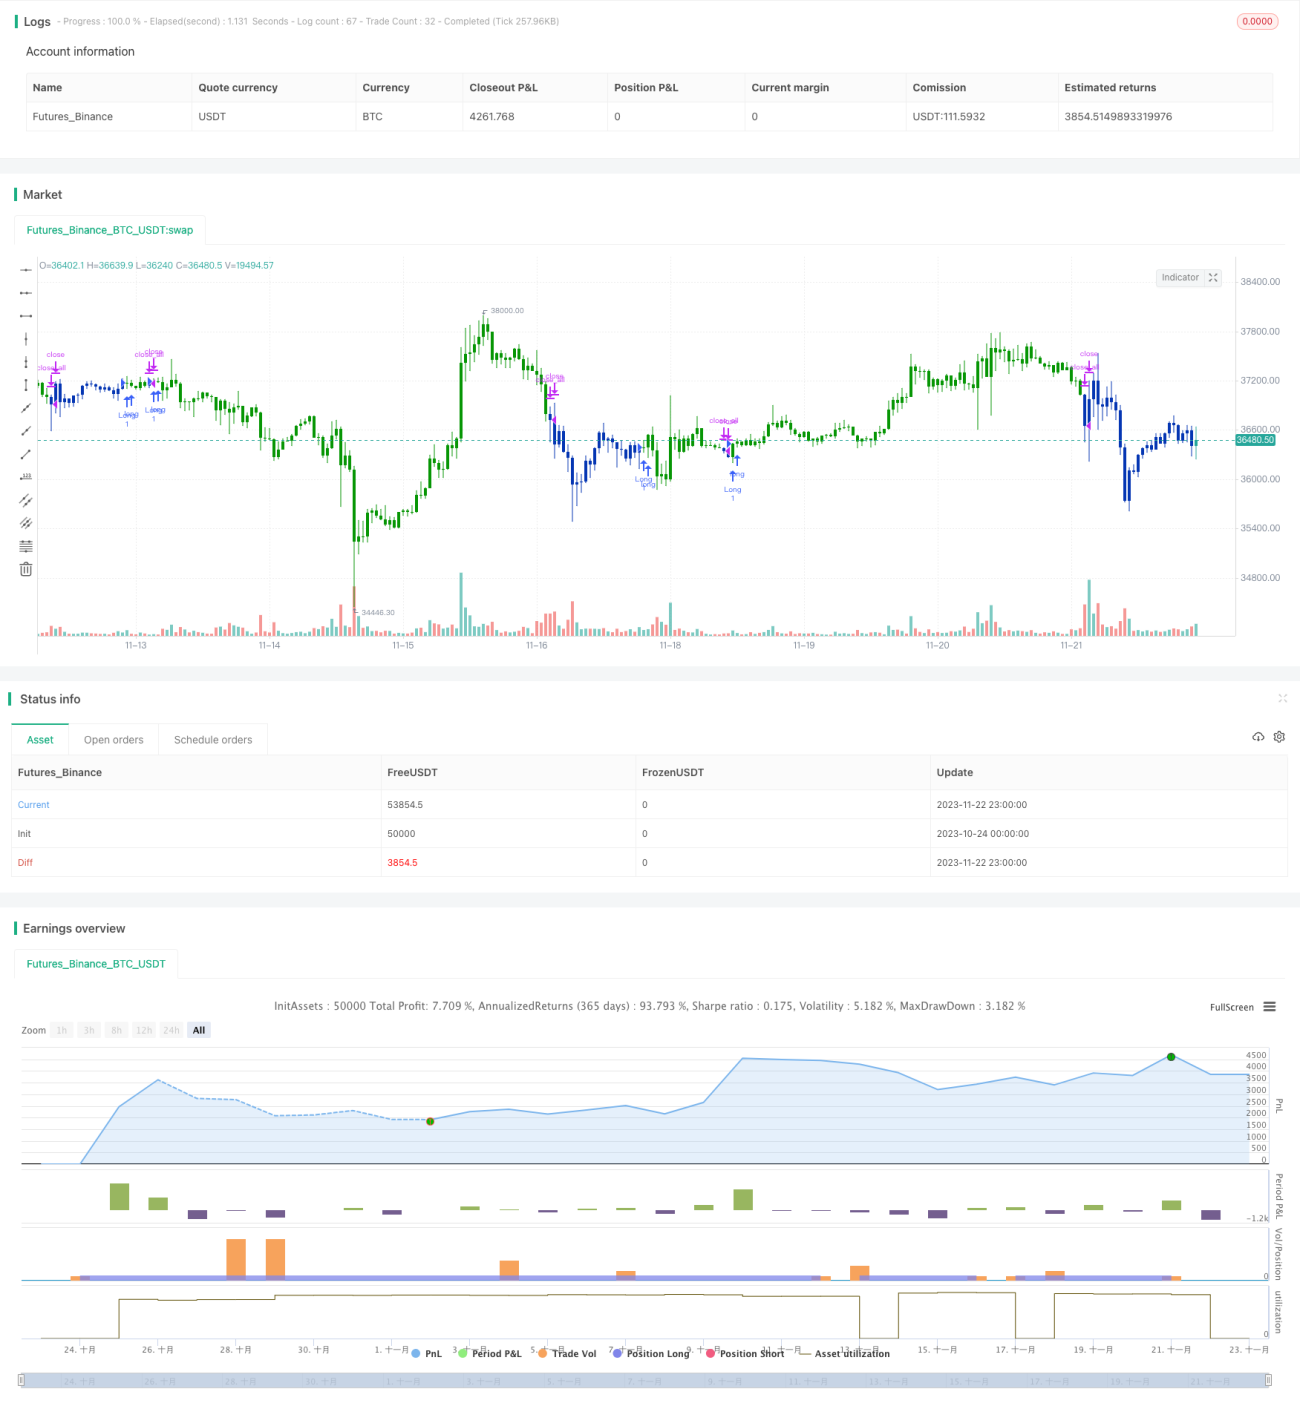
Kode Sumber Strategi
/*backtest
start: 2023-10-24 00:00:00
end: 2023-11-23 00:00:00
period: 1h
basePeriod: 15m
exchanges: [{"eid":"Futures_Binance","currency":"BTC_USDT"}]
*/

//@version=4
////////////////////////////////////////////////////////////
//  Copyright by HPotter v1.0 22/07/2020
// This is combo strategies for get a cumulative signal. 
//
// First strategy
// This System was created from the Book "How I Tripled My Money In The 
// Futures Market" by Ulf Jensen, Page 183. This is reverse type of strategies.
// The strategy buys at market, if close price is higher than the previous close 
// during 2 days and the meaning of 9-days Stochastic Slow Oscillator is lower than 50. 
// The strategy sells at market, if close price is lower than the previous close price 
// during 2 days and the meaning of 9-days Stochastic Fast Oscillator is higher than 50.
//
// Second strategy
// This is one of the techniques described by William Blau in his book 
// "Momentum, Direction and Divergence" (1995). If you like to learn more, 
// we advise you to read this book. His book focuses on three key aspects 
// of trading: momentum, direction and divergence. Blau, who was an electrical 
// engineer before becoming a trader, thoroughly examines the relationship between 
// price and momentum in step-by-step examples. From this grounding, he then looks 
// at the deficiencies in other oscillators and introduces some innovative techniques, 
// including a fresh twist on Stochastics. On directional issues, he analyzes the 
// intricacies of ADX and offers a unique approach to help define trending and 
// non-trending periods.
// This indicator plots Ergotic CSI and smoothed Ergotic CSI to filter out noise. 
//
// WARNING:
// - For purpose educate only
// - This script to change bars colors.
////////////////////////////////////////////////////////////
Reversal123(Length, KSmoothing, DLength, Level) =>
    vFast = sma(stoch(close, high, low, Length), KSmoothing) 
    vSlow = sma(vFast, DLength)
    pos = 0.0
    pos := iff(close[2] < close[1] and close > close[1] and vFast < vSlow and vFast > Level, 1,
	         iff(close[2] > close[1] and close < close[1] and vFast > vSlow and vFast < Level, -1, nz(pos[1], 0))) 
	pos

fADX(Len) =>
    up = change(high)
    down = -change(low)
    trur = rma(tr, Len)
    plus = fixnan(100 * rma(up > down and up > 0 ? up : 0, Len) / trur)
    minus = fixnan(100 * rma(down > up and down > 0 ? down : 0, Len) / trur)
    sum = plus + minus 
    100 * rma(abs(plus - minus) / (sum == 0 ? 1 : sum), Len)

ECSI(r,Length,BigPointValue,SmthLen,SellZone,BuyZone) =>
    pos = 0
    source = close
    K = 100 * (BigPointValue / sqrt(r) / (150 + 5))
    xTrueRange = atr(1) 
    xADX = fADX(Length)
    xADXR = (xADX + xADX[1]) * 0.5
    nRes = iff(Length + xTrueRange > 0, K * xADXR * xTrueRange / Length,0)
    xCSI = iff(close > 0,  nRes / close, 0)
    xSMA_CSI = sma(xCSI, SmthLen)
    pos := iff(xSMA_CSI > BuyZone, 1,
             iff(xSMA_CSI <= SellZone, -1, nz(pos[1], 0))) 
    pos

strategy(title="Combo Backtest 123 Reversal & Ergodic CSI", shorttitle="Combo", overlay = true)
Length = input(14, minval=1)
KSmoothing = input(1, minval=1)
DLength = input(3, minval=1)
Level = input(50, minval=1)
//-------------------------
r = input(32, minval=1)
LengthECSI = input(1, minval=1)
BigPointValue = input(1.0, minval=0.00001)
SmthLen = input(5, minval=1)
SellZone = input(0.06, minval=0.00001)
BuyZone = input(0.02, minval=0.001)
reverse = input(false, title="Trade reverse")
posReversal123 = Reversal123(Length, KSmoothing, DLength, Level)
posECSI = ECSI(r,LengthECSI,BigPointValue,SmthLen,SellZone,BuyZone)
pos = iff(posReversal123 == 1 and posECSI == 1 , 1,
	   iff(posReversal123 == -1 and posECSI == -1, -1, 0)) 
possig = iff(reverse and pos == 1, -1,
          iff(reverse and pos == -1 , 1, pos))	   
if (possig == 1) 
    strategy.entry("Long", strategy.long)
if (possig == -1)
    strategy.entry("Short", strategy.short)	 
if (possig == 0) 
    strategy.close_all()
barcolor(possig == -1 ? #b50404: possig == 1 ? #079605 : #0536b3 )