Strategi Mengikuti Tren Multi-Indikator


Tanggal Pembuatan: 2023-11-24 11:10:27 Akhirnya memodifikasi: 2023-11-24 11:10:27
menyalin: 2 Jumlah klik: 805
1
fokus pada
1621
Pengikut

Strategi Mengikuti Tren Multi-Indikator

Ringkasan

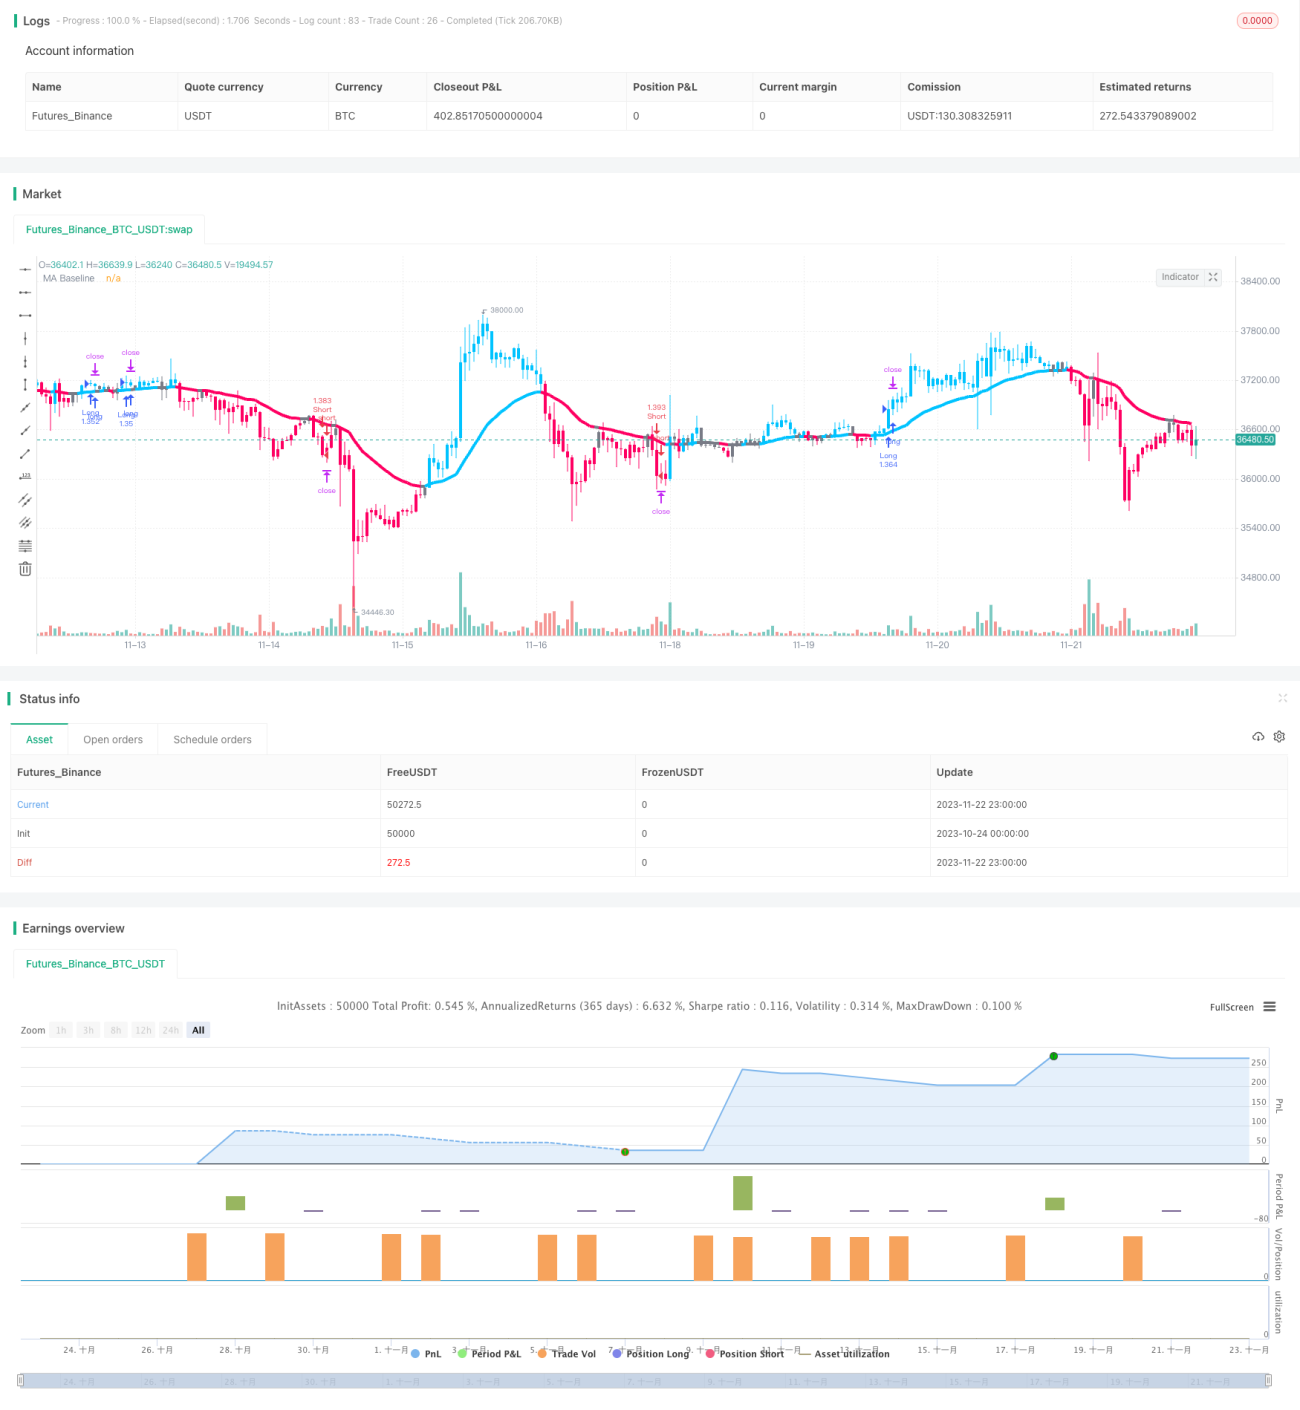
Strategi ini menggunakan tiga indikator open source untuk mencapai penilaian tren multi-aksinya, dan menetapkan stop loss untuk mengunci keuntungan. Secara khusus, strategi ini menggunakan indikator AK MACD BB untuk menentukan arah tren jangka pendek, indikator SSL untuk memfilter beberapa sinyal palsu, dan akhirnya menggabungkan indikator volume transaksi VSF untuk menilai ketegangan pembelian dan penjualan yang sebenarnya, sehingga menentukan waktu masuk.

Prinsip Strategi

  1. Indikator AK MACD BB

Indikator ini mengaplikasikan Brin band untuk MACD indicator, MACD indicator line menerobos Brin band untuk menghasilkan sinyal beli ketika naik ke rel dan menghasilkan sinyal jual ketika turun.

  1. Indikator SSL

Indikator SSL menilai apakah harga telah menembus garis rata-rata, dan mendeteksi sinyal tes kembali. Harga naik ketika melewati garis rata-rata dan indikator SSL berwarna biru, harga turun ketika melewati garis rata-rata dan indikator SSL berwarna merah, dan sinyal perdagangan.

  1. Indikator VSF

Indikator VSF menilai kekuatan kedua belah pihak. Strategi hanya mengirimkan sinyal jika kekuatan pembeli atau kekuatan penjual lebih besar dari 50%, untuk menghindari kegagalan.

  1. Penghentian kerusakan

Strategi ini terdiri dari 4 baris progressive take profit, dengan setelan interval dari 1,5 kali lipat hingga 3 kali lipat keuntungan. Selain itu, setelan stop loss tetap 2%, yang secara efektif mengontrol kerugian maksimum per transaksi.

Analisis Keunggulan

  1. Komposisi multi-indikator, penilaian yang akurat

Melalui berbagai indikator untuk menilai tren multi-aksel waktu, sinyal palsu dapat disaring dan penilaian lebih akurat.

  1. Stop loss otomatis, risiko terkendali

Setelan Stop Loss yang ada di dalam strategi dapat mengontrol kerugian transaksi tunggal sekitar 2%, untuk menghindari kerugian besar.

  1. Data deteksi sangat baik

Menurut pengamatan dari penerbit, dari 100 transaksi, 74% dari transaksi tersebut menghasilkan keuntungan, dan 427% dari total keuntungan.

Analisis Risiko dan Solusi

  1. Risiko pasar yang bergejolak

Dalam skala besar, beberapa kerugian kecil dapat terjadi. Pada saat ini, Anda dapat menyesuaikan stop loss tetap atau menghentikan perdagangan.

  1. Risiko dibatasi oleh banyak kepala kosong

Strategi saat ini dapat melakukan lebih banyak dan dapat melakukan lebih sedikit. Jika Anda membatasi hanya melakukan lebih banyak atau hanya melakukan lebih sedikit, peluang Anda untuk tidak mendapatkan keuntungan akan berkurang setengah.

  1. Risiko saat transaksi

Strategi menggunakan data 5 menit untuk menilai, jika hanya beberapa jam data dalam satu hari perdagangan, jumlah sampel tidak cukup, sinyal mungkin tidak dapat diandalkan.

Arah optimasi strategi

  1. Optimalkan parameter stop loss

Anda dapat menguji berbagai tingkat stop loss untuk menemukan parameter yang optimal. Stop loss terlalu kecil tidak dapat mengontrol risiko secara efektif, dan stop loss terlalu besar dapat kehilangan lebih banyak keuntungan.

  1. Menambahkan penyesuaian posisi otomatis

Anda dapat mengatur tracking stop loss atau move stop loss untuk mengunci keuntungan. Atau Anda dapat menaikkan posisi untuk mendapatkan lebih banyak keuntungan sesuai dengan kondisi tertentu.

  1. Kombinasi dengan Indikator Lain

Kombinasi indikator yang berbeda dapat diuji untuk menentukan kombinasi indikator mana yang paling efektif. Anda juga dapat menambahkan lebih banyak indikator untuk verifikasi silang.

  1. Optimasi parameter

Dengan melakukan pengukuran ulang dengan parameter yang berbeda, dapat ditemukan arah optimasi parameter. Dalam strategi ini, perubahan parameter Brin atau parameter rata-rata mungkin menghasilkan hasil yang lebih baik.

Meringkaskan

Strategi ini mengintegrasikan beberapa indikator untuk menentukan arah tren, mengatur stop loss otomatis, mampu menghasilkan keuntungan dalam tren yang kuat dan mengendalikan kerugian transaksi tunggal dalam kisaran yang sangat kecil. Dari data feedback penerbit, tingkat keuntungan dan tingkat keuntungan sangat ideal. Dengan beberapa optimasi, diharapkan untuk meningkatkan stabilitas dan profitabilitas strategi lebih lanjut.

Kode Sumber Strategi
// This source code is subject to the terms of the Mozilla Public License 2.0 at https://mozilla.org/MPL/2.0/
// © myn

//@version=5
strategy('Strategy Myth-Busting #7 - MACDBB+SSL+VSF - [MYN]', max_bars_back=5000, overlay=true, pyramiding=0, initial_capital=1000, currency='USD', default_qty_type=strategy.percent_of_equity, default_qty_value=1.0, commission_value=0.075, use_bar_magnifier = false)


/////////////////////////////////////
//* Put your strategy logic below *//

/////////////////////////////////////
//nwVqTuPe6yo

//5 min
//ak MACD BB by AlgoKid
//Disable bar colors in style

//SSL hybrid by mihkel00
// Style disable all but bar colors and ma baseline
// Change SSL1 baseline length from 60 to 30 
// Change SSL1 baseline type from HMA to EMA

//volume strength Finder by Saravanan
// Get rid of bar colors on style

// Trading Rules

// SSL Hybrid.  
// Buy only when price action is closed above the EMA and the line is blue color.
// Sell priace action must be closed below the EMA and the line is red color


// Volume Indicator
// Buy when Buyers strength / volume is higher than sellers volume
// Opposite


// General trading rules
// Short
// Price action must be moving below the EMA and then it has to create a pullback .  The pullback is confirmed when the color changes from red to gray or from red  to blue.
// If the price action is touching the EMA but the line does not change the color, the pullback is not confirmed. 
// Once we have this pullback we're going to be waiting for the MACD to issue a new continuation short signal.  A red circle must appear on the indicator and these circles should not be touching accross the zero level while they are being greeen 
// Sellers strength above 50% at the time the MACD indiactor issues a new short signal.

// Stop Loss at EMA line 1:1.5 risk ratio.

// Functions universal to strategy

	
f_priorBarsSatisfied(_objectToEval, _numOfBarsToLookBack) => 
    returnVal = false
    for i = 0 to _numOfBarsToLookBack
        if (_objectToEval[i] == true)
            returnVal = true

// AK MACD BB v 1.00 by Algokid
//░░░░░░░░░░░░░░░░░░░░░░░░░░░░░░░░░░░░░░░░░░░░░░░░░░░░░░░░░░░░░░░░░░░░░░░░░░░░░░░░░░░░░░░░░░░░░░░░░░░░░░░░░░░░░░░░░░░░░░░░░░░░░░░░░░░░░░░░░░░░░░░░░░
//indicator('AK MACD BB v 1.00')

length = input.int(10, minval=1, title='BB Periods',group="AK MACD BB")
dev = input.float(1, minval=0.0001, title='Deviations')

//MACD
fastLength = input.int(12, minval=1)
slowLength = input.int(26, minval=1)
signalLength = input.int(9, minval=1)
fastMA = ta.ema(close, fastLength)
slowMA = ta.ema(close, slowLength)
macd = fastMA - slowMA

//BollingerBands

Std = ta.stdev(macd, length)
Upper = Std * dev + ta.sma(macd, length)
Lower = ta.sma(macd, length) - Std * dev


//Band1 = plot(Upper, color=color.new(color.gray, 0), style=plot.style_line, linewidth=2, title='Upper Band')
//Band2 = plot(Lower, color=color.new(color.gray, 0), style=plot.style_line, linewidth=2, title='lower Band')
//fill(Band1, Band2, color=color.new(color.blue, 75), title='Fill')

mc = macd >= Upper ? color.lime : color.red

// Indicator

//plot(macd, color=mc, style=plot.style_circles, linewidth=3)
zeroline = 0
//plot(zeroline, color=color.new(color.orange, 0), linewidth=2, title='Zeroline')

//buy
//barcolor(macd > Upper ? color.yellow : na)
//short
//barcolor(macd < Lower ? color.aqua : na)

//needs improvments 


MACDBBNumBarsBackToLookForMACDToBelowZero = input(1, title="Number Of bars to look back to ensure MACD isn't above/below Zero Line?")

// Sell when MACD to issue a new continuation short signal.  A new red circle must appear on the indicator and these circles should not be touching accross the zero level while they were previously green 
MACDBBENtryShort = mc == color.red and macd < zeroline and f_priorBarsSatisfied(macd < zeroline and mc == color.lime, MACDBBNumBarsBackToLookForMACDToBelowZero)
// Buy when MACD to issue a new continuation long signal.  A new green circle must appear on the indicator and these circles should not be touching accross the zero level while they were previously red
MACDBBENtryLong = mc == color.lime and macd > zeroline and f_priorBarsSatisfied(macd > zeroline and mc == color.red, MACDBBNumBarsBackToLookForMACDToBelowZero)


// SSL Hybrid by Mihkel00
//░░░░░░░░░░░░░░░░░░░░░░░░░░░░░░░░░░░░░░░░░░░░░░░░░░░░░░░░░░░░░░░░░░░░░░░░░░░░░░░░░░░░░░░░░░░░░░░░░░░░░░░░░░░░░░░░░░░░░░░░░░░░░░░░░░░░░░░░░░░░░░░░░░
//@version=5
//AK MACD BB 
//created by Algokid , February 24,2015

//@version=5
//By Mihkel00
// This script is designed for the NNFX Method, so it is recommended for Daily charts only. 
// Tried to implement a few VP NNFX Rules
// This script has a SSL / Baseline (you can choose between the SSL or MA), a secondary SSL for continiuation trades and a third SSL for exit trades.
// Alerts added for Baseline entries, SSL2 continuations, Exits.
// Baseline has a Keltner Channel setting for "in zone" Gray Candles
// Added "Candle Size > 1 ATR" Diamonds from my old script with the criteria of being within Baseline ATR range.
// Credits
// Strategy causecelebre https://www.tradingview.com/u/causecelebre/
// SSL Channel ErwinBeckers https://www.tradingview.com/u/ErwinBeckers/
// Moving Averages jiehonglim https://www.tradingview.com/u/jiehonglim/
// Moving Averages  everget https://www.tradingview.com/u/everget/
// "Many Moving Averages" script  Fractured https://www.tradingview.com/u/Fractured/
//indicator('SSL Hybrid', overlay=true)
show_Baseline = input(title='Show Baseline', defval=true, group="SSL Hybrid")

show_SSL1 = input(title='Show SSL1', defval=false)
show_atr = input(title='Show ATR bands', defval=true)
//ATR
atrlen = input(14, 'ATR Period')
mult = input.float(1, 'ATR Multi', step=0.1)
smoothing = input.string(title='ATR Smoothing', defval='WMA', options=['RMA', 'SMA', 'EMA', 'WMA'])

ma_function(source, atrlen) =>
    if smoothing == 'RMA'
        ta.rma(source, atrlen)
    else
        if smoothing == 'SMA'
            ta.sma(source, atrlen)
        else
            if smoothing == 'EMA'
                ta.ema(source, atrlen)
            else
                ta.wma(source, atrlen)
atr_slen = ma_function(ta.tr(true), atrlen)
////ATR Up/Low Bands
upper_band = atr_slen * mult + close
lower_band = close - atr_slen * mult

////BASELINE / SSL1 / SSL2 / EXIT MOVING AVERAGE VALUES
maType = input.string(title='SSL1 / Baseline Type', defval='EMA', options=['SMA', 'EMA', 'DEMA', 'TEMA', 'LSMA', 'WMA', 'MF', 'VAMA', 'TMA', 'HMA', 'JMA', 'Kijun v2', 'EDSMA', 'McGinley'])
len = input(title='SSL1 / Baseline Length', defval=30)

SSL2Type = input.string(title='SSL2 / Continuation Type', defval='JMA', options=['SMA', 'EMA', 'DEMA', 'TEMA', 'WMA', 'MF', 'VAMA', 'TMA', 'HMA', 'JMA', 'McGinley'])
len2 = input(title='SSL 2 Length', defval=5)
//
SSL3Type = input.string(title='EXIT Type', defval='HMA', options=['DEMA', 'TEMA', 'LSMA', 'VAMA', 'TMA', 'HMA', 'JMA', 'Kijun v2', 'McGinley', 'MF'])
len3 = input(title='EXIT Length', defval=15)
src = input(title='Source', defval=close)

//
tema(src, len) =>
    ema1 = ta.ema(src, len)
    ema2 = ta.ema(ema1, len)
    ema3 = ta.ema(ema2, len)
    3 * ema1 - 3 * ema2 + ema3
kidiv = input.int(defval=1, maxval=4, title='Kijun MOD Divider')

jurik_phase = input(title='* Jurik (JMA) Only - Phase', defval=3)
jurik_power = input(title='* Jurik (JMA) Only - Power', defval=1)
volatility_lookback = input(10, title='* Volatility Adjusted (VAMA) Only - Volatility lookback length')
//MF
beta = input.float(0.8, minval=0, maxval=1, step=0.1, title='Modular Filter, General Filter Only - Beta')
feedback = input(false, title='Modular Filter Only - Feedback')
z = input.float(0.5, title='Modular Filter Only - Feedback Weighting', step=0.1, minval=0, maxval=1)
//EDSMA
ssfLength = input.int(title='EDSMA - Super Smoother Filter Length', minval=1, defval=20)
ssfPoles = input.int(title='EDSMA - Super Smoother Filter Poles', defval=2, options=[2, 3])

//----

//EDSMA
get2PoleSSF(src, length) =>
    PI = 2 * math.asin(1)
    arg = math.sqrt(2) * PI / length
    a1 = math.exp(-arg)
    b1 = 2 * a1 * math.cos(arg)
    c2 = b1
    c3 = -math.pow(a1, 2)
    c1 = 1 - c2 - c3

    ssf = 0.0
    ssf := c1 * src + c2 * nz(ssf[1]) + c3 * nz(ssf[2])
    ssf

get3PoleSSF(src, length) =>
    PI = 2 * math.asin(1)

    arg = PI / length
    a1 = math.exp(-arg)
    b1 = 2 * a1 * math.cos(1.738 * arg)
    c1 = math.pow(a1, 2)

    coef2 = b1 + c1
    coef3 = -(c1 + b1 * c1)
    coef4 = math.pow(c1, 2)
    coef1 = 1 - coef2 - coef3 - coef4

    ssf = 0.0
    ssf := coef1 * src + coef2 * nz(ssf[1]) + coef3 * nz(ssf[2]) + coef4 * nz(ssf[3])
    ssf

ma(type, src, len) =>
    float result = 0
    if type == 'TMA'
        result := ta.sma(ta.sma(src, math.ceil(len / 2)), math.floor(len / 2) + 1)
        result
    if type == 'MF'
        ts = 0.
        b = 0.
        c = 0.
        os = 0.
        //----
        alpha = 2 / (len + 1)
        a = feedback ? z * src + (1 - z) * nz(ts[1], src) : src
        //----
        b := a > alpha * a + (1 - alpha) * nz(b[1], a) ? a : alpha * a + (1 - alpha) * nz(b[1], a)
        c := a < alpha * a + (1 - alpha) * nz(c[1], a) ? a : alpha * a + (1 - alpha) * nz(c[1], a)
        os := a == b ? 1 : a == c ? 0 : os[1]
        //----
        upper = beta * b + (1 - beta) * c
        lower = beta * c + (1 - beta) * b
        ts := os * upper + (1 - os) * lower
        result := ts
        result
    if type == 'LSMA'
        result := ta.linreg(src, len, 0)
        result
    if type == 'SMA'  // Simple
        result := ta.sma(src, len)
        result
    if type == 'EMA'  // Exponential
        result := ta.ema(src, len)
        result
    if type == 'DEMA'  // Double Exponential
        e = ta.ema(src, len)
        result := 2 * e - ta.ema(e, len)
        result
    if type == 'TEMA'  // Triple Exponential
        e = ta.ema(src, len)
        result := 3 * (e - ta.ema(e, len)) + ta.ema(ta.ema(e, len), len)
        result
    if type == 'WMA'  // Weighted
        result := ta.wma(src, len)
        result
    if type == 'VAMA'  // Volatility Adjusted
        /// Copyright © 2019 to present, Joris Duyck (JD)
        mid = ta.ema(src, len)
        dev = src - mid
        vol_up = ta.highest(dev, volatility_lookback)
        vol_down = ta.lowest(dev, volatility_lookback)
        result := mid + math.avg(vol_up, vol_down)
        result
    if type == 'HMA'  // Hull
        result := ta.wma(2 * ta.wma(src, len / 2) - ta.wma(src, len), math.round(math.sqrt(len)))
        result
    if type == 'JMA'  // Jurik
        /// Copyright © 2018 Alex Orekhov (everget)
        /// Copyright © 2017 Jurik Research and Consulting.
        phaseRatio = jurik_phase < -100 ? 0.5 : jurik_phase > 100 ? 2.5 : jurik_phase / 100 + 1.5
        beta = 0.45 * (len - 1) / (0.45 * (len - 1) + 2)
        alpha = math.pow(beta, jurik_power)
        jma = 0.0
        e0 = 0.0
        e0 := (1 - alpha) * src + alpha * nz(e0[1])
        e1 = 0.0
        e1 := (src - e0) * (1 - beta) + beta * nz(e1[1])
        e2 = 0.0
        e2 := (e0 + phaseRatio * e1 - nz(jma[1])) * math.pow(1 - alpha, 2) + math.pow(alpha, 2) * nz(e2[1])
        jma := e2 + nz(jma[1])
        result := jma
        result
    if type == 'Kijun v2'
        kijun = math.avg(ta.lowest(len), ta.highest(len))  //, (open + close)/2)
        conversionLine = math.avg(ta.lowest(len / kidiv), ta.highest(len / kidiv))
        delta = (kijun + conversionLine) / 2
        result := delta
        result
    if type == 'McGinley'
        mg = 0.0
        mg := na(mg[1]) ? ta.ema(src, len) : mg[1] + (src - mg[1]) / (len * math.pow(src / mg[1], 4))
        result := mg
        result
    if type == 'EDSMA'

        zeros = src - nz(src[2])
        avgZeros = (zeros + zeros[1]) / 2

        // Ehlers Super Smoother Filter 
        ssf = ssfPoles == 2 ? get2PoleSSF(avgZeros, ssfLength) : get3PoleSSF(avgZeros, ssfLength)

        // Rescale filter in terms of Standard Deviations
        stdev = ta.stdev(ssf, len)
        scaledFilter = stdev != 0 ? ssf / stdev : 0

        alpha = 5 * math.abs(scaledFilter) / len

        edsma = 0.0
        edsma := alpha * src + (1 - alpha) * nz(edsma[1])
        result := edsma
        result
    result

///SSL 1 and SSL2
emaHigh = ma(maType, high, len)
emaLow = ma(maType, low, len)

maHigh = ma(SSL2Type, high, len2)
maLow = ma(SSL2Type, low, len2)

///EXIT
ExitHigh = ma(SSL3Type, high, len3)
ExitLow = ma(SSL3Type, low, len3)

///Keltner Baseline Channel
BBMC = ma(maType, close, len)
useTrueRange = input(true)
multy = input.float(0.2, step=0.05, title='Base Channel Multiplier')
Keltma = ma(maType, src, len)
range_1 = useTrueRange ? ta.tr : high - low
rangema = ta.ema(range_1, len)
upperk = Keltma + rangema * multy
lowerk = Keltma - rangema * multy

//Baseline Violation Candle
open_pos = open * 1
close_pos = close * 1
difference = math.abs(close_pos - open_pos)
atr_violation = difference > atr_slen
InRange = upper_band > BBMC and lower_band < BBMC
candlesize_violation = atr_violation and InRange
//plotshape(candlesize_violation, color=color.new(color.white, 0), size=size.tiny, style=shape.diamond, location=location.top, title='Candle Size > 1xATR')


//SSL1 VALUES
Hlv = int(na)
Hlv := close > emaHigh ? 1 : close < emaLow ? -1 : Hlv[1]
sslDown = Hlv < 0 ? emaHigh : emaLow

//SSL2 VALUES
Hlv2 = int(na)
Hlv2 := close > maHigh ? 1 : close < maLow ? -1 : Hlv2[1]
sslDown2 = Hlv2 < 0 ? maHigh : maLow

//EXIT VALUES
Hlv3 = int(na)
Hlv3 := close > ExitHigh ? 1 : close < ExitLow ? -1 : Hlv3[1]
sslExit = Hlv3 < 0 ? ExitHigh : ExitLow
base_cross_Long = ta.crossover(close, sslExit)
base_cross_Short = ta.crossover(sslExit, close)
codiff = base_cross_Long ? 1 : base_cross_Short ? -1 : na

//COLORS
show_color_bar = input(title='Color Bars', defval=true)
color_bar = close > upperk ? #00c3ff : close < lowerk ? #ff0062 : color.gray
color_ssl1 = close > sslDown ? #00c3ff : close < sslDown ? #ff0062 : na

//PLOTS
//plotarrow(codiff, colorup=color.new(#00c3ff, 20), colordown=color.new(#ff0062, 20), title='Exit Arrows', maxheight=20, offset=0)
p1 = plot(show_Baseline ? BBMC : na, color=color_bar, linewidth=4, title='MA Baseline', transp=0)
//DownPlot = plot(show_SSL1 ? sslDown : na, title='SSL1', linewidth=3, color=color_ssl1, transp=10)
barcolor(show_color_bar ? color_bar : na)
//up_channel = plot(show_Baseline ? upperk : na, color=color_bar, title='Baseline Upper Channel')
//low_channel = plot(show_Baseline ? lowerk : na, color=color_bar, title='Basiline Lower Channel')
//fill(up_channel, low_channel, color=color_bar, transp=90)

////SSL2 Continiuation from ATR
atr_crit = input.float(0.9, step=0.1, title='Continuation ATR Criteria')
upper_half = atr_slen * atr_crit + close
lower_half = close - atr_slen * atr_crit
buy_inatr = lower_half < sslDown2
sell_inatr = upper_half > sslDown2
sell_cont = close < BBMC and close < sslDown2
buy_cont = close > BBMC and close > sslDown2
sell_atr = sell_inatr and sell_cont
buy_atr = buy_inatr and buy_cont
atr_fill = buy_atr ? color.green : sell_atr ? color.purple : color.white
//LongPlot = plot(sslDown2, title='SSL2', linewidth=2, color=atr_fill, style=plot.style_circles, transp=0)
//u = plot(show_atr ? upper_band : na, '+ATR', color=color.new(color.white, 80))
//l = plot(show_atr ? lower_band : na, '-ATR', color=color.new(color.white, 80))

//ALERTS
alertcondition(ta.crossover(close, sslDown), title='SSL Cross Alert', message='SSL1 has crossed.')
alertcondition(ta.crossover(close, sslDown2), title='SSL2 Cross Alert', message='SSL2 has crossed.')
alertcondition(sell_atr, title='Sell Continuation', message='Sell Continuation.')
alertcondition(buy_atr, title='Buy Continuation', message='Buy Continuation.')
alertcondition(ta.crossover(close, sslExit), title='Exit Sell', message='Exit Sell Alert.')
alertcondition(ta.crossover(sslExit, close), title='Exit Buy', message='Exit Buy Alert.')
alertcondition(ta.crossover(close, upperk), title='Baseline Buy Entry', message='Base Buy Alert.')
alertcondition(ta.crossover(lowerk, close), title='Baseline Sell Entry', message='Base Sell Alert.')


// Buy only when price action is closed above the EMA and the line is blue color.
SSLHybridEntryLong1 = src > BBMC and color_bar == #00c3ff
// Sell only when action must be closed below the EMA and the line is red color
SSLHybridEntryShort1 = src < BBMC and color_bar == #ff0062


sslHybridNumBarsBackToLookForPullBack = input(4, title="Number Of bars back to look for SSL pullback")

// Buy when Price action must be moving above the EMA and then it has to create a pullback .  The pullback is confirmed when the color changes from blue to gray or from blue  to red.
SSLHybridEntryLong2 = color_bar == #00c3ff  and (f_priorBarsSatisfied(color_bar == #ff0062,sslHybridNumBarsBackToLookForPullBack) or f_priorBarsSatisfied(color_bar == color.gray, sslHybridNumBarsBackToLookForPullBack))
// Sell when Price action must be moving below the EMA and then it has to create a pullback .  The pullback is confirmed when the color changes from red to gray or from red  to blue.
SSLHybridEntryShort2 = color_bar == #ff0062  and (f_priorBarsSatisfied(color_bar == #00c3ff,sslHybridNumBarsBackToLookForPullBack) or f_priorBarsSatisfied(color_bar == color.gray, sslHybridNumBarsBackToLookForPullBack))


SSLHybridEntryLong = SSLHybridEntryLong1 and SSLHybridEntryLong2 
SSLHybridEntryShort = SSLHybridEntryShort1 and SSLHybridEntryShort2 


// Price action must be moving below the EMA and then it has to create a pullback .  The pullback is confirmed when the color changes from red to gray or from red  to blue.
// If the price action is touching the EMA but the line does not change the color, the pullback is not confirmed. 

// Volume Strength Finder by Saravanan_Ragavan
//░░░░░░░░░░░░░░░░░░░░░░░░░░░░░░░░░░░░░░░░░░░░░░░░░░░░░░░░░░░░░░░░░░░░░░░░░░░░░░░░░░░░░░░░░░░░░░░░░░░░░░░░░░░░░░░░░░░░░░░░░░░░░░░░░░░░░░░░░░░░░░░░░░
// This source code is subject to the terms of the Mozilla Public License 2.0 at https://mozilla.org/MPL/2.0/
// © Saravanan_Ragavan

//@version=5
//indicator('Volume Strength Finder', 'VSF', overlay=true)

T1 = time(timeframe.period, '0915-0916:23456')
T2 = time(timeframe.period, '0915-1530:23456')
Y = bar_index
Z1 = ta.valuewhen(T1, bar_index, 0)
L = Y - Z1 + 1


SSPV = 0.00
SSNV = 0.00
pdw = 0.00
ndw = 0.00
total_w = 0.00
for i = 1 to L - 1 by 1
    total_w := high[i] - low[i]
    positive = close[i] - low[i]
    negative = high[i] - close[i]
    pdw := positive / total_w * 100
    ndw := negative / total_w * 100


    SSPV := volume[i] * pdw / 100 + SSPV

    SSNV := volume[i] * ndw / 100 + SSNV
    SSNV


total_v = SSPV + SSNV
Pos = SSPV / total_v * 100
Neg = SSNV / total_v * 100

bgc = SSPV > SSNV ? color.green : SSPV < SSNV ? color.red : color.white
//barcolor(bgc)


var table sDisplay = table.new(position.top_right, 1, 5, bgcolor=color.aqua, frame_width=2, frame_color=color.black)

if barstate.islast
    table.cell(sDisplay, 0, 0, 'Today\'s Volume : ' + str.tostring(total_v), text_color=color.white, text_size=size.large, bgcolor=color.aqua)
    table.cell(sDisplay, 0, 1, 'Buyers Volume: ' + str.tostring(math.round(SSPV)), text_color=color.white, text_size=size.large, bgcolor=color.green)
    table.cell(sDisplay, 0, 2, 'Sellers Volume: ' + str.tostring(math.round(SSNV)), text_color=color.white, text_size=size.large, bgcolor=color.red)
    table.cell(sDisplay, 0, 3, 'Buyers Strength: ' + str.tostring(math.round(Pos)) + '%', text_color=color.white, text_size=size.large, bgcolor=color.green)
    table.cell(sDisplay, 0, 4, 'Sellers Strength: ' + str.tostring(math.round(Neg)) + '%', text_color=color.white, text_size=size.large, bgcolor=color.red)


// Sellers strength above 50% at the time the MACD indiactor issues a new short signal.
VSFShortEntry = math.round(Neg) > 50
// Buyers strength above 50% at the time the MACD indiactor issues a new long signal.
VSFLongEntry = math.round(Pos) > 50


//////////////////////////////////////
//* Put your strategy rules below *//
/////////////////////////////////////

longCondition = SSLHybridEntryLong and VSFLongEntry and MACDBBENtryLong
shortCondition =SSLHybridEntryShort and VSFShortEntry and MACDBBENtryShort

//define as 0 if do not want to use
closeLongCondition = 0
closeShortCondition = 0


// ADX
//░░░░░░░░░░░░░░░░░░░░░░░░░░░░░░░░░░░░░░░░░░░░░░░░░░░░░░░░░░░░░░░░░░░░░░░░░░░░░░░░░░░░░░░░░░░░░░░░░░░░░░░░░░░░░░░░░░░░░░░░░░░░░░░░░░░░░░░░░░░░░░░░░░

adxEnabled = input.bool(defval = false , title = "Average Directional Index (ADX)", tooltip = "", group ="ADX" ) 
adxlen = input(14, title="ADX Smoothing", group="ADX")
adxdilen = input(14, title="DI Length", group="ADX")
adxabove = input(25, title="ADX Threshold", group="ADX")

adxdirmov(len) =>
	adxup = ta.change(high)
	adxdown = -ta.change(low)
	adxplusDM = na(adxup) ? na : (adxup > adxdown and adxup > 0 ? adxup : 0)
	adxminusDM = na(adxdown) ? na : (adxdown > adxup and adxdown > 0 ? adxdown : 0)
	adxtruerange = ta.rma(ta.tr, len)
	adxplus = fixnan(100 * ta.rma(adxplusDM, len) / adxtruerange)
	adxminus = fixnan(100 * ta.rma(adxminusDM, len) / adxtruerange)
	[adxplus, adxminus]
adx(adxdilen, adxlen) =>
	[adxplus, adxminus] = adxdirmov(adxdilen)
	adxsum = adxplus + adxminus
	adx = 100 * ta.rma(math.abs(adxplus - adxminus) / (adxsum == 0 ? 1 : adxsum), adxlen)

adxsig = adxEnabled ? adx(adxdilen, adxlen) : na
isADXEnabledAndAboveThreshold = adxEnabled ? (adxsig > adxabove) : true

//Backtesting Time Period (Input.time not working as expected as of 03/30/2021.  Giving odd start/end dates
//░░░░░░░░░░░░░░░░░░░░░░░░░░░░░░░░░░░░░░░░░░░░░░░░░░░░░░░░░░░░░░░░░░░░░░░░░░░░░░░░░░░░░░░░░░░░░░░░░░░░░░░░░░░░░░░░░░░░░░░░░░░░░░░░░░░░░░░░░░░░░░░░░░
useStartPeriodTime = input.bool(true, 'Start', group='Date Range', inline='Start Period')
startPeriodTime = input(timestamp('1 Jan 2019'), '', group='Date Range', inline='Start Period')
useEndPeriodTime = input.bool(true, 'End', group='Date Range', inline='End Period')
endPeriodTime = input(timestamp('31 Dec 2030'), '', group='Date Range', inline='End Period')

start = useStartPeriodTime ? startPeriodTime >= time : false
end = useEndPeriodTime ? endPeriodTime <= time : false
calcPeriod = true

// Trade Direction 
// ░░░░░░░░░░░░░░░░░░░░░░░░░░░░░░░░░░░░░░░░░░░░░░░░░░░░░░░░░░░░░░░░░░░░░░░░░░░░░░░░░░░░░░░░░░░░░░░░░░░░░░░░░░░░░░░░░░░░░░░░░░░░░░░░░░░░░░░░░░░░░░░░░░
tradeDirection = input.string('Long and Short', title='Trade Direction', options=['Long and Short', 'Long Only', 'Short Only'], group='Trade Direction')

// Percent as Points
// ░░░░░░░░░░░░░░░░░░░░░░░░░░░░░░░░░░░░░░░░░░░░░░░░░░░░░░░░░░░░░░░░░░░░░░░░░░░░░░░░░░░░░░░░░░░░░░░░░░░░░░░░░░░░░░░░░░░░░░░░░░░░░░░░░░░░░░░░░░░░░░░░░░
per(pcnt) =>
    strategy.position_size != 0 ? math.round(pcnt / 100 * strategy.position_avg_price / syminfo.mintick) : float(na)

// Take profit 1
// ░░░░░░░░░░░░░░░░░░░░░░░░░░░░░░░░░░░░░░░░░░░░░░░░░░░░░░░░░░░░░░░░░░░░░░░░░░░░░░░░░░░░░░░░░░░░░░░░░░░░░░░░░░░░░░░░░░░░░░░░░░░░░░░░░░░░░░░░░░░░░░░░░░
tp1 = input.float(title='Take Profit 1 - Target %', defval=1, minval=0.0, step=0.5, group='Take Profit', inline='Take Profit 1')
q1 = input.int(title='% Of Position', defval=100, minval=0, group='Take Profit', inline='Take Profit 1')

// Take profit 2
// ░░░░░░░░░░░░░░░░░░░░░░░░░░░░░░░░░░░░░░░░░░░░░░░░░░░░░░░░░░░░░░░░░░░░░░░░░░░░░░░░░░░░░░░░░░░░░░░░░░░░░░░░░░░░░░░░░░░░░░░░░░░░░░░░░░░░░░░░░░░░░░░░░░
tp2 = input.float(title='Take Profit 2 - Target %', defval=100, minval=0.0, step=0.5, group='Take Profit', inline='Take Profit 2')
q2 = input.int(title='% Of Position', defval=100, minval=0, group='Take Profit', inline='Take Profit 2')

// Take profit 3
// ░░░░░░░░░░░░░░░░░░░░░░░░░░░░░░░░░░░░░░░░░░░░░░░░░░░░░░░░░░░░░░░░░░░░░░░░░░░░░░░░░░░░░░░░░░░░░░░░░░░░░░░░░░░░░░░░░░░░░░░░░░░░░░░░░░░░░░░░░░░░░░░░░░
tp3 = input.float(title='Take Profit 3 - Target %', defval=100, minval=0.0, step=0.5, group='Take Profit', inline='Take Profit 3')
q3 = input.int(title='% Of Position', defval=100, minval=0, group='Take Profit', inline='Take Profit 3')

// Take profit 4
// ░░░░░░░░░░░░░░░░░░░░░░░░░░░░░░░░░░░░░░░░░░░░░░░░░░░░░░░░░░░░░░░░░░░░░░░░░░░░░░░░░░░░░░░░░░░░░░░░░░░░░░░░░░░░░░░░░░░░░░░░░░░░░░░░░░░░░░░░░░░░░░░░░░
tp4 = input.float(title='Take Profit 4 - Target %', defval=100, minval=0.0, step=0.5, group='Take Profit')

/// Stop Loss
// ░░░░░░░░░░░░░░░░░░░░░░░░░░░░░░░░░░░░░░░░░░░░░░░░░░░░░░░░░░░░░░░░░░░░░░░░░░░░░░░░░░░░░░░░░░░░░░░░░░░░░░░░░░░░░░░░░░░░░░░░░░░░░░░░░░░░░░░░░░░░░░░░░░
stoplossPercent = input.float(title='Stop Loss (%)', defval=2, minval=0.01, group='Stop Loss') * 0.01
slLongClose = close < strategy.position_avg_price * (1 - stoplossPercent)
slShortClose = close > strategy.position_avg_price * (1 + stoplossPercent)

/// Leverage
// ░░░░░░░░░░░░░░░░░░░░░░░░░░░░░░░░░░░░░░░░░░░░░░░░░░░░░░░░░░░░░░░░░░░░░░░░░░░░░░░░░░░░░░░░░░░░░░░░░░░░░░░░░░░░░░░░░░░░░░░░░░░░░░░░░░░░░░░░░░░░░░░░░░
leverage = input.float(1, 'Leverage', step=.5, group='Leverage')
contracts = math.min(math.max(.000001, strategy.equity / close * leverage), 1000000000)


/// Trade State Management
// ░░░░░░░░░░░░░░░░░░░░░░░░░░░░░░░░░░░░░░░░░░░░░░░░░░░░░░░░░░░░░░░░░░░░░░░░░░░░░░░░░░░░░░░░░░░░░░░░░░░░░░░░░░░░░░░░░░░░░░░░░░░░░░░░░░░░░░░░░░░░░░░░░░

isInLongPosition = strategy.position_size > 0
isInShortPosition = strategy.position_size < 0

/// ProfitView Alert Syntax String Generation
// ░░░░░░░░░░░░░░░░░░░░░░░░░░░░░░░░░░░░░░░░░░░░░░░░░░░░░░░░░░░░░░░░░░░░░░░░░░░░░░░░░░░░░░░░░░░░░░░░░░░░░░░░░░░░░░░░░░░░░░░░░░░░░░░░░░░░░░░░░░░░░░░░░░

alertSyntaxPrefix = input.string(defval='CRYPTANEX_99FTX_Strategy-Name-Here', title='Alert Syntax Prefix', group='ProfitView Alert Syntax')
alertSyntaxBase = alertSyntaxPrefix + '\n#' + str.tostring(open) + ',' + str.tostring(high) + ',' + str.tostring(low) + ',' + str.tostring(close) + ',' + str.tostring(volume) + ','


/// Trade Execution
// ░░░░░░░░░░░░░░░░░░░░░░░░░░░░░░░░░░░░░░░░░░░░░░░░░░░░░░░░░░░░░░░░░░░░░░░░░░░░░░░░░░░░░░░░░░░░░░░░░░░░░░░░░░░░░░░░░░░░░░░░░░░░░░░░░░░░░░░░░░░░░░░░░░

longConditionCalc = (longCondition and isADXEnabledAndAboveThreshold)
shortConditionCalc = (shortCondition and isADXEnabledAndAboveThreshold)

if calcPeriod
    if longConditionCalc and tradeDirection != 'Short Only' and isInLongPosition == false
        strategy.entry('Long', strategy.long, qty=contracts)

        alert(message=alertSyntaxBase + 'side:long', freq=alert.freq_once_per_bar_close)

    if shortConditionCalc and tradeDirection != 'Long Only' and isInShortPosition == false
        strategy.entry('Short', strategy.short, qty=contracts)

        alert(message=alertSyntaxBase + 'side:short', freq=alert.freq_once_per_bar_close)
    
    //Inspired from Multiple %% profit exits example by adolgo https://www.tradingview.com/script/kHhCik9f-Multiple-profit-exits-example/
    strategy.exit('TP1', qty_percent=q1, profit=per(tp1))
    strategy.exit('TP2', qty_percent=q2, profit=per(tp2))
    strategy.exit('TP3', qty_percent=q3, profit=per(tp3))
    strategy.exit('TP4', profit=per(tp4))

    strategy.close('Long', qty_percent=100, comment='SL Long', when=slLongClose)
    strategy.close('Short', qty_percent=100, comment='SL Short', when=slShortClose)

    strategy.close_all(when=closeLongCondition or closeShortCondition, comment='Close Postion')

/// Dashboard
// ░░░░░░░░░░░░░░░░░░░░░░░░░░░░░░░░░░░░░░░░░░░░░░░░░░░░░░░░░░░░░░░░░░░░░░░░░░░░░░░░░░░░░░░░░░░░░░░░░░░░░░░░░░░░░░░░░░░░░░░░░░░░░░░░░░░░░░░░░░░░░░░░░░
// Inspired by https://www.tradingview.com/script/uWqKX6A2/ - Thanks VertMT

// showDashboard = input.bool(group="Dashboard", title="Show Dashboard", defval=true)

// f_fillCell(_table, _column, _row, _title, _value, _bgcolor, _txtcolor) =>
//     _cellText = _title + "\n" + _value
//     table.cell(_table, _column, _row, _cellText, bgcolor=_bgcolor, text_color=_txtcolor, text_size=size.auto)

// // Draw dashboard table
// if showDashboard
//     var bgcolor = color.new(color.black,0)
    
//     // Keep track of Wins/Losses streaks
//     newWin  = (strategy.wintrades  > strategy.wintrades[1]) and (strategy.losstrades == strategy.losstrades[1]) and (strategy.eventrades == strategy.eventrades[1])
//     newLoss = (strategy.wintrades == strategy.wintrades[1]) and (strategy.losstrades  > strategy.losstrades[1]) and (strategy.eventrades == strategy.eventrades[1])

//     varip int winRow     = 0
//     varip int lossRow    = 0
//     varip int maxWinRow  = 0
//     varip int maxLossRow = 0

//     if newWin
//         lossRow := 0
//         winRow := winRow + 1
//     if winRow > maxWinRow
//         maxWinRow := winRow
        
//     if newLoss
//         winRow := 0
//         lossRow := lossRow + 1
//     if lossRow > maxLossRow
//         maxLossRow := lossRow


//     // Prepare stats table
//     var table dashTable = table.new(position.bottom_right, 1, 15, border_width=1)
    
   
//     if barstate.islastconfirmedhistory
//         // Update table
//         dollarReturn = strategy.netprofit
//         f_fillCell(dashTable, 0, 0, "Start:", str.format("{0,date,long}", strategy.closedtrades.entry_time(0)) , bgcolor, color.white) // + str.format(" {0,time,HH:mm}", strategy.closedtrades.entry_time(0)) 
//         f_fillCell(dashTable, 0, 1, "End:", str.format("{0,date,long}", strategy.opentrades.entry_time(0)) , bgcolor, color.white) // + str.format(" {0,time,HH:mm}", strategy.opentrades.entry_time(0))
//         _profit = (strategy.netprofit / strategy.initial_capital) * 100
//         f_fillCell(dashTable, 0, 2, "Net Profit:", str.tostring(_profit, '##.##') + "%", _profit > 0 ? color.green : color.red, color.white)
//         _numOfDaysInStrategy = (strategy.opentrades.entry_time(0) - strategy.closedtrades.entry_time(0)) / (1000 * 3600 * 24)
//         f_fillCell(dashTable, 0, 3, "Percent Per Day", str.tostring(_profit / _numOfDaysInStrategy, '#########################.#####')+"%", _profit > 0 ? color.green : color.red, color.white)
//         _winRate = ( strategy.wintrades / strategy.closedtrades ) * 100
//         f_fillCell(dashTable, 0, 4, "Percent Profitable:", str.tostring(_winRate, '##.##') + "%", _winRate < 50 ? color.red : _winRate < 75 ? #999900 : color.green, color.white)
//         f_fillCell(dashTable, 0, 5, "Profit Factor:", str.tostring(strategy.grossprofit / strategy.grossloss,  '##.###'), strategy.grossprofit > strategy.grossloss ? color.green : color.red, color.white)
//         f_fillCell(dashTable, 0, 6, "Total Trades:", str.tostring(strategy.closedtrades), bgcolor, color.white)
//         f_fillCell(dashTable, 0, 8, "Max Wins In A Row:", str.tostring(maxWinRow, '######') , bgcolor, color.white)
//         f_fillCell(dashTable, 0, 9, "Max Losses In A Row:", str.tostring(maxLossRow, '######') , bgcolor, color.white)