Strategi mengikuti tren berdasarkan beberapa indikator
Ringkasan
Strategi ini disebutStrategi pelacakan tren dalam kombinasi multi-indikator(Multi-Indicator Trend Tracking Strategy), yang menggunakan indikator Fisher transformasi, rata-rata bergerak berbobot ((WMA), indikator relatif kuat ((RSI) dan garis rata-rata ((OBV) beberapa indikator, untuk menentukan arah tren pasar, untuk mencapai trend track perdagangan.
Prinsip Strategi
- Indikator perubahan Fisher menilai tren dan intensitas perubahan harga. Sinyal perdagangan dikirimkan ketika 4 garis Fisher berubah warna secara bersamaan.
- WMA menilai arah tren utama. RSI memfilter sinyal palsu.
- Indikator OBV digunakan untuk mengkonfirmasi tren.
Secara khusus, indikator perubahan Fisher terdiri dari 4 garis 1, 2, 4 dan 8. Pada saat 4 garis berputar ke atas kehijauan menghasilkan sinyal positif, dan 4 garis berputar ke bawah kehijauan menghasilkan sinyal negatif. WMA menilai arah tren besar, jika indikator naik, maka dianggap sebagai bullish, dan jika indikator turun, maka dianggap sebagai bearish. OBV digunakan untuk mengkonfirmasi arah tren.
Analisis Keunggulan
Strategi ini memiliki keuntungan sebagai berikut:
- Indikator Fisher Conversion memiliki kebijaksanaan yang kuat, dan ketika 4 garis Fisher berubah warna pada saat yang sama, kemungkinan besar terjadi pembalikan tren.
- WMA menilai arah tren utama dan menghindari perdagangan berlawanan arah.
- Indikator OBV mengkonfirmasi tren, menghindari terobosan palsu di pasar tanpa tren.
- Indikator RSI memfilter sinyal palsu untuk memastikan keandalan sinyal.
Aplikasi kombinasi dari beberapa indikator, yang memastikan akurasi dan keandalan sinyal perdagangan, serta kemampuan untuk melacak tren, dapat memberikan efek strategi yang lebih baik.
Analisis risiko
Strategi ini juga memiliki beberapa risiko:
- Jika terjadi perombakan, garis Fisher mudah menghasilkan sinyal palsu. Dalam hal ini harus bergantung pada filter RSI.
- Pengaturan parameter WMA yang tidak tepat juga dapat mempengaruhi keakuratan penilaian.
- Indikator konversi Fisher lebih buruk dalam menilai kondisi garis super pendek.
- Jika ada kabel yang rusak, strategi ini akan menghasilkan kerugian besar.
Untuk mengurangi risiko, dapat disesuaikan dengan parameter RSI, mengoptimalkan parameter siklus WMA.
Arah optimasi
Strategi ini dapat dioptimalkan dengan cara:
- Dapat menguji efek strategi di bawah parameter siklus yang berbeda untuk menemukan kombinasi parameter yang optimal.
- Menambahkan mekanisme stop loss. Stop loss ketika kerugian mencapai proporsi tertentu.
- Parameter indikator Fisher Conversion disesuaikan lebih lanjut berdasarkan hasil pengukuran ulang untuk menemukan kombinasi parameter yang paling akurat untuk menentukan indikator tersebut.
- Cobalah untuk menambahkan filter indikator lainnya, seperti indikator kekuatan, kelemahan, dan bias.
- Uji pengaturan ukuran posisi yang berbeda.
Meringkaskan
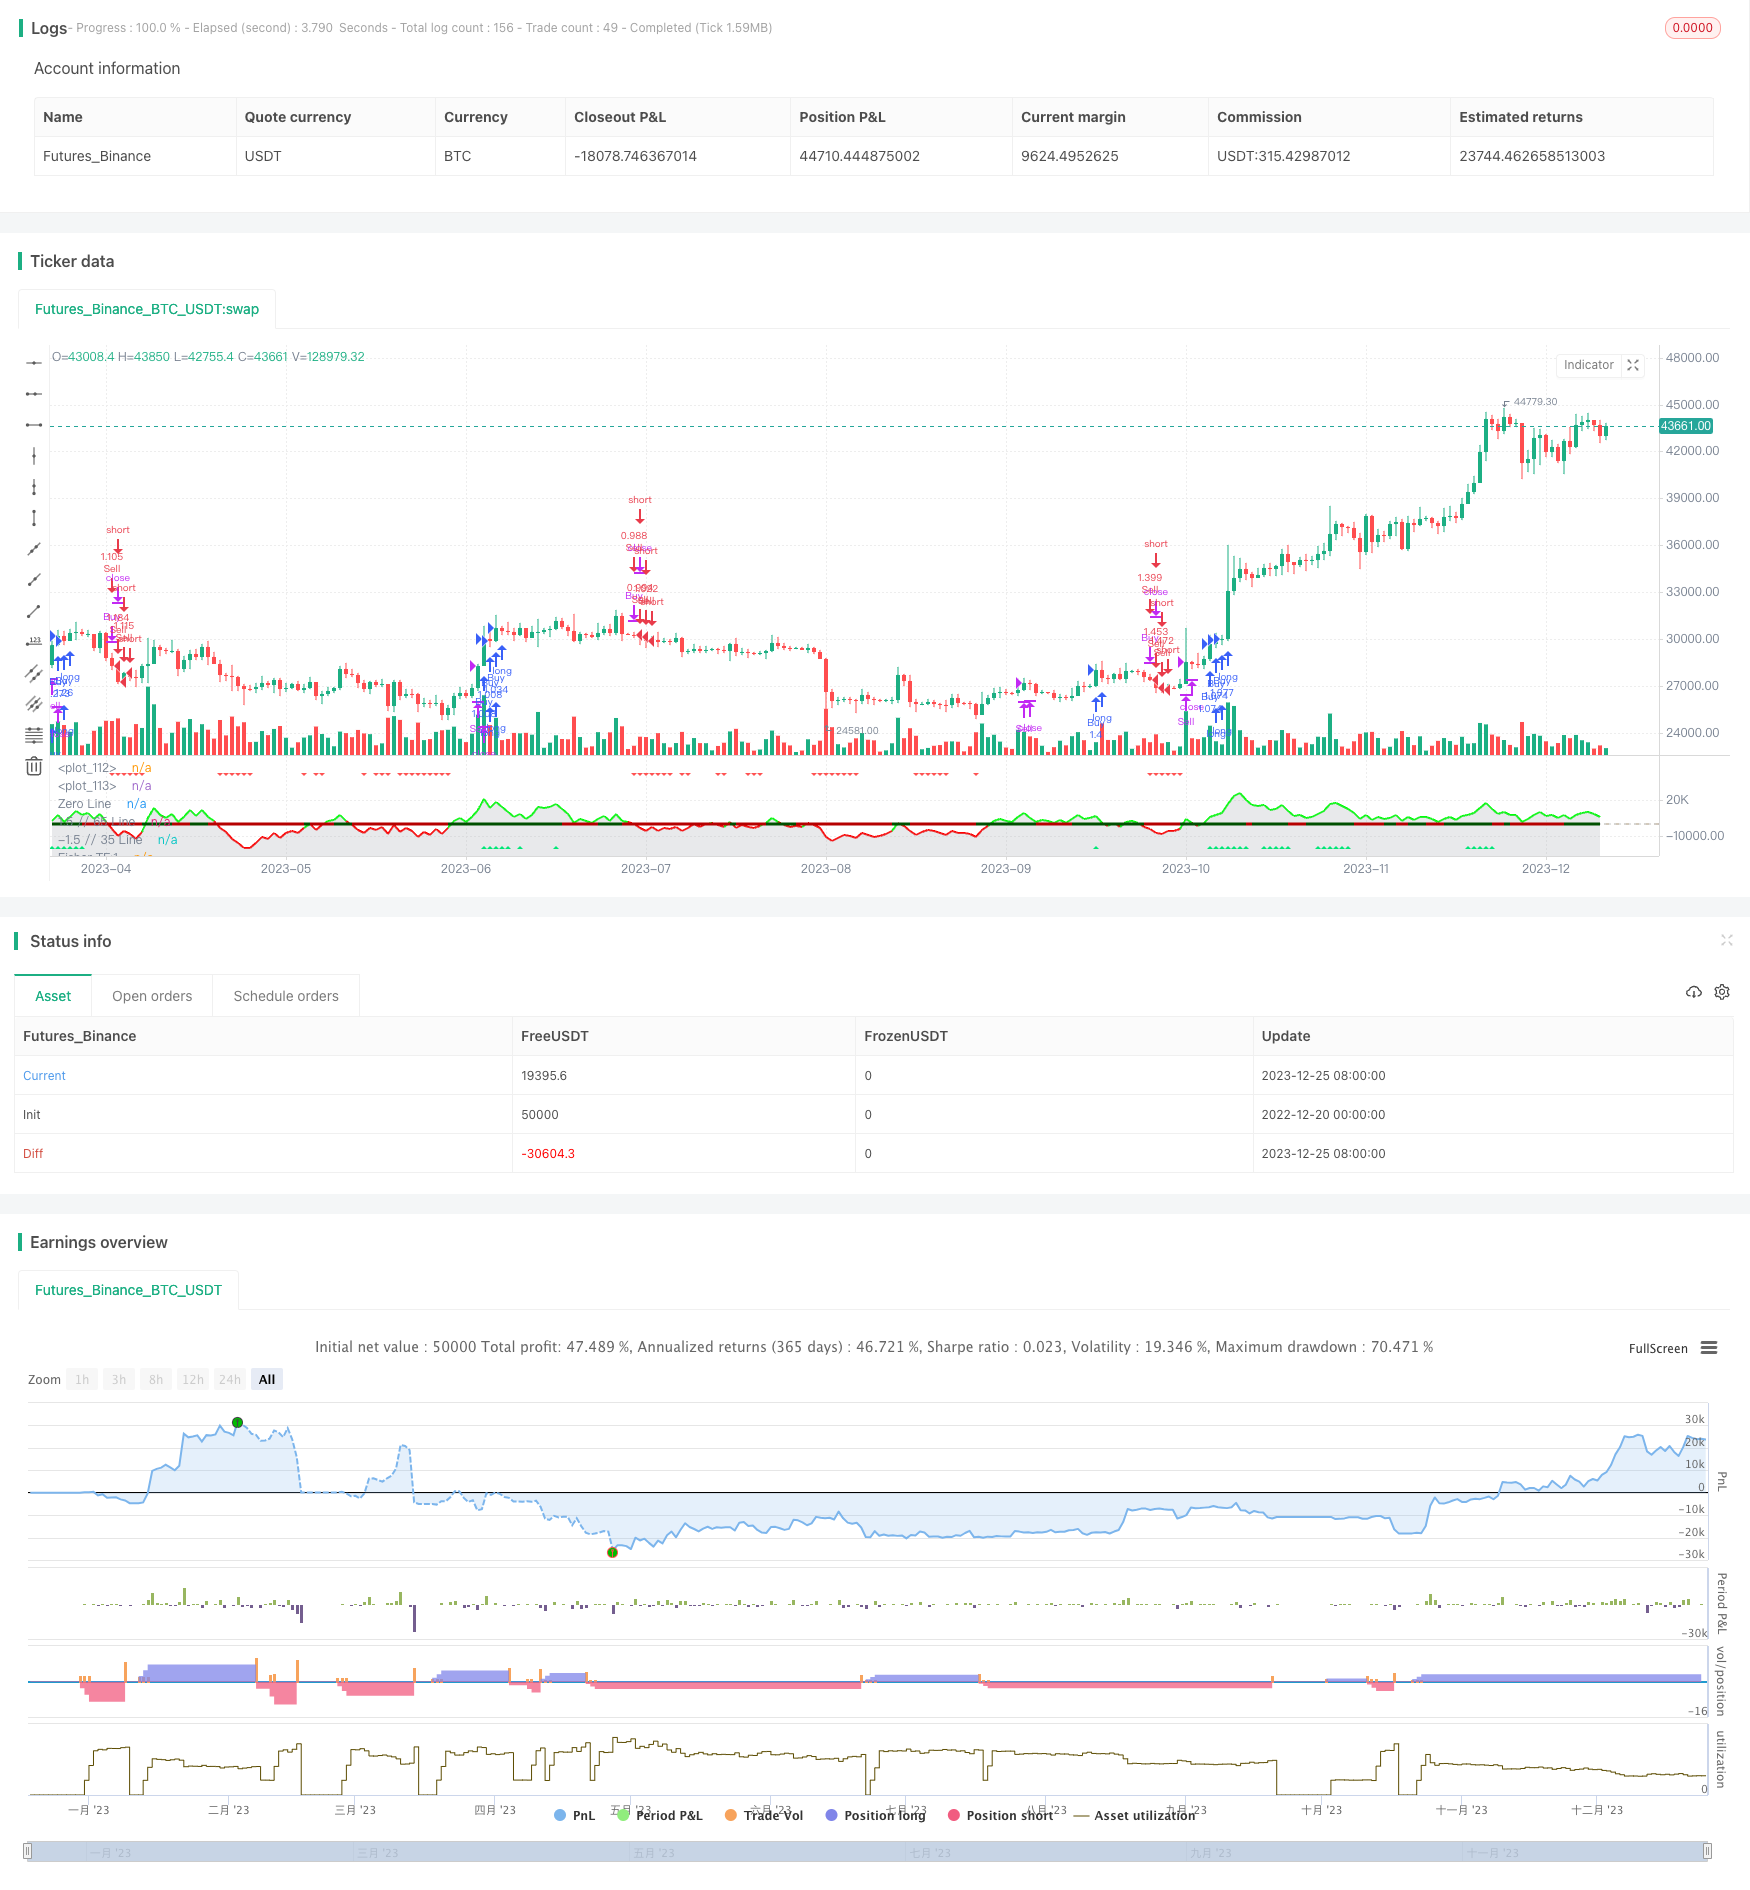
Strategi ini menggunakan indikator perubahan Fisher, indikator WMA, indikator OBV, dan indikator RSI untuk menilai arah tren pasar. Sinyal penilaian akurat, kemampuan konfirmasi yang kuat, dan kemampuan untuk mengunci tren secara efektif. Dengan mengoptimalkan parameter, strategi dapat meningkatkan faktor keuntungan lebih lanjut.
/*backtest
start: 2022-12-20 00:00:00
end: 2023-12-26 00:00:00
period: 1d
basePeriod: 1h
exchanges: [{"eid":"Futures_Binance","currency":"BTC_USDT"}]
*/

//@version=5
//author Sdover0123
strategy(title='FTR, WMA, OBV & RSI Strat', shorttitle='FTR WMA, OBV, RSI',overlay=false, default_qty_type=strategy.percent_of_equity, initial_capital = 100, default_qty_value=100, commission_value = 0.06, pyramiding = 3)
Len = input.int(10, minval=1, group ="Fisher Transform")
mult1 = input.int(1, minval=1, group ="Fisher Transform")
mult2 = input.int(2, minval=1, group ="Fisher Transform")
mult3 = input.int(4, minval=1, group ="Fisher Transform")
mult4 = input.int(8, minval=1, group ="Fisher Transform")
fish(Length, timeMultiplier) =>
    var nValue1 = 0.0
    var nValue2 = 0.0
    var nFish = 0.0
    xHL2 = hl2
    xMaxH = ta.highest(xHL2, Length * timeMultiplier)
    xMinL = ta.lowest(xHL2, Length * timeMultiplier)
    nValue1 := 0.33 * 2 * ((xHL2 - xMinL) / (xMaxH - xMinL) - 0.5) + 0.67 * nz(nValue1[1])
    if nValue1 > .99
        nValue2 := .999
        nValue2
    else if nValue1 < -.99
        nValue2 := -.999
        nValue2
    else
        nValue2 := nValue1
        nValue2
    nFish := 0.5 * math.log((1 + nValue2) / (1 - nValue2)) + 0.5 * nz(nFish[1])
    nFish
Fisher1 = fish(Len, mult1)
Fisher2 = fish(Len, mult2)
Fisher4 = fish(Len, mult3)
Fisher8 = fish(Len, mult4)

rsiLength = input.int(14, minval=1, group ="Moving Averages")
rsiVal = (ta.rsi(close, rsiLength) - 50) / 10
avg = strategy.position_avg_price

wma(source, length) =>
    sum = 0.0
    for i = 0 to length - 1
        sum := sum + source[i] * (length - i)
    wma = sum / (length * (length + 1) / 2)
    wma

wmaLength = input.int(10, "WMA Length", minval=1, group ="Moving Averages")
wmaClose = wma(close, wmaLength)
// Determine if WMA is bullish or bearish
isWmaBullish = wmaClose > wmaClose[1]
isWmaBearish = wmaClose < wmaClose[1]

//OBV
src = close
length = input.int(20, title="OBV Length", group="On-Balance Volume")
obv1(src) =>
    change_1 = ta.change(src)
    ta.cum(ta.change(src) > 0 ? volume : change_1 < 0 ? -volume : 0 * volume)*0.01
os = obv1(src)
obv_osc = os - ta.ema(os, length)
obc_color = (obv_osc > 0 ? color.rgb(0, 255, 8) : color.rgb(255, 0, 0))
plot(obv_osc, color=obc_color, style=plot.style_line, title='OBV-Points', linewidth=2)
plot(obv_osc, color=color.new(#b2b5be, 70), title='OBV', style=plot.style_area)
obvBullFilter = input.float(0.1, minval = 0, maxval = 5, step = 0.01, title ="OBV Bullish minimum value", group="On-Balance Volume")
obvBearFilter = input.float(-0.1, minval = -5, maxval = 0, step = 0.01, title ="OBV Bearish minimum value", group="On-Balance Volume")
obvBull = obv_osc > obvBullFilter
obvBear = obv_osc < obvBearFilter

// Add buy/sell signals
ReversalFilterDown = input.float(-0.7, 'Reversal Down TP Filter', -4, 4, step = 0.01, group = "RSI Level Filters", tooltip = "This is defined by taking the RSI value -50 and /10. When all Fisher lines are changing colour, this will SL/TP the long")
ReversalFilterUp = input.float(0.7, 'Reversal Up TP Filter', -4, 4, step = 0.01, group = "RSI Level Filters", tooltip = "This is defined by taking the RSI value -50 and /10. When all Fisher lines are changing colour, this will SL/TP the short")
RSILevelBuyFilter = input.float(1.66, 'RSI Level Buy Filter', -4, 4, step = 0.01, group = "RSI Level Filters", tooltip = "This is defined by taking the RSI value -50 and /10. Consider negative values")
RSILevelSellFilter = input.float(1, 'RSI Level Sell Filter', -4, 4, step = 0.01, group = "RSI Level Filters", tooltip = "This is defined by taking the RSI value -50 and /10. Consider negative values")
//buys - if breaking out and all Fisher are green and RSI filter value is met
buySignal = Fisher1 > Fisher1[1] and Fisher2 > Fisher2[1] and Fisher4 > Fisher4[1] and Fisher8 > Fisher8[1] and rsiVal > RSILevelBuyFilter and isWmaBullish and obvBull
ReversalUp = Fisher1 > Fisher1[1] and Fisher2 > Fisher2[1] and Fisher4 > Fisher4[1] and Fisher8 > Fisher8[1] and rsiVal > ReversalFilterUp
//sells - if breaking down and all Fisher are green and RSI filter value is met
sellSignal = Fisher1 < Fisher1[1] and Fisher2 < Fisher2[1] and Fisher4 < Fisher4[1] and Fisher8 < Fisher8[1] and rsiVal < RSILevelSellFilter and isWmaBearish and obvBear
ReversalDown = Fisher1 < Fisher1[1] and Fisher2 < Fisher2[1] and Fisher4 < Fisher4[1] and Fisher8 < Fisher8[1] and rsiVal < ReversalFilterDown


// Buy and Sell conditions
if buySignal and time>timestamp(2022, 06, 01, 09, 30) and barstate.isconfirmed
    strategy.close("Sell", comment = "Close Short")
    strategy.entry("Buy", strategy.long, comment = "Long")

if sellSignal and time>timestamp(2022, 06, 01, 09, 30) and barstate.isconfirmed
    strategy.close("Buy", comment = "Close Long")
    strategy.entry("Sell", strategy.short, comment = "Short")

if ReversalDown
    strategy.close("Buy", comment = "Close Long")

if ReversalUp
    strategy.close("Sell", comment = "Close Short")

//Plotting
//Fisher
plot(Fisher1, color=Fisher1 > nz(Fisher1[1]) ? color.green : color.rgb(255, 0, 0), title='Fisher TF:1')
plot(Fisher2, color=Fisher2 > nz(Fisher2[1]) ? color.green : color.rgb(255, 0, 0), title='Fisher TF:1', linewidth=2)
plot(Fisher4, color=Fisher4 > nz(Fisher4[1]) ? #008000 : #b60000, title='Fisher TF:1', linewidth=3)
plot(Fisher8, color=Fisher8 > nz(Fisher8[1]) ? #004f00 : #b60000, title='Fisher TF:1', linewidth=3)
//RSI
plot(rsiVal, color=rsiVal < 0 ? color.purple : color.yellow, linewidth=2, title='RSI')

//WMA
plot(isWmaBullish ? -2 : na, color=color.rgb(76, 175, 79, 20), linewidth=3, style=plot.style_linebr, title="WMA Bullish")
plot(isWmaBearish ? -2 : na, color=color.rgb(255, 82, 82, 20), linewidth=3, style=plot.style_linebr, title="WMA Bearish")

//Buy/Sell Signals
plotshape(buySignal, title='Buy Signal', location=location.bottom, color=color.new(color.lime, 0), style=shape.triangleup, size=size.small)
plotshape(sellSignal, title='Sell Signal', location=location.top, color=color.new(color.red, 0), style=shape.triangledown, size=size.small)

//Orientation
hline(RSILevelBuyFilter, color=color.rgb(25, 36, 99, 20), linestyle=hline.style_dotted, linewidth=2)
hline(RSILevelSellFilter, color=color.rgb(111, 27, 27, 20), linestyle=hline.style_dotted, linewidth=2)
hline(0, color=color.rgb(181, 166, 144, 39), linestyle=hline.style_dashed, linewidth=2, title = "Zero Line")
hline(1.5, color=color.rgb(217, 219, 220, 50), linestyle=hline.style_dotted, linewidth=2, title = "1.5 // 65 Line")
hline(-1.5, color=color.rgb(217, 219, 220, 50), linestyle=hline.style_dotted, linewidth=2, title = "-1.5 // 35 Line")