Strategi Mengikuti Tren dengan Rata-rata Pergerakan Ganda dan Crossover StochRSI
Ringkasan
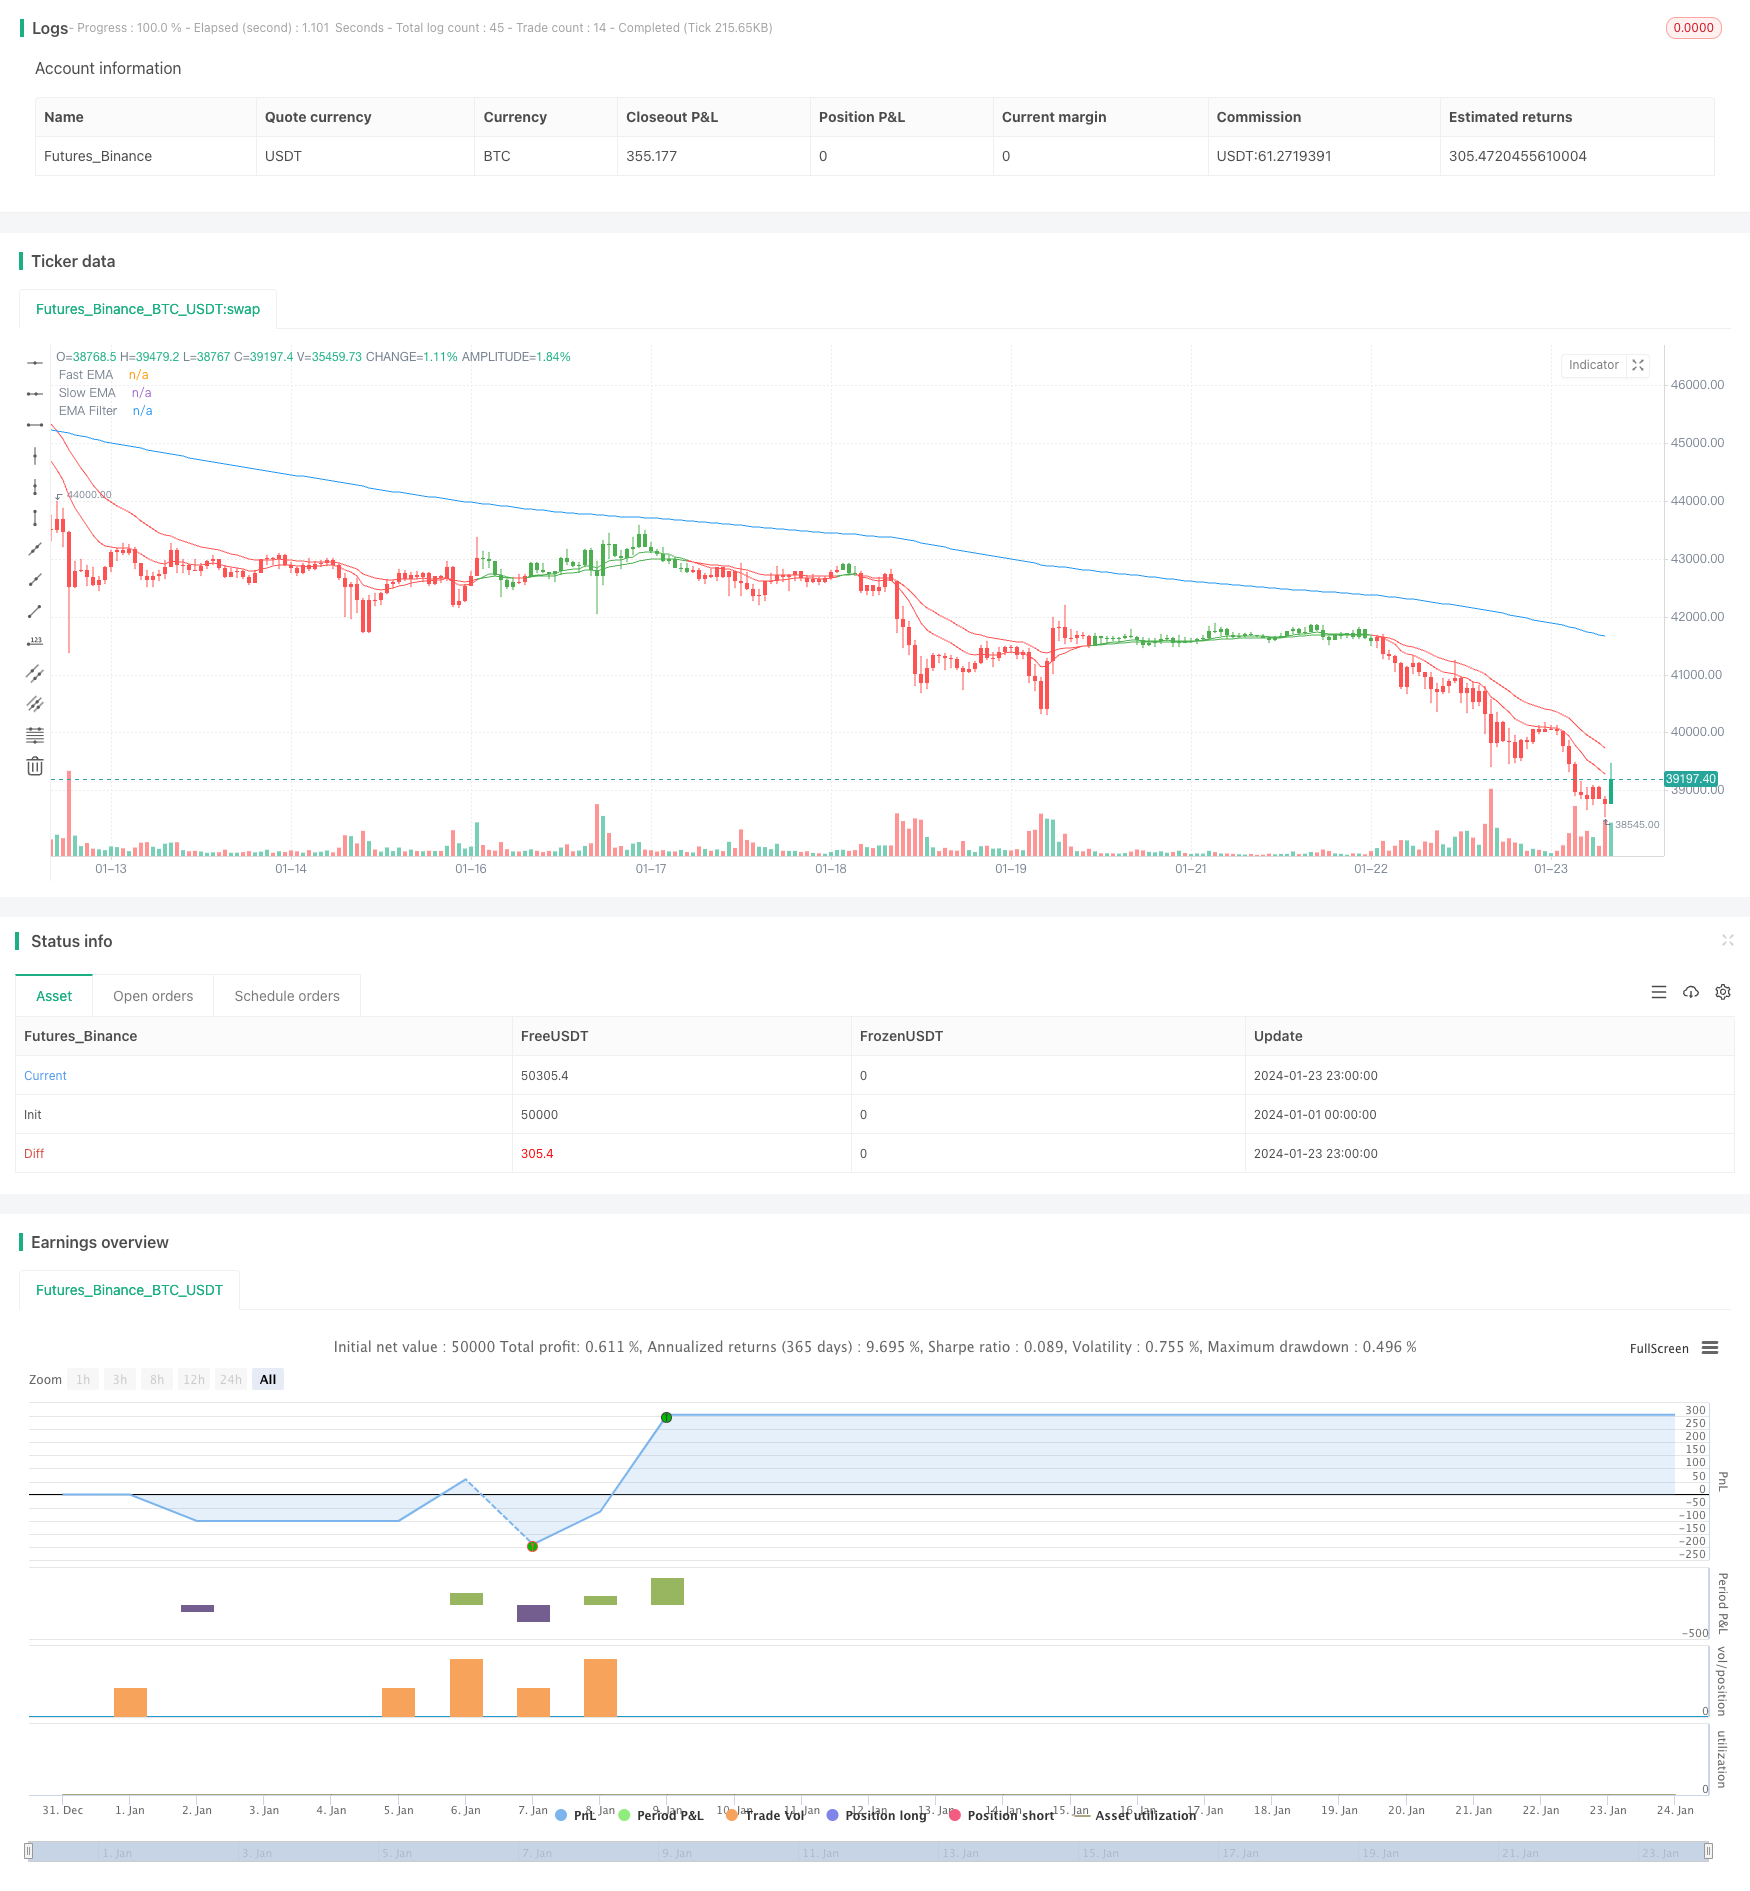
Strategi ini digunakan untuk mengidentifikasi arah tren dan titik masuk dengan kombinasi dua rata-rata bergerak dan indikator StochRSI. Fitur utama adalah masuk ke pasar pada tahap awal tren, sementara fitur overbought dan oversold dari indikator StochRSI digunakan untuk menyaring terobosan palsu.
Prinsip Strategi
Strategi ini menggunakan fast moving average EMA ((12) dan slow moving average EMA ((25) untuk membangun sistem moving average ganda, yang menghasilkan sinyal beli ketika garis cepat melintasi garis lambat, dan menghasilkan sinyal jual ketika garis cepat melintasi garis lambat, untuk menentukan arah tren besar.
Strategi ini juga digabungkan dengan perpotongan indikator StochRSI untuk lebih mengidentifikasi waktu masuk. Indikator StochRSI digabungkan dengan indikator acak KDJ dan RSI, yang menghasilkan sinyal beli ketika garis K melewati garis D dari zona oversold, dan sinyal jual ketika garis K melewati garis D dari zona oversold.
Strategi ini hanya akan membuka posisi jika ada sinyal dari Moving Average dan StochRSI. Dengan demikian, dapat secara efektif menyaring beberapa false breakout dan menghindari perdagangan yang tidak valid.
Analisis Keunggulan
Keuntungan terbesar dari strategi ini adalah kemampuan untuk menentukan arah tren dan titik masuk potensial lebih awal. Sistem moving average dapat menghasilkan sinyal pada awal tren, dan penambahan indikator StochRSI dapat secara efektif memfilter terobosan palsu dan menghindari perdagangan yang salah.
Selain itu, strategi ini menggabungkan analisis tren dan penilaian overbought dan oversold, dengan keuntungan dari pelacakan tren dan membalikkan perdagangan. Strategi ini dapat menangkap semua peluang, baik untuk melacak tren atau untuk membeli di bawah dan menjual di atas.
Analisis risiko
Risiko utama dari strategi ini adalah keterlambatan sistem moving average itu sendiri. Sistem moving average ganda sering berlarut-larut untuk menghasilkan sinyal ketika situasi tiba-tiba berubah secara dramatis, sehingga strategi dapat kehilangan waktu masuk yang optimal.
Selain itu, indikator StochRSI juga dapat menghasilkan sinyal yang salah, yang memicu perdagangan yang tidak perlu. K-line dan D-line dapat sering berselingkuh, terutama pada saat pasar bergejolak, yang membawa risiko terlalu banyak operasi tidak efektif pada strategi.
Arah optimasi
Optimalisasi strategi ini berfokus pada beberapa hal:
Mengatur parameter dari moving average ganda untuk menggunakan periode rata-rata yang lebih baik untuk menangkap tren;
Mengoptimalkan parameter StochRSI untuk membuat kriteria penilaian overbought dan oversold yang lebih masuk akal;
Meningkatkan jumlah pesanan atau menyesuaikan level stop loss untuk mengejar tingkat pengembalian yang lebih tinggi;
Ini dikombinasikan dengan indikator lain sebagai kondisi penyaringan untuk mengurangi sinyal yang tidak valid.
Meringkaskan
Strategi ini secara keseluruhan sangat cocok untuk menangkap tren garis tengah dan panjang, dan memiliki potensi keuntungan yang besar pada awal tren. Selain itu, dalam kombinasi dengan indikator StochRSI sebagai penilaian tambahan, dapat secara efektif memfilter sinyal yang menyesatkan dan menghindari kerugian yang tidak perlu. Dengan pengoptimalan parameter dan perbaikan manajemen risiko, strategi ini dapat menjadi alat yang kuat untuk mendapatkan keuntungan yang stabil.
/*backtest
start: 2024-01-01 00:00:00
end: 2024-01-24 00:00:00
period: 1h
basePeriod: 15m
exchanges: [{"eid":"Futures_Binance","currency":"BTC_USDT"}]
*/

// This source code is subject to the terms of the Mozilla Public License 2.0 at https://mozilla.org/MPL/2.0/
// © btc_charlie / @TheParagonGrp

//@version=5
strategy('BlackBit Trader XO Macro Trend Scanner', overlay=true)

// Variables
var ok = 0
var countBuy = 0
var countSell = 0
src = input(close, title='OHLC Type')
i_fastEMA = input(12, title='Fast EMA')
i_slowEMA = input(25, title='Slow EMA')
i_defEMA = input(25, title='Consolidated EMA')

// Allow the option to show single or double EMA
i_bothEMAs = input(title='Show Both EMAs', defval=true)

// Define EMAs
v_fastEMA = ta.ema(src, i_fastEMA)
v_slowEMA = ta.ema(src, i_slowEMA)
v_biasEMA = ta.ema(src, i_defEMA)

// Color the EMAs
emaColor = v_fastEMA > v_slowEMA ? color.green : v_fastEMA < v_slowEMA ? color.red : #FF530D

// Plot EMAs
plot(i_bothEMAs ? na : v_biasEMA, color=emaColor, linewidth=3, title='Consolidated EMA')
plot(i_bothEMAs ? v_fastEMA : na, title='Fast EMA', color=emaColor)
plot(i_bothEMAs ? v_slowEMA : na, title='Slow EMA', color=emaColor)

// Colour the bars
buy = v_fastEMA > v_slowEMA
sell = v_fastEMA < v_slowEMA

if buy
    countBuy += 1
    countBuy

if buy
    countSell := 0
    countSell

if sell
    countSell += 1
    countSell

if sell
    countBuy := 0
    countBuy

buysignal = countBuy < 2 and countBuy > 0 and countSell < 1 and buy and not buy[1]
sellsignal = countSell > 0 and countSell < 2 and countBuy < 1 and sell and not sell[1]

barcolor(buysignal ? color.green : na)
barcolor(sellsignal ? color.red : na)


bull = countBuy > 1
bear = countSell > 1

barcolor(bull ? color.green : na)
barcolor(bear ? color.red : na)

// Set Alerts

// alertcondition(ta.crossover(v_fastEMA, v_slowEMA), title='Bullish EMA Cross', message='Bullish EMA crossover')
// alertcondition(ta.crossunder(v_fastEMA, v_slowEMA), title='Bearish EMA Cross', message='Bearish EMA Crossover')

// Stoch RSI code

smoothK = input.int(3, 'K', minval=1)
smoothD = input.int(3, 'D', minval=1)
lengthRSI = input.int(14, 'RSI Length', minval=1)
lengthStoch = input.int(14, 'Stochastic Length', minval=1)

rsi1 = ta.rsi(src, lengthRSI)
k = ta.sma(ta.stoch(rsi1, rsi1, rsi1, lengthStoch), smoothK)
d = ta.sma(k, smoothD)

bandno0 = input.int(80, minval=1, title='Upper Band', group='Bands (change this instead of length in Style for Stoch RSI colour to work properly)')
bandno2 = input.int(50, minval=1, title='Middle Band', group='Bands (change this instead of length in Style for Stoch RSI colour to work properly)')
bandno1 = input.int(20, minval=1, title='Lower Band', group='Bands (change this instead of length in Style for Stoch RSI colour to work properly)')

// Alerts

crossoverAlertBgColourMidOnOff = input.bool(title='Crossover Alert Background Colour (Middle Level) [ON/OFF]', group='Crossover Alerts', defval=false)
crossoverAlertBgColourOBOSOnOff = input.bool(title='Crossover Alert Background Colour (OB/OS Level) [ON/OFF]', group='Crossover Alerts', defval=false)

crossoverAlertBgColourGreaterThanOnOff = input.bool(title='Crossover Alert >input [ON/OFF]', group='Crossover Alerts', defval=false)
crossoverAlertBgColourLessThanOnOff = input.bool(title='Crossover Alert <input [ON/OFF]', group='Crossover Alerts', defval=false)

maTypeChoice = input.string('EMA', title='MA Type', group='Moving Average', options=['EMA', 'WMA', 'SMA', 'None'])
maSrc = input.source(close, title='MA Source', group='Moving Average')
maLen = input.int(200, minval=1, title='MA Length', group='Moving Average')

maValue = if maTypeChoice == 'EMA'
    ta.ema(maSrc, maLen)
else if maTypeChoice == 'WMA'
    ta.wma(maSrc, maLen)
else if maTypeChoice == 'SMA'
    ta.sma(maSrc, maLen)
else
    0

crossupCHECK = maTypeChoice == 'None' or open > maValue and maTypeChoice != 'None'
crossdownCHECK = maTypeChoice == 'None' or open < maValue and maTypeChoice != 'None'

crossupalert = crossupCHECK and ta.crossover(k, d) and (k < bandno2 or d < bandno2)
crossdownalert = crossdownCHECK and ta.crossunder(k, d) and (k > bandno2 or d > bandno2)
crossupOSalert = crossupCHECK and ta.crossover(k, d) and (k < bandno1 or d < bandno1)
crossdownOBalert = crossdownCHECK and ta.crossunder(k, d) and (k > bandno0 or d > bandno0)

aboveBandalert = ta.crossunder(k, bandno0)
belowBandalert = ta.crossover(k, bandno1)

bgcolor(color=crossupalert and crossoverAlertBgColourMidOnOff ? #4CAF50 : crossdownalert and crossoverAlertBgColourMidOnOff ? #FF0000 : na, title='Crossover Alert Background Colour (Middle Level)', transp=70)
bgcolor(color=crossupOSalert and crossoverAlertBgColourOBOSOnOff ? #fbc02d : crossdownOBalert and crossoverAlertBgColourOBOSOnOff ? #000000 : na, title='Crossover Alert Background Colour (OB/OS Level)', transp=70)

bgcolor(color=aboveBandalert and crossoverAlertBgColourGreaterThanOnOff ? #ff0014 : crossdownalert and crossoverAlertBgColourMidOnOff ? #FF0000 : na, title='Crossover Alert - K > Upper level', transp=70)
bgcolor(color=belowBandalert and crossoverAlertBgColourLessThanOnOff ? #4CAF50 : crossdownalert and crossoverAlertBgColourMidOnOff ? #FF0000 : na, title='Crossover Alert - K < Lower level', transp=70)

// alertcondition(crossupalert or crossdownalert, title='Stoch RSI Crossover', message='STOCH RSI CROSSOVER')

// Calculate start/end date and time condition
startDate = input(timestamp('2000-12-24T00:00:00'),group = "---------TIME RANGE SETTINGS---------")
finishDate = input(timestamp('2029-02-26T00:00:00'),group = "---------TIME RANGE SETTINGS---------")
time_cond = true


//ema filter
emalen = input(200,"EMA Filter Length",group = "EMA FILTER SETTINGS")
emasource = input(close,"EMA Filter Source",group = "EMA FILTER SETTINGS")
ema_fil = ta.ema(emasource,emalen)
plot(ema_fil,"EMA Filter")

//macd
fast_length = input(title="Fast Length", defval=26,group = "MACD FILTER SETTINGS")
slow_length = input(title="Slow Length", defval=100,group = "MACD FILTER SETTINGS")
src_macd = input(title="Source", defval=close,group = "MACD FILTER SETTINGS")
signal_length = input.int(title="Signal Smoothing",  minval = 1, maxval = 50, defval = 9,group = "MACD FILTER SETTINGS")
sma_source = input.string(title="Oscillator MA Type",  defval="EMA", options=["SMA", "EMA"],group = "MACD FILTER SETTINGS")
sma_signal = input.string(title="Signal Line MA Type", defval="EMA", options=["SMA", "EMA"],group = "MACD FILTER SETTINGS")

// Calculating
fast_ma = sma_source == "SMA" ? ta.sma(src_macd, fast_length) : ta.ema(src_macd, fast_length)
slow_ma = sma_source == "SMA" ? ta.sma(src_macd, slow_length) : ta.ema(src_macd, slow_length)
macd = fast_ma - slow_ma
signal = sma_signal == "SMA" ? ta.sma(macd, signal_length) : ta.ema(macd, signal_length)
hist = macd - signal

//tpsl
takeprofit=input.float(defval=0.3,title="Enter The Take Profit %",group="TP/SL CONDITION INPUTS HERE")/100
stoploss=input.float(defval=0.16,title="Enter The Stop %",group="TP/SL CONDITION INPUTS HERE")/100
tp = strategy.opentrades.entry_price(0)*takeprofit/syminfo.mintick
sl = strategy.opentrades.entry_price(0)*stoploss/syminfo.mintick

lg_rule = buysignal and hist > 0 and close > ema_fil
sh_rule = sellsignal and hist < 0 and close < ema_fil

// Plot Bull/Bear

plotshape(lg_rule, title='Bull', text='Bull', style=shape.triangleup, location=location.belowbar, color=color.new(color.green, 0), textcolor=color.new(color.black, 0), size=size.tiny)
plotshape(sh_rule, title='Bear', text='Bear', style=shape.triangledown, location=location.abovebar, color=color.new(color.red, 0), textcolor=color.new(color.black, 0), size=size.tiny)

//alert
lg_entryal = input("Long entry","Long entry alert",group = "ALERT MESSAGE SETTINGS")
sh_entryal = input("Short entry","Short entry alert",group = "ALERT MESSAGE SETTINGS")

if lg_rule and time_cond and barstate.isconfirmed
    strategy.entry("LONG",strategy.long)
    alert(lg_entryal,alert.freq_once_per_bar_close)
if strategy.position_size > 0
    strategy.exit("LONG EX","LONG",loss = sl,profit = tp,comment_loss = "LONG SL",comment_profit = "LONG TP")

if sh_rule and time_cond and barstate.isconfirmed
    strategy.entry("SHORT",strategy.short)
    alert(sh_entryal,alert.freq_once_per_bar_close)

if strategy.position_size < 0
    strategy.exit("SHORT EX","SHORT",loss = sl,profit = tp,comment_loss = "SHORT SL",comment_profit = "SHORT TP")

//end