Strategi Pengujian Ulang Sinyal Pembalikan Kunci
Ringkasan
Strategi pelacakan sinyal reversal kunci dengan mengidentifikasi sinyal reversal kunci dari harga saham, menilai apakah tren saat ini berbalik, untuk menangkap arah pergerakan harga setelah reversal tren. Strategi ini didasarkan pada teori kalender reversal kunci, melakukan lebih banyak shorting ketika sinyal reversal kunci ditemukan, dan mengunci keuntungan dengan mengkonfigurasi stop loss.
Prinsip Strategi
Logika inti dari strategi pelacakan sinyal pembalikan kunci adalah mengidentifikasi hari pembalikan kunci. Berdasarkan pergerakan harga saham, kita dapat menilai arah tren saat ini. Ketika muncul sinyal pembalikan kunci, menunjukkan kemungkinan pembalikan tren.
Secara khusus, untuk tren naik saham, jika harga minimum hari itu rendah, tetapi harga penutupan mendekati harga minimum hari sebelumnya, maka hari itu adalah hari pembalikan utama. Ini berarti kekuatan multi-head sedang melemah, kemampuan menahan tekanan menurun, yang menunjukkan bahwa tren naik mungkin berbalik ke bawah. Strategi akan membuka posisi pada hari pembalikan utama.
Sebaliknya, untuk tren turun saham, jika inovasi rendah pada hari itu, tetapi harga penutupan mendekati harga tertinggi hari sebelumnya. Maka ini juga merupakan hari pembalikan kunci, yang menunjukkan bahwa kekuatan kepala kosong melemah dan tren turun mungkin berbalik ke atas. Strategi akan melakukan lebih banyak posisi pada hari pembalikan kunci.
Strategi dapat menangkap pergerakan setelah harga berbalik dengan menilai hari-hari berbalik yang penting dan melacak pergerakan selanjutnya.
Analisis Keunggulan
Keuntungan utama dari strategi pengembalian sinyal kunci adalah:
Menangkap trend reversal, ruang keuntungan besar. Sinyal reversal kunci sering menunjukkan arah perubahan tren, dengan menilai sinyal reversal dan melacak operasional selanjutnya, ruang keuntungan yang lebih besar dapat diperoleh.
Aturan yang jelas, mudah untuk memetakan kembali verifikasi. Aturan penghakiman pada hari pembalikan kunci sangat jelas, harga inovasi tinggi atau baru rendah, sementara dengan harga penutupan hari sebelumnya membentuk bentuk pembalikan. Hal ini membuat strategi mudah untuk memetakan kembali, juga dapat mengurangi kesalahan penilaian.
Fleksibel dalam penyesuaian, mudah untuk dioptimalkan. Pengaturan stop loss sangat fleksibel, dapat disesuaikan dengan kondisi pasar dan preferensi risiko pribadi, untuk mengoptimalkan strategi dan mengurangi risiko kerugian.
Analisis risiko
Strategi pengembalian sinyal kunci juga memiliki beberapa risiko:
Risiko kesalahan penilaian pada sinyal reversal. Harga saham sering mengalami penyesuaian jangka pendek, dan tidak semua sinyal reversal penting menunjukkan perubahan tren, yang dapat menyebabkan kesalahan penilaian. Dengan mengoptimalkan parameter, penyesuaian kondisi stop loss dapat mengurangi kemungkinan kesalahan penilaian.
Risiko tidak berbalik atau terus berbalik setelah berbalik. Bahkan jika penilaian akurat, harga mungkin berbalik lagi setelah berbalik atau tren awal terus berjalan.
Penyimpangan pengembalian. Aturan dan sinyal apa pun yang berkinerja pada cakram nyata mungkin memiliki penyimpangan dengan hasil pengembalian, tidak dapat sepenuhnya mereproduksi keuntungan pengembalian.
Arah optimasi
Strategi pengembalian sinyal kunci yang dapat dioptimalkan:
Pengaturan Stop Loss yang dioptimalkan. Anda dapat menghitung titik Stop Loss yang tepat berdasarkan data sejarah yang lebih banyak.
Menambahkan kondisi penyaringan, digabungkan dengan indikator teknis lainnya untuk penyaringan kesalahan. Sebagai contoh, dapat digabungkan dengan volume lalu lintas untuk mengkonfirmasi sinyal pembalikan, untuk menghindari penipuan oleh operasi lelang.
Optimalkan strategi pelacakan setelah reversal. Operasi harga setelah reversal juga memiliki aturan yang dapat diikuti, menetapkan strategi pelacakan berikutnya, untuk memperluas pendapatan lebih lanjut.
Menggabungkan model pembelajaran mesin untuk menilai kualitas sinyal. Model pelatihan mengevaluasi keandalan setiap sinyal pembalikan kunci, menghindari pelacakan sinyal dengan kualitas yang lebih buruk.
Meringkaskan
Strategi sinyal pembalikan kunci dengan menentukan tanggal pembalikan kunci, menangkap peluang pembalikan tren harga. Aturan strategi sederhana dan jelas, mudah diterapkan. Setelah pembalikan tren terus berjalan, ada ruang yang luas, tetapi ada juga risiko kesalahan penilaian tertentu. Dengan terus mengoptimalkan parameter dan kondisi penyaringan, mengurangi probabilitas kesalahan penilaian, dapat memperoleh efek yang lebih andal.
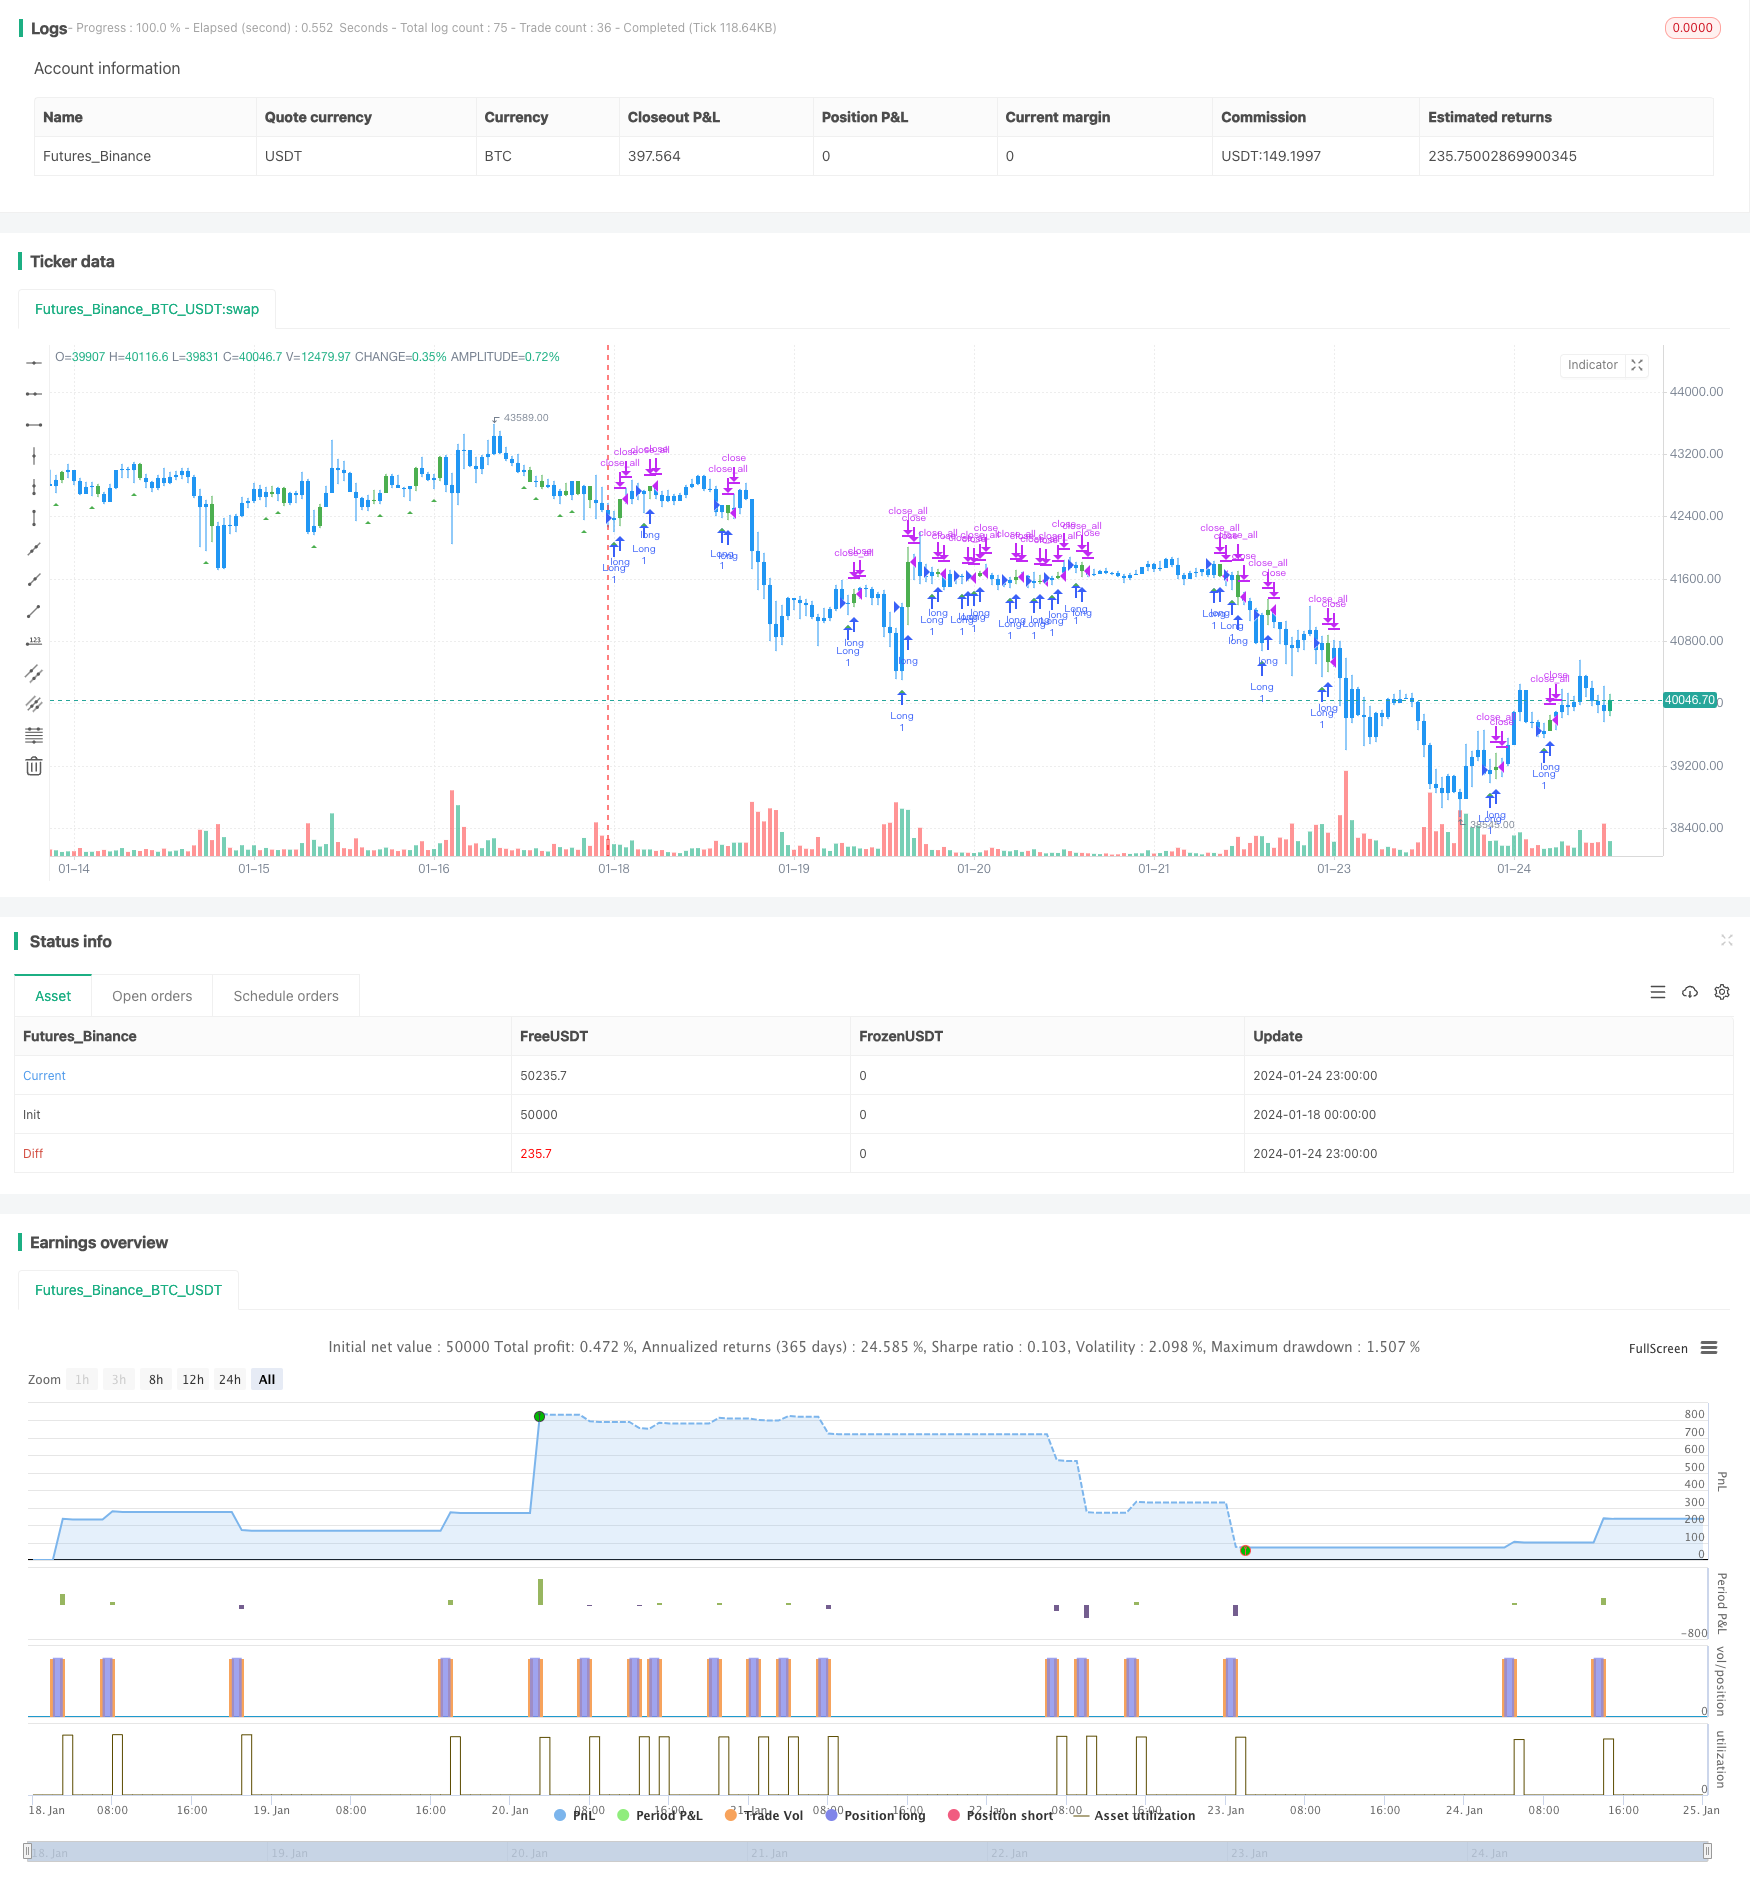
/*backtest
start: 2024-01-18 00:00:00
end: 2024-01-25 00:00:00
period: 1h
basePeriod: 15m
exchanges: [{"eid":"Futures_Binance","currency":"BTC_USDT"}]
*/

//@version=4
////////////////////////////////////////////////////////////
//  Copyright by HPotter v1.0 21/01/2020
//
// A key reversal is a one-day trading pattern that may signal the reversal of a trend.
// Other frequently-used names for key reversal include "one-day reversal" and "reversal day."
// How Does a Key Reversal Work?
// Depending on which way the stock is trending, a key reversal day occurs when:
// In an uptrend -- prices hit a new high and then close near the previous day's lows.
// In a downtrend -- prices hit a new low, but close near the previous day's highs
// WARNING:
// - For purpose educate only
// - This script to change bars colors.
////////////////////////////////////////////////////////////
strategy(title="Key Reversal Up Backtest", shorttitle="KRU Backtest", overlay = true)
nLength = input(1, minval=1, title="Enter the number of bars over which to look for a new low in prices.")
input_takeprofit = input(20, title="Take Profit pip", step=0.01)
input_stoploss = input(10, title="Stop Loss pip", step=0.01)
xLL = lowest(low[1], nLength)
C1 = iff(low < xLL and close > close[1], true, false)
plotshape(C1, style=shape.triangleup, size = size.small, color=color.green, location = location.belowbar )
posprice = 0.0
pos = 0
barcolor(nz(pos[1], 0) == -1 ? color.red: nz(pos[1], 0) == 1 ? color.green : color.blue )
posprice := iff(C1== true, close, nz(posprice[1], 0))
pos := iff(posprice > 0, 1, 0)
if (pos == 0)
    strategy.close_all()
if (pos == 1)
    strategy.entry("Long", strategy.long)
posprice := iff(low <= posprice - input_stoploss and posprice > 0, 0 ,  nz(posprice, 0))
posprice := iff(high >= posprice + input_takeprofit and posprice > 0, 0 ,  nz(posprice, 0))