Strategi perdagangan pelacakan candlestick grid dua arah
Ringkasan
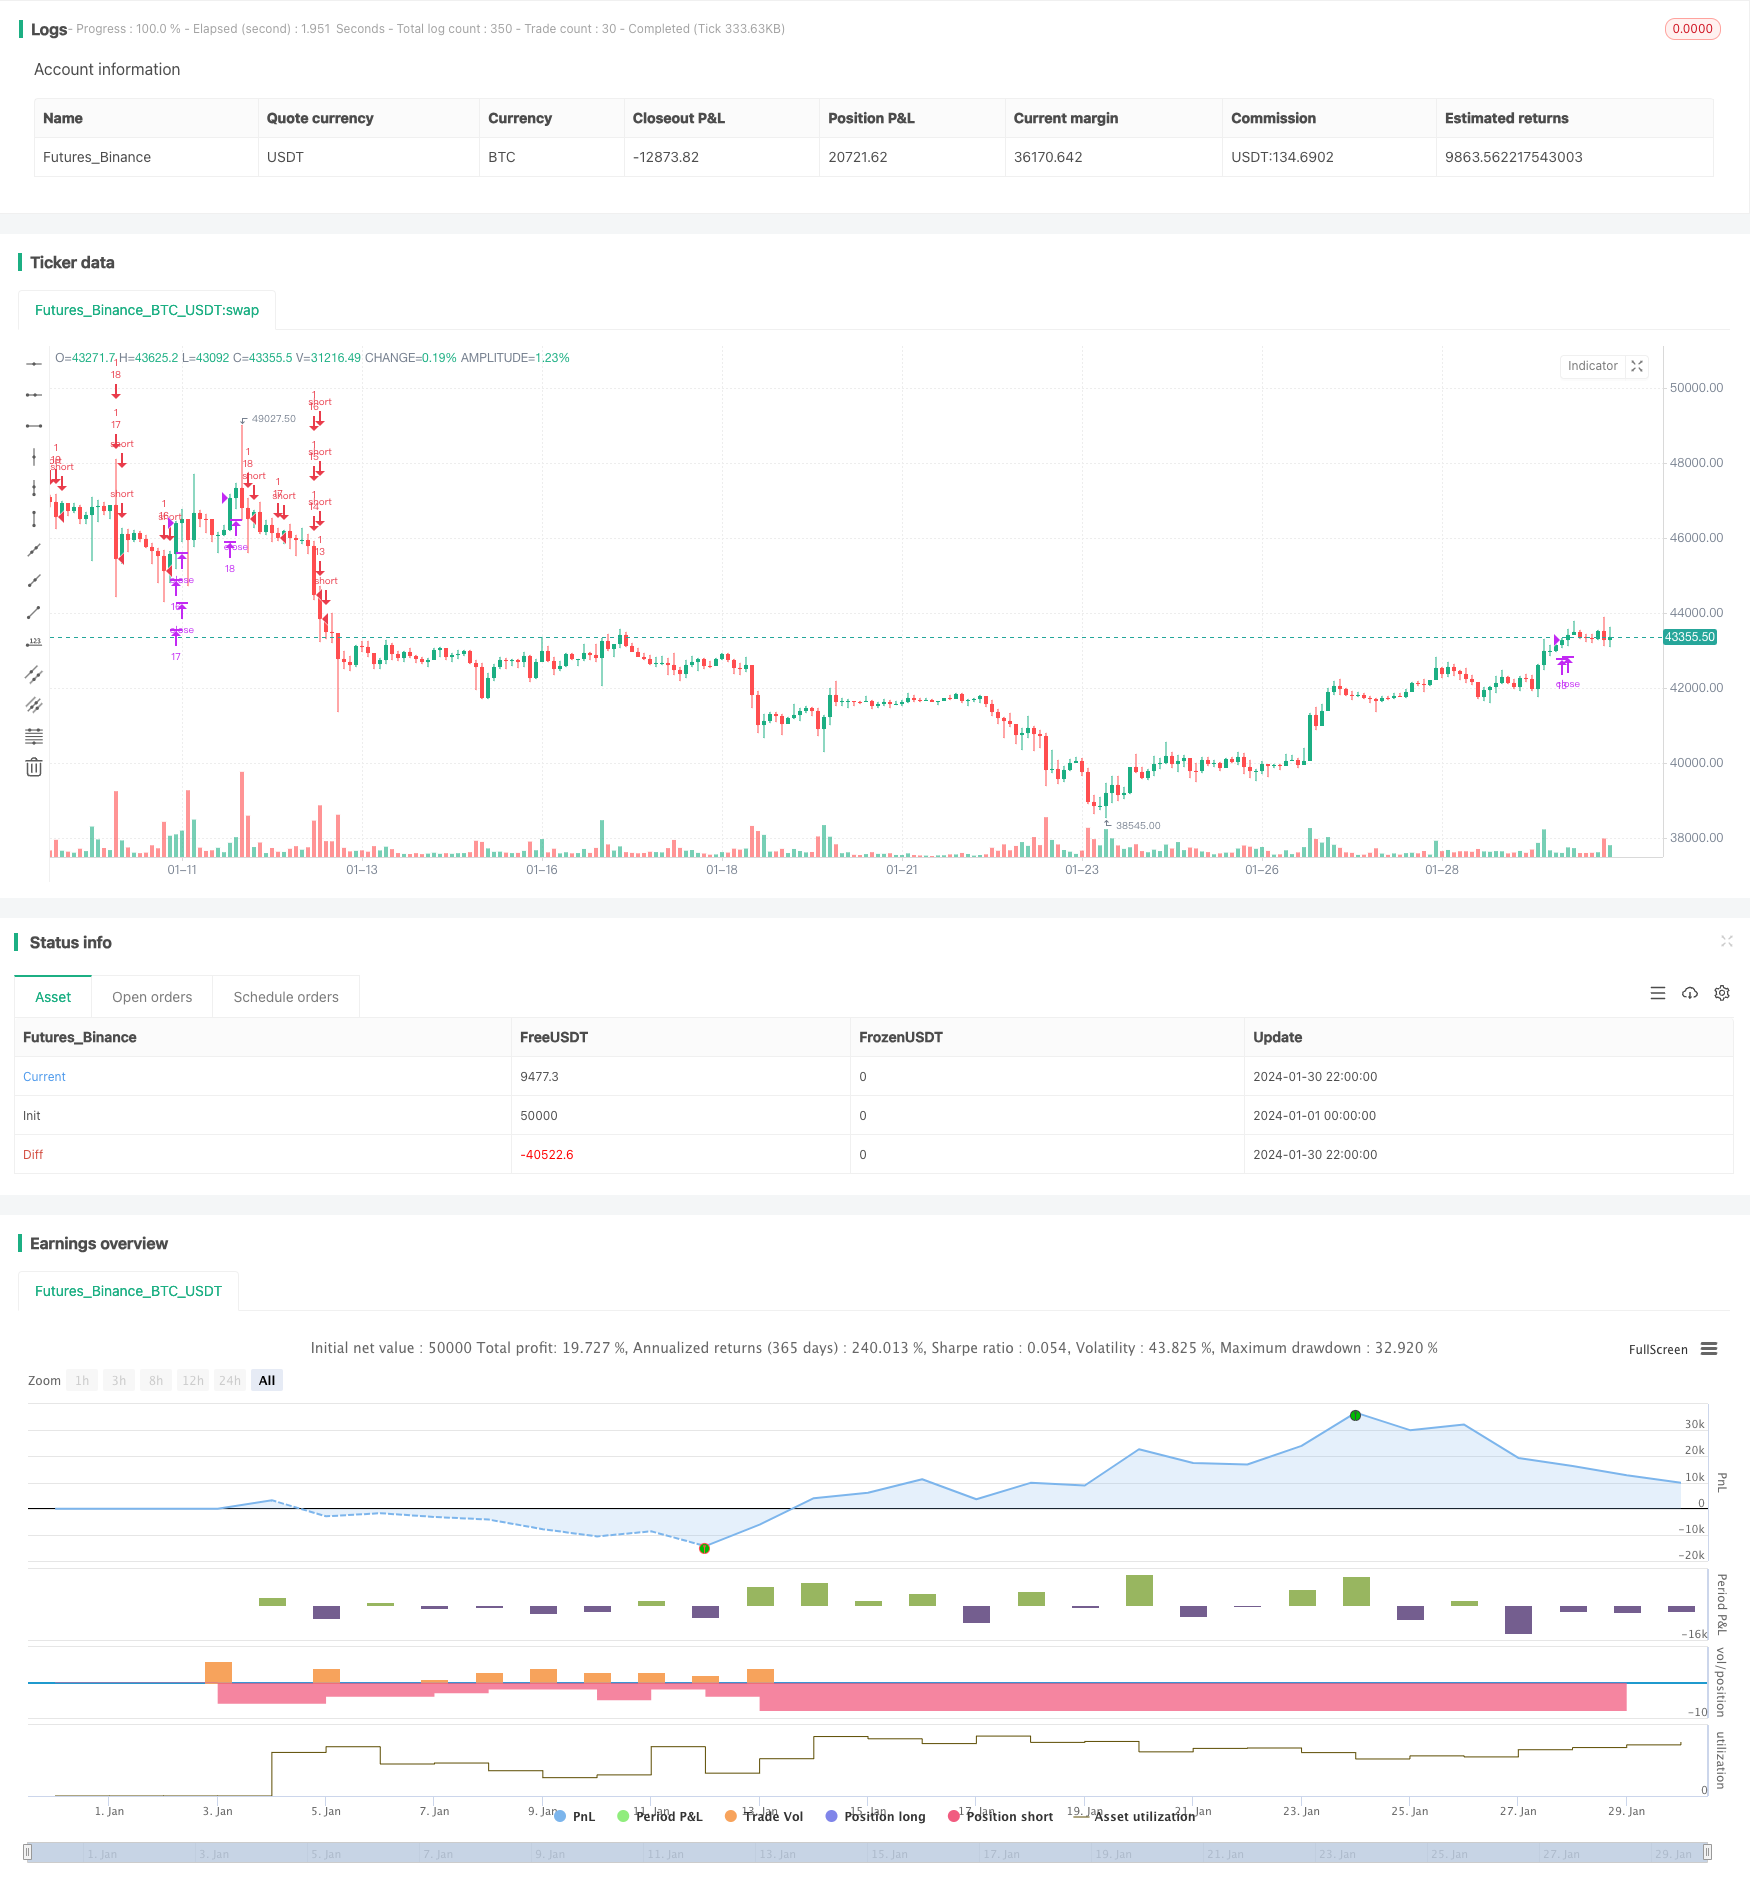
Strategi ini adalah strategi perdagangan grid dua arah yang mengikuti perubahan K-line secara real-time. Strategi ini dapat menghasilkan keuntungan yang stabil di pasar bull dan bear.
Prinsip Strategi
Bergantung pada jumlah grid yang disiapkan pengguna, harga grid akan dihitung secara otomatis dan harga untuk setiap grid.
Ketika harga menembus harga net, Anda melakukan over position dengan jumlah tetap; ketika harga turun di bawah harga net, Anda melakukan over position dan kosongkan posisi Anda.
Dengan cara ini, Anda bisa mendapatkan keuntungan dengan melacak perubahan harga saat harga berfluktuasi di area grid.
Analisis Keunggulan
Menghitung jarak grid yang wajar secara otomatis, tanpa harus menentukan resistensi dukungan secara manual.
Transaksi dua arah, dapat beradaptasi dengan kondisi pasar yang berubah.
Jumlah posisi yang tetap, yang membantu dalam pengendalian risiko.
Kode ini intuitif, sederhana, dan mudah dipahami dan dimodifikasi.
Analisis risiko
“Kemungkinan besar, perubahan besar-besaran dapat menyebabkan kerugian yang lebih besar”.
Akumulasi biaya transaksi juga mempengaruhi keuntungan akhir.
Perlu untuk menentukan jumlah grid secara rasional, terlalu banyak grid meningkatkan jumlah transaksi tetapi keuntungan terbatas setiap kali.
Arah optimasi
Bergabunglah dengan strategi stop loss untuk menghindari kerugian yang lebih besar.
Menambahkan fungsi penyesuaian jumlah grid secara dinamis.
Pertimbangkan untuk menggunakan leverage untuk meningkatkan volume transaksi.
Meringkaskan
Strategi ini memiliki konsep yang jelas dan sederhana, dengan melacak perdagangan grid dua arah untuk mendapatkan keuntungan yang stabil, tetapi juga ada risiko perdagangan tertentu. Dengan terus mengoptimalkan, diharapkan untuk mendapatkan hasil yang lebih baik.
/*backtest
start: 2024-01-01 00:00:00
end: 2024-01-31 00:00:00
period: 2h
basePeriod: 15m
exchanges: [{"eid":"Futures_Binance","currency":"BTC_USDT"}]
*/

//@version=4

//hk4jerry

strategy("Grid Bot Backtesting", overlay=false, pyramiding=3000, close_entries_rule="ANY", default_qty_type=strategy.cash, initial_capital=100.0, currency="USD", commission_type=strategy.commission.percent, commission_value=0.025)
i_autoBounds    = input(group="Grid Bounds", title="Use Auto Bounds?", defval=true, type=input.bool)                             // calculate upper and lower bound of the grid automatically? This will theorhetically be less profitable, but will certainly require less attention
i_boundSrc      = input(group="Grid Bounds", title="(Auto) Bound Source", defval="Hi & Low", options=["Hi & Low", "Average"])     // should bounds of the auto grid be calculated from recent High & Low, or from a Simple Moving Average
i_boundLookback = input(group="Grid Bounds", title="(Auto) Bound Lookback", defval=250, type=input.integer, maxval=500, minval=0) // when calculating auto grid bounds, how far back should we look for a High & Low, or what should the length be of our sma
i_boundDev      = input(group="Grid Bounds", title="(Auto) Bound Deviation", defval=0.10, type=input.float, maxval=1, minval=-1)  // if sourcing auto bounds from High & Low, this percentage will (positive) widen or (negative) narrow the bound limits. If sourcing from Average, this is the deviation (up and down) from the sma, and CANNOT be negative.
i_upperBound    = input(group="Grid Bounds", title="(Manual) Upper Boundry(상단 가격)", defval=0.285, type=input.float)                      // for manual grid bounds only. The upperbound price of your grid
i_lowerBound    = input(group="Grid Bounds", title="(Manual) Lower Boundry(하단 가격)", defval=0.225, type=input.float)                      // for manual grid bounds only. The lowerbound price of your grid.
i_gridQty       = input(group="Grid Lines",  title="Grid Line Quantity(그리드 수)", defval=30, maxval=999, minval=1, type=input.integer)       // how many grid lines are in your grid
initial_balance = input(group="Trading option", title="Initial balance(투자금액)", defval=100, step=0.01)


start_time = input(group="Trading option",defval=timestamp('15 March 2023 06:00'), title='Start Time', type = input.time)
end_time = input(group="Trading option",defval=timestamp('31 Dec 2035 20:00'), title='End Time', type = input.time)
isAfterStartDate = true

tradingtime= (timenow - start_time)/(86400000*30)
yeartime=tradingtime/12


f_getGridBounds(_bs, _bl, _bd, _up) =>
    if _bs == "Hi & Low"
        _up ? highest(close, _bl) * (1 + _bd) : lowest(close, _bl)  * (1 - _bd)
    else
        avg = sma(close, _bl)
        _up ? avg * (1 + _bd) : avg * (1 - _bd)

f_buildGrid(_lb, _gw, _gq) =>
    gridArr = array.new_float(0)
    for i=0 to _gq-1
        array.push(gridArr, _lb+(_gw*i))
    gridArr

f_getNearGridLines(_gridArr, _price) =>
    arr = array.new_int(3)
    for i = 0 to array.size(_gridArr)-1
        if array.get(_gridArr, i) > _price
            array.set(arr, 0, i == array.size(_gridArr)-1 ? i : i+1)
            array.set(arr, 1, i == 0 ? i : i-1)
            break
    arr

var upperBound      = i_autoBounds ? f_getGridBounds(i_boundSrc, i_boundLookback, i_boundDev, true) : i_upperBound  // upperbound of our grid
var lowerBound      = i_autoBounds ? f_getGridBounds(i_boundSrc, i_boundLookback, i_boundDev, false) : i_lowerBound // lowerbound of our grid
var gridWidth       = (upperBound - lowerBound)/(i_gridQty-1)                                                       // space between lines in our grid
var gridLineArr     = f_buildGrid(lowerBound, gridWidth, i_gridQty)                                                 // an array of prices that correspond to our grid lines
var orderArr        = array.new_bool(i_gridQty, false)                                                              // a boolean array that indicates if there is an open order corresponding to each grid line

var closeLineArr    = f_getNearGridLines(gridLineArr, close)                                                        // for plotting purposes - an array of 2 indices that correspond to grid lines near price
var nearTopGridLine = array.get(closeLineArr, 0)                                                                    // for plotting purposes - the index (in our grid line array) of the closest grid line above current price
var nearBotGridLine = array.get(closeLineArr, 1)                                                                    // for plotting purposes - the index (in our grid line array) of the closest grid line below current price
if isAfterStartDate
    for i = 0 to (array.size(gridLineArr) - 1)
        if close < array.get(gridLineArr, i) and not array.get(orderArr, i) and i < (array.size(gridLineArr) - 1)
            buyId = i
            array.set(orderArr, buyId, true)
            strategy.entry(id=tostring(buyId), long=true, qty=(initial_balance/(i_gridQty-1))/close, comment="#"+tostring(buyId))
        if close > array.get(gridLineArr, i) and i != 0
            if array.get(orderArr, i-1)
                sellId = i-1
                array.set(orderArr, sellId, false)
                strategy.close(id=tostring(sellId), comment="#"+tostring(sellId))

    if i_autoBounds
        upperBound  := f_getGridBounds(i_boundSrc, i_boundLookback, i_boundDev, true)
        lowerBound  := f_getGridBounds(i_boundSrc, i_boundLookback, i_boundDev, false)
        gridWidth   := (upperBound - lowerBound)/(i_gridQty-1)
        gridLineArr := f_buildGrid(lowerBound, gridWidth, i_gridQty)

    closeLineArr    := f_getNearGridLines(gridLineArr, close)
    nearTopGridLine := array.get(closeLineArr, 0)
    nearBotGridLine := array.get(closeLineArr, 1)


var table table = table.new(position.top_right,6,8, frame_color = color.rgb(255, 255, 255),frame_width = 2,border_width = 2, border_color=color.rgb(255, 255, 255))


//제목
table.cell(table,0,0,"Upper limit price :", bgcolor=color.new(color.black,0),text_color =color.white)
table.cell(table,0,1,"Lower limit price :",bgcolor=color.new(color.black,0),text_color =color.white)
table.cell(table,0,2,"Grids quantity :",bgcolor=color.new(color.black,0),text_color =color.white)
table.cell(table,0,3,"Investment :",text_color =color.white,bgcolor=color.new(color.black,0))
table.cell(table,0,4,"USDT per grid :",text_color =color.white,bgcolor=color.new(color.black,0))
//수치
table.cell(table,1,0, tostring(upperBound, '###.#####')+ "  USDT", bgcolor=color.new(#5a637e, 0),text_color =color.white)
table.cell(table,1,1, tostring(lowerBound, '###.#####')+ "  USDT", bgcolor=color.new(#5a637e, 0),text_color =color.white)
table.cell(table,1,2, tostring(i_gridQty, '###'), bgcolor=color.new(#5a637e, 0),text_color =color.white)
table.cell(table,1,3, tostring(initial_balance,'###.##')+ "  USDT", bgcolor=color.new(#5a637e, 0),text_color =color.white)
table.cell(table,1,4, tostring(initial_balance/i_gridQty,'###.##')+ "  USDT", bgcolor=color.new(#5a637e, 0),text_color =color.white)

//제목
table.cell(table,2,0,"Current position :",text_color =color.white,bgcolor=color.new(color.black,0))
table.cell(table,2,1,"Position cost price :",text_color =color.white,bgcolor=color.new(color.black,0))
table.cell(table,2,2,"Unrealized profit :",bgcolor=color.new(color.black,0),text_color =color.white)
table.cell(table,2,3,"Unrealized profit % :",bgcolor=color.new(color.black,0),text_color =color.white)
table.cell(table,2,4,"Fee :",text_color =color.white,bgcolor=color.new(color.black,0))

//수치
table.cell(table,3,0, tostring(strategy.position_size) +   syminfo.basecurrency + "\n"  + tostring(strategy.position_size*strategy.position_avg_price/1, '###.##') + "USDT" ,text_color =color.white,bgcolor=color.new(#5a637e, 0))
table.cell(table,3,1, text=strategy.position_size>0 ? tostring(strategy.position_avg_price,'###.####')+ "  USDT" : "NOT TRADING",text_color =color.white,bgcolor=color.new(#5a637e, 0))
table.cell(table,3,2, tostring(strategy.openprofit, '###.##')+ "  USDT",text_color =color.white,bgcolor=strategy.openprofit > 0 ? color.teal : color.maroon)
table.cell(table,3,3, tostring(strategy.openprofit/initial_balance*100, '###.##')+ "%",text_color =color.white,bgcolor=strategy.openprofit > 0 ? color.teal : color.maroon)
table.cell(table,3,4, "-" + tostring(strategy.position_avg_price*strategy.position_size*0.025/100,'###.##')+ "  USDT",text_color =color.white,bgcolor=color.new(#5a637e, 0))

//제목
table.cell(table,4,0,"Grid profit :",text_color =color.white,bgcolor=color.new(color.black,0))
table.cell(table,4,1,"Grid profit % :",text_color =color.white,bgcolor=color.new(color.black,0))
table.cell(table,4,2,"Net profit :", bgcolor=color.new(color.black,0),text_color =color.white)
table.cell(table,4,3,"Net profit % :",bgcolor=color.new(color.black,0),text_color =color.white)
table.cell(table,4,4,"Balance USDT :",bgcolor=color.new(color.black,0),text_color =color.white)


//수치
table.cell(table,5,0, tostring(strategy.netprofit, '###.#####')+ "USDT", text_color =color.white,bgcolor=strategy.netprofit > 0 ? color.teal : color.maroon)
table.cell(table,5,1, tostring((strategy.netprofit)/initial_balance*100/tradingtime, '####.##') + "%",text_color =color.white,bgcolor=strategy.netprofit > 0 ? color.teal : color.maroon)
table.cell(table,5,2, tostring(strategy.netprofit+strategy.openprofit, '###.##') + "  USDT",text_color =color.white,bgcolor=strategy.netprofit+strategy.openprofit > 0 ? color.teal : color.maroon)
table.cell(table,5,3, tostring((strategy.netprofit+strategy.openprofit)/initial_balance*100, '####.##') + "%",text_color =color.white,bgcolor=strategy.netprofit+strategy.openprofit > 0 ? color.teal : color.maroon)
table.cell(table,5,4, tostring(initial_balance+strategy.netprofit+strategy.openprofit, '###.##')+ "  USDT", text_color =color.white,bgcolor=color.new(#3d4d7c, 0))


// plot(strategy.initial_capital+ strategy.netprofit+strategy.openprofit, "Current Balance",color=color.rgb(81, 137, 128))
// plot(initial_balance, "Investment",color=color.rgb(81, 137, 128))