Strategi perdagangan breakout berbasis momentum
Ringkasan
Strategi ini adalah strategi perdagangan yang didasarkan pada indikator momentum. Strategi ini menggunakan beberapa indikator untuk menilai tren dan volatilitas pasar, seperti rata-rata, ATR, RSI, dan lain-lain, yang dikombinasikan dengan pengaturan stop loss yang ketat untuk melakukan perdagangan. Strategi ini terutama menentukan apakah harga akan menembus garis naik atau turun rata-rata ditambah dengan rentang ATR untuk menghasilkan sinyal perdagangan.
Prinsip Strategi
Strategi ini didasarkan pada beberapa poin:
Menggunakan EMA untuk menentukan arah tren harga. Di atas garis rata-rata untuk sinyal bullish, di bawah untuk sinyal bearish.
Indikator ATR menilai volatilitas pasar. ATR dikalikan dengan faktor sebagai stop loss. Hal ini dapat secara efektif mengendalikan kerugian tunggal.
Indikator RSI menilai overbought dan oversold. ATR Stop Loss Price dan Average Line Judgment harus memicu perdagangan yang melanggar jika RSI tidak melampaui overbought dan oversold. Hal ini dapat mencegah terjadinya false breakout.
Menggunakan titik tinggi atau rendah di awal periode sebagai dasar untuk berhenti. Melacak harga berhenti dapat mengunci lebih banyak keuntungan.
Aturan Stop Loss yang ketat. ATR Stop Loss yang dikombinasikan dengan indikator volatilitas dapat mengontrol risiko, dan pengaturan Stop Loss dapat mengunci keuntungan.
Sinyal masuk adalah harga menerobos garis rata-rata ditambah batas stop loss ATR. Jika itu adalah sinyal bullish, maka harga perlu naik melewati titik tinggi; Jika itu adalah sinyal bearish, maka harga perlu menembus titik rendah.
Analisis Keunggulan
Strategi ini memiliki keuntungan sebagai berikut:
Pengadilan multi-indikator dapat mencegah penembusan palsu dan meningkatkan akurasi sinyal
ATR Stop Loss Range pengaturan untuk mengendalikan kerugian pada tingkat yang wajar
Tracking Stop Stop Dinamis Untuk Memaksimalkan Keuntungan
Aturan Stop Loss yang ketat membantu mengendalikan risiko
Optimalisasi indikator dan parameter yang luas, dapat disesuaikan dengan pasar yang berbeda
Analisis risiko
Strategi ini juga memiliki risiko sebagai berikut:
Kemampuan untuk mendapatkan keuntungan terkait dengan volatilitas pasar. Ketika tren pasar tidak jelas atau siklus yang panjang, ruang untuk mendapatkan keuntungan terbatas.
Mungkin terjadi penembusan harga stop loss setelah bergejolak. Ini akan menyebabkan ketidakmampuan untuk membangun posisi dalam waktu yang tepat untuk melacak tren. Anda dapat meredakan harga stop loss dengan tepat.
chasing。
Arah optimasi
Strategi ini dapat dioptimalkan dalam beberapa hal:
Parameter garis rata-rata, ATR, dan lain-lain disesuaikan dengan varietas dan periode.
Ada banyak indikator yang bisa digunakan untuk menilai, seperti MACD, KDJ, dan lain-lain.
Koefisien stop loss dapat disesuaikan secara real-time berdasarkan nilai ATR. Stop loss dapat disesuaikan dengan fluktuasi pasar.
Membangun kombinasi dari beberapa periode waktu. Kombinasi indikator periode yang berbeda dapat meningkatkan kualitas sinyal.
Menggunakan teknologi pembelajaran mesin untuk menguji dan mengoptimalkan indikator dan parameter, sehingga parameter strategi menjadi optimal.
Meringkaskan
Strategi ini secara keseluruhan adalah strategi perdagangan terobosan yang menggunakan indikator untuk menilai dan menghentikan stop loss secara ketat. Strategi ini memanfaatkan keuntungan dari indikator seperti garis rata-rata, ATR, dan RSI, sehingga dapat menentukan arah tren pasar secara efektif.
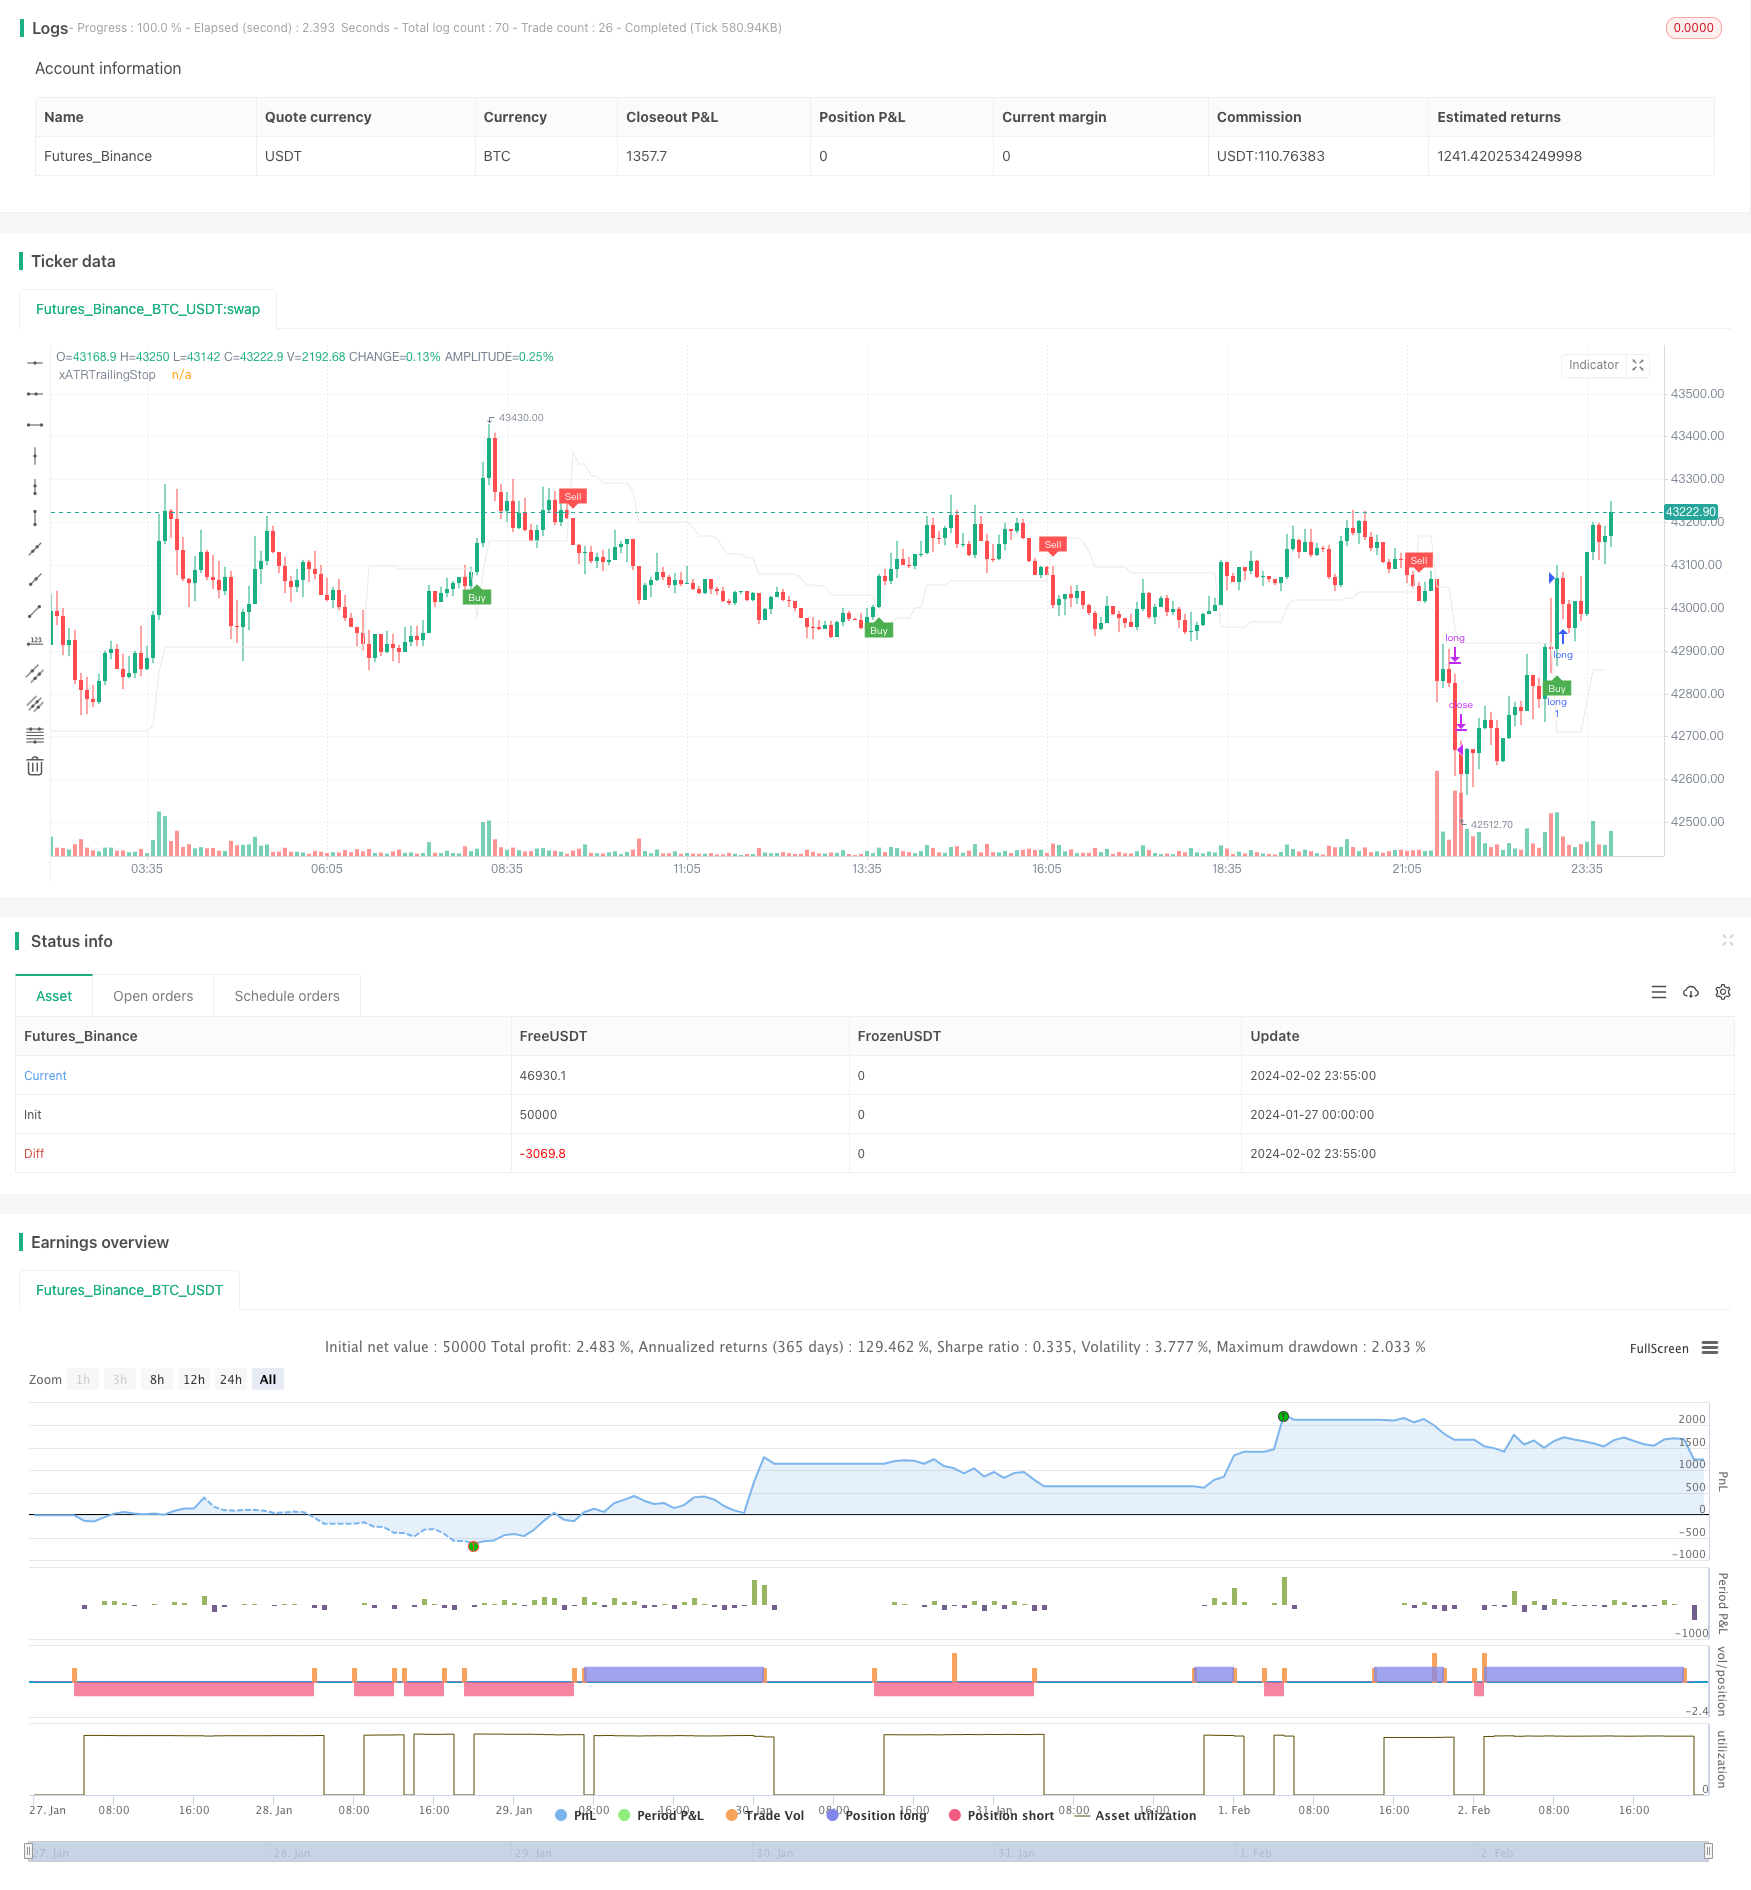
/*backtest
start: 2024-01-27 00:00:00
end: 2024-02-03 00:00:00
period: 5m
basePeriod: 1m
exchanges: [{"eid":"Futures_Binance","currency":"BTC_USDT"}]
*/

//@version=4
strategy(title="UT Bot Strategy", overlay = true)
//CREDITS to HPotter for the orginal code. The guy trying to sell this as his own is a scammer lol.
// Inputs
emaLengh = input(2, title = "emaLengh")
a = input(3.0,     title = "Key Vaule. 'This changes the sensitivity'")
c = input(10,    title = "ATR Period")
h = input(false, title = "Signals from Heikin Ashi Candles")
emaLengh2 = input(9, title = "emaLengh show")


rate = input(0.00025,    title = "波动率min")
rateMax = input(0.00045,    title = "波动率max")
adx_length =   input(20,    title = "adx_length")
adx_min =   input(14,    title = "adx_min")

sma_length =   input(11,    title = "sma_length")
rsi_len = input(9, title = "rsi_len")

src = h ? security(heikinashi(syminfo.tickerid), timeframe.period, close, lookahead = false) : close

// boll 通道----------------------------------------------------
length = input(20, minval=1)
mult = input(2.0, minval=0.001, maxval=50, title="StdDev")
basis = sma(src, length)
dev = mult * stdev(src, length)
upper = basis + dev
lower = basis - dev
bbr = (src - lower)/(upper - lower)
// plot(upper, color = color.rgb(46, 59, 240), title="upper")
// plot(lower, color = color.rgb(46, 59, 240), title="lower")


// plot(bbr, "Bollinger Bands %B", color=#26A69A)
// band1 = hline(1, "Overbought", color=#787B86, linestyle=hline.style_dashed)
// hline(0.5, "Middle Band", color=color.new(#787B86, 50))
// band0 = hline(0, "Oversold", color=#787B86, linestyle=hline.style_dashed)
// fill(band1, band0, color=color.rgb(38, 166, 154, 90), title="Background")
// boll 通道----------------------------------------------------

// 线性回归 --------------------------------------------------------------
zlsma_length = input(title="zlsma-Length", type=input.integer, defval=50)
zlsma_offset = input(title="zlsma-Offset", type=input.integer, defval=0)
lsma = linreg(src, zlsma_length, zlsma_offset)
lsma2 = linreg(lsma, zlsma_length, zlsma_offset)
eq= lsma-lsma2
zlsma = lsma+eq
// plot(zlsma , color = color.rgb(243, 243, 14), title="zlsma",linewidth=3)
// 线性回归 --------------------------------------------------------------


// --------------------------------
rsi = rsi(src, 6)

// xHH = sma(high, sma_length)
// xLL = sma(low, sma_length)
// movevalue = (xHH - xLL) / 2
// xHHM = xHH + movevalue
// xLLM = xLL - movevalue

// plot(xHHM, color = color.rgb(208, 120, 219), title="xHHM")
// plot(xLLM, color = color.rgb(208, 120, 219), title="xLLM")


xATR  = atr(c)
nLoss = a * xATR


xATRTrailingStop = 0.0
xATRTrailingStop := iff(src > nz(xATRTrailingStop[1], 0) and src[1] > nz(xATRTrailingStop[1], 0), max(nz(xATRTrailingStop[1]), src - nLoss),
   iff(src < nz(xATRTrailingStop[1], 0) and src[1] < nz(xATRTrailingStop[1], 0), min(nz(xATRTrailingStop[1]), src + nLoss),
   iff(src > nz(xATRTrailingStop[1], 0), src - nLoss, src + nLoss)))


pos = 0
pos :=	iff(src[1] < nz(xATRTrailingStop[1], 0) and src > nz(xATRTrailingStop[1], 0), 1,
   iff(src[1] > nz(xATRTrailingStop[1], 0) and src < nz(xATRTrailingStop[1], 0), -1, nz(pos[1], 0)))

xcolor = pos == -1 ? color.red: pos == 1 ? color.green : color.blue

ema   = ema(src,emaLengh)
// sma   = sma(src,emaLengh)
emaFast   = ema(src,100)
emaSlow   = ema(src,576)
emaShow   = ema(src, emaLengh2)
// sma       =  sma(src, 8)

// [superTrend, dir] = supertrend(3, 200)
// 判断连续涨

[diplus, diminus, adx] = dmi(adx_length, adx_length)


above = crossover(ema, xATRTrailingStop)
below = crossover(xATRTrailingStop, ema)
// above = ema == xATRTrailingStop
// below = xATRTrailingStop== ema

// smaabove = crossover(src, sma)
// smabelow = crossover(sma, src)
// smaabove = src > sma
// smabelow = sma > src
close_rate (n)=>
    abs(close[n]-open[n])/min(close[n],open[n])

rate_val = close_rate(0)
rate_val1 = close_rate(1)

buy  = src > xATRTrailingStop and above  and src > zlsma  and adx >adx_min
// and  src>emaShow
// and rate_val < rate_val1*2 and rate_val >=rate_val1
// and rate_val1<rateMax
// and close[1]>open[1]
sell = src < xATRTrailingStop and below  and src < zlsma and adx >adx_min
// and  src<emaShow
// and rate_val < rate_val1*2  and rate_val >=rate_val1
//  and rate_val1<rateMax
// and open[1]>close[1]  and rate_val1 > rate

// buy  = src > xATRTrailingStop
// sell = src < xATRTrailingStop
// plot(rate_val1 , color = color.red, title="rate_val1")


barbuy  = src > xATRTrailingStop
barsell = src < xATRTrailingStop

atrRsi = rsi(xATRTrailingStop,rsi_len)

// plot(emaFast , color = color.rgb(243, 206, 127), title="emaFast")
// plot(ema , color = color.rgb(47, 227, 27), title="ut-ema")


// plot(emaShow , color = color.rgb(47, 227, 27), title="ema9")

plot(xATRTrailingStop, color = color.rgb(233, 233, 232), title="xATRTrailingStop")

plotshape(buy,  title = "Buy",  text = 'Buy',  style = shape.labelup,   location = location.belowbar, color= color.green, textcolor = color.white, size = size.tiny)
plotshape(sell, title = "Sell", text = 'Sell', style = shape.labeldown, location = location.abovebar, color= color.red,   textcolor = color.white, size = size.tiny)


// plotshape(buy,  title = "Sell",  text = 'Sell',  style = shape.labelup,   location = location.belowbar, color= color.green, textcolor = color.white, transp = 0, size = size.tiny)
// plotshape(sell, title = "buy", text = 'buy', style = shape.labeldown, location = location.abovebar, color= color.red,   textcolor = color.white, transp = 0, size = size.tiny)

// barcolor(barbuy  ? color.green : na)
// barcolor(barsell ? color.red   : na)

// strategy.entry("short",   false, when = buy)
// strategy.entry("long ", true, when = sell)


strategy.entry("long",   true, when = buy and strategy.position_size == 0)
strategy.entry("short", false, when = sell and strategy.position_size == 0)


//动态止盈start------------------------------------------------------------------------------------------
profit = input( 0.015,     title = "最小收益率")
close_profit_rate = input( 10,     title = "平仓收益回撤比")
loss = input(0.004,    title = "回撤率")

// 收益回撤比例
profit_price_scale =profit/close_profit_rate

var float profit_price = 0


// 计算小收益价格

get_profit_price(long) =>
    float res = 0
    if long == true
        res := strategy.position_avg_price * (1+profit)
    if long == false
        res := strategy.position_avg_price * (1-profit)
    res

// 止盈平仓条件
close_profit_position(long)=>
    bool result=false
    if long == true and profit_price>0 and profit_price*(1-profit_price_scale) >=close and  get_profit_price(true) <= close
        result:=true
    if long == false and profit_price>0 and profit_price*(1+profit_price_scale) <=close and  get_profit_price(false) >= close
        result:=true
    result

// 更新动态止盈价格
update_profit_price(price)=>
    float res = price
   // 无仓位时 动态止盈价格为0
    if strategy.position_size == 0
        res := 0
   // long - 价格大于最小收益时保存
    if strategy.position_size > 0 and get_profit_price(true) <= close and (res==0 or res < close)
        res := close
   // short - 价格小于最小收益时保存
    if strategy.position_size < 0 and get_profit_price(true) >= close and (res==0 or res > close)
        res := close
    res

///////


profit_price := update_profit_price(profit_price)
long_close_profit_position = close_profit_position(true)
short_close_profit_position = close_profit_position(false)

// plot(profit_price, color = color.green, title="profit_price")
//动态止盈end------------------------------------------------------------------------------------------


strategy.close("long",comment="long-止盈",when = strategy.position_size > 0 and long_close_profit_position)

strategy.close("long",comment="long-止损",when = strategy.position_size >0 and strategy.position_avg_price * (1-loss) >= close)

strategy.close("short",comment="short-止盈",when = strategy.position_size <0 and short_close_profit_position)

strategy.close("short",comment="short-止损",when = strategy.position_size <0 and strategy.position_avg_price * (1+loss) <= close)